
加密市场宏观研报:比特币重返8万美元,美伊局势大逆转与美联储换帅
- 핵심 의견: 2026년 5월, 암호화폐 시장은 지정학(미-이란 갈등), 통화 정책(연준 의장 교체), 기관화 심화(ETF 역추세 매수)라는 세 가지 주요 변수가 얽힌 복잡한 지점에 있습니다. 거시적 역풍이 지속됨에도 불구하고, 기관 및 장기 보유자의 코인 잠금 행동과 반감기 주기 패턴은 현재가 약세장의 시작이라기보다는 강세장 내에서의 조정 국면일 가능성이更高음을 시사합니다.
- 핵심 요소:
- 지정학적 게임의 급변: 미-이란 '자유 계획' 호위 작전이 극적으로 중단되었지만, 홀무즈 해협의 실질적 봉쇄 위험은 사라지지 않았습니다. 유가 급등은 이미 골드만삭스의 근원 개인소비지출(PCE) 인플레이션 예측치를 2.6%까지 끌어올리며 '스태그플레이션' 형태의 거시 환경을 조성, 비트코인의 안전자산 속성과 위험자산 가치 평가를 양방향으로 억압하고 있습니다.
- 연준 정책의 기로: 워시가 파월을 대체하여 의장이 되며, 그의 '매파적-비둘기파적 혼합' 입장과 내부 이견이 정책 불확실성을 가중시키고 있습니다. 베이지북(Beige Book)은 에너지 비용의 전반적인 상승이 기업 이익을 잠식하고 있음을 보여주며, 금리 인하 경로는 더욱 험난해질 것이며, 유동성에 민감한 암호화폐 시장에 중기적인 압박으로 작용할 것입니다.
- 기관의 역추세 매수 신호 명확: 가격이 76,000~81,000 달러 구간으로 후퇴했을 때, 현물 BTC ETF 일일 순유입액은 6.3억 달러에 달했습니다. 5월 초 기준, ETF 총 자산 순가치는 1,037.85억 달러로 BTC 총 시가총액의 6.66%를 차지하며, 기관들이 약세장 속에서도 안정적으로 포지션을 구축하고 있음을 나타냅니다.
- 수급 구조의 심오한 변화: ETF 승인 이후 누적 흡수량은 58만 BTC(약 3년 치 생산량)를 초과했으며, 장기 보유자의 공급량이 지속적으로 증가하고 있습니다. 이러한 이중 잠금 구조는 실질 유통 공급을 감소시켜 가격에 암묵적인 바닥 지지대를 제공합니다.
- 반감기 주기 패턴 검증: 현재 시점(2026년 5월)은 2024년 4월 반감기 이후 12~18개월 가격 발견 창 내에 위치합니다. 역사적 패턴은 이 단계가 종종 '세탁 및 축적' 국면이지 주기적 정점이 아님을 보여주지만, 기관화된 새로운 환경에서의 유효성은 불확실합니다.
1. Geopolitical Chess: The "Freedom Plan" Reversal in the Strait of Hormuz and Resurgent Inflation
On May 4, 2026, U.S. President Donald Trump announced on Truth Social that the U.S. would formally initiate the "Freedom Plan" escort operation for merchant ships in the Strait of Hormuz at noon Middle East time, deploying missile destroyers, over 100 land and sea-based aircraft, multi-domain unmanned platforms, and 15,000 active-duty troops. The U.S. characterized it as a "defensive humanitarian operation," aiming to circumvent the 60-day authorization limit for presidential military actions under the War Powers Resolution. However, just one day later, Trump issued another post stating that, given "significant progress in comprehensive U.S.-Iran negotiations," he decided to suspend the "Freedom Plan," but emphasized that the naval blockade of Iran "will continue to be fully and effectively implemented." This dramatic reversal caught global markets off guard, causing crude oil prices to fluctuate wildly following the announcement.
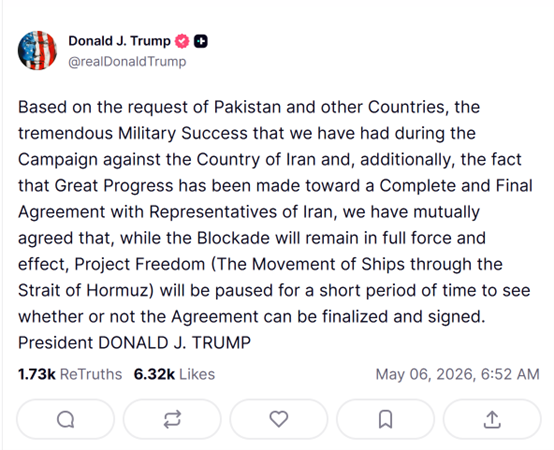
Iran's stance was far more强硬 than the U.S. statements suggested. Ali Akbar Velayati, a senior advisor to Iran's Supreme Leader for foreign affairs, explicitly stated that the Strait of Hormuz is closed and will not reopen "unless the national will of the Islamic Republic of Iran decides otherwise"; all vessels planning to transit the strait must submit applications via official email and receive permission from Iran before passage. The chairman of the Iranian Parliament's National Security Committee warned that any foreign military forces, especially U.S. forces, approaching or entering the Strait of Hormuz would be targeted. On key issues such as the nature of the ceasefire, the right of passage through the strait, and whether the "Freedom Plan" is truly suspended, the positions of the U.S. and Iran are sharply divided, indicating that the market's pricing of geopolitical risk is far from over.
The direct consequences of this geopolitical game are already emerging in global inflation data. Driven by the dual shocks of escalating U.S.-Iran military conflict and the UAE's announcement on May 1 to withdraw from the OPEC+ alliance, international oil prices have been rising continuously from late April to early May, pushing energy prices significantly higher. Goldman Sachs subsequently raised its year-end core PCE inflation forecast from 2.5% to 2.6% and its overall PCE forecast from 3.1% to 3.4%. More alarmingly, this inflationary push does not stem from overheating demand but from supply-side shocks (oil prices) compounded by tariff effects. This complicates the Federal Reserve's monetary policy response mechanism—daring neither to raise interest rates (for fear of exacerbating economic downside pressure) nor to initiate rate cuts (due to the rising risk of de-anchored inflation expectations). For Bitcoin, this "stagflationary" macro environment has historically exerted downward pressure from two directions: its safe-haven status has yet to gain widespread recognition, while expectations of tightening liquidity continue to suppress risk asset valuations.
2. On the Eve of a Fed Chair Change: The Beige Book Warning and the Crossroads of Policy Independence
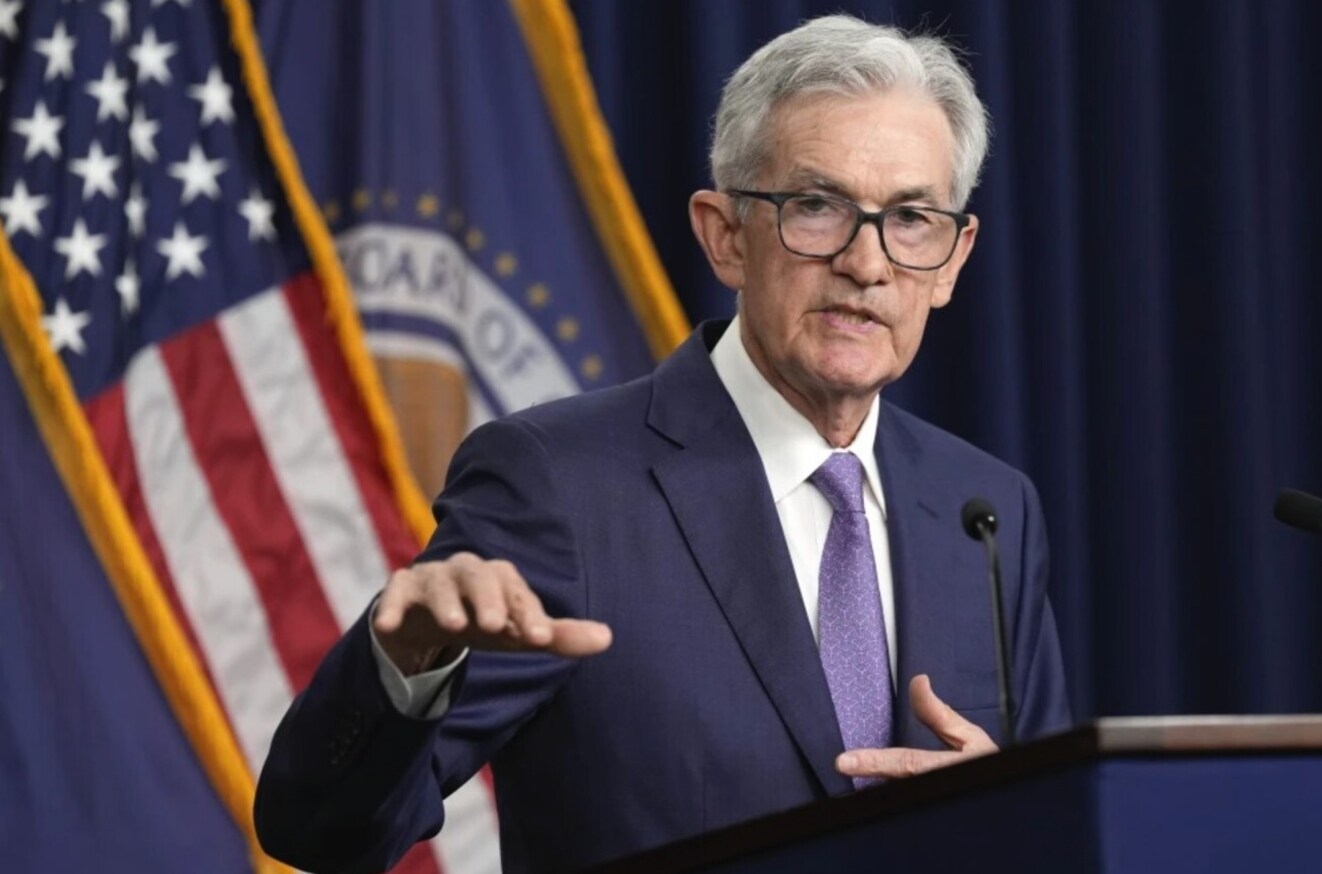
In mid-May 2026, the Federal Reserve is set to witness its most controversial leadership transition in modern history: Kevin Warsh will officially succeed Jerome Powell as Fed Chair. Breaking a 75-year tradition, Powell will remain a Fed Governor after stepping down as Chair. This arrangement is widely interpreted by the market as a political compromise indicating that the White House and the Fed are not "fully decoupled." Warsh's policy stance exhibits a subtle "hawkish-dovish mix": he is hawkish on inflation control and balance sheet management, emphasizing monetary policy discipline and a framework overhaul, and has publicly criticized the Fed's ultra-loose policies over the past two decades for "seriously deviating from its mission." However, he leans dovish on the path of long-term interest rates, acknowledging the natural disinflationary effects of technological progress and supporting rate cuts when data allows. This mixed stance creates significant divergence in market expectations regarding the monetary policy path under the "Warsh era," making it a key source of uncertainty for macro pricing in the crypto market in May.
The Fed's meeting concluding on April 30 was the last one chaired by Powell. As widely expected, the federal funds rate was held steady at 3.50% to 3.75%. The post-meeting statement and Powell's press conference conveyed a complex signal. On one hand, the impact of rising energy prices on inflation "has already begun to appear and could expand further in the short term." Powell explicitly stated, "No official currently supports a rate hike, but some officials advocate for toning down the accommodative bias in the meeting statement." On the other hand, Powell emphasized that he would "not become a shadow chair" after stepping down, attempting to assuage market concerns about damage to the Fed's policy independence. However, internal divisions at the Fed became apparent just days after the meeting: Trump-nominated Governor Stephen Milan dissented in favor of a rate cut, while hawks like Cleveland Fed President Beth Hammack and Minneapolis Fed President Neel Kashkari also dissented (but in favor of holding rates steady). The intensity of the internal rift casts a long shadow of high uncertainty over Warsh's first meeting as Chair.
The Fed's Beige Book, released on April 16, provides a valuable grassroots perspective on the current state of the U.S. economy. The report indicated that of the 12 Federal Reserve Districts, eight experienced slight to modest economic expansion, two saw little change, and two experienced slight to modest declines. The most notable inflation-related statement was: "Energy and fuel costs rose significantly across all 12 Districts." Businesses broadly reported that input cost increases outpaced selling price increases, squeezing profit margins. Decision-making regarding hiring, pricing, and capital investment has become more complex for businesses, with "waiting and seeing" becoming the most common business strategy. For crypto assets, the core signal from the Beige Book is that while the U.S. economy isn't in recession, its growth momentum is being eroded by energy-driven inflation. The Fed's rate cut path will be more convoluted than previously expected by the market, which, for the liquidity-sensitive crypto market, constitutes a persistently restrictive macro backdrop in the medium term.
3. Deepening Institutionalization: ETFs Attract Inflows Against the Trend and Miner Balance Sheet Optimization
Against the backdrop of a significant pullback in Bitcoin's price from its highs, contrarian buying by institutional capital stands out as the most noteworthy structural signal in the crypto market during May 2026. According to SoSoValue data, U.S. spot Bitcoin ETFs saw a massive single-day net inflow of $630 million on May 1 (EDT), with BlackRock's IBIT leading at $284 million and Fidelity's FBTC second at $213 million. On May 4, spot ETFs recorded another $532 million in net inflows. This capital flow shows a significant divergence from BTC's price trend: prices oscillated repeatedly in the $76,000–$81,000 range, yet ETFs continued to see net inflows, indicating that institutions are steadily building positions during price weakness, a pattern distinct from retail-driven fear of missing out (FOMO). As of early May, the total net assets of U.S. spot BTC ETFs reached $103.785 billion, representing approximately 6.66% of BTC's total market cap. The rising share of institutional holdings is fundamentally altering Bitcoin's price discovery mechanism, transitioning it from a volatile, retail-driven speculative asset towards an institutional allocation asset.
From a broader perspective, the deepening institutionalization process is reshaping Bitcoin's supply-demand balance. Since the approval of U.S. spot Bitcoin ETFs in January 2024, the ETF channel has accumulated over 580,000 BTC, an amount equivalent to roughly three years' worth of Bitcoin network issuance. Simultaneously, the supply held by long-term holders has been rising consistently since mid-February 2026, indicating that long-term investors' willingness to hold increases rather than decreases during price corrections. This dual "institutional + long-term holder" lock-up dynamic continuously contracts Bitcoin's available circulating supply, providing implicit downside support for prices amid macro headwinds.
4. Bitcoin Returns to $80,000: Exploring the Halving Cycle Pattern and the Bull-Bear Dialectic at the Current Juncture
At the beginning of May 2026, Bitcoin is staging a key comeback from a deep correction. BTC dipped to lows near $60,000 in early February before strongly rebounding and reclaiming the $80,000 mark in early May, representing a rebound of over 33% from the cycle low. While this "return to $80,000" is still about 46% below the all-time high set in October 2025, the current correction exhibits starkly different structural characteristics compared to the brutal bear markets of 2018 and 2022, which saw panic selling by retail investors and widespread miner shutdowns. This time, we see persistent ETF net inflows, rising long-term holder positions, and leading miners optimizing their balance sheets rather than cutting production. These signals collectively point to the assessment that the current environment is more likely a "deep correction within a bull market" rather than the beginning of a bear market signaling the "end of the bull run."
Looking at historical halving cycle patterns, Bitcoin completed its fourth halving in April 2024 (block reward reduced from 6.25 BTC to 3.125 BTC). Historical data shows that the 12 to 18 months following a halving are typically the most intense period for price discovery. After the 2012 halving, BTC broke its prior all-time high approximately 12 months later; after the 2016 halving, the major bull run began about 17 months later; and after the 2020 halving, the cycle peak occurred roughly 12 months later. Using this historical pattern as a reference, the 12–18 month window after the April 2024 halving corresponds to the period from April 2026 to October 2026—precisely the current time frame. This suggests that the current price correction could very well be part of the "shakeout and accumulation phase" following the halving, rather than a cyclical top reversal. Of course, the validity of this historical pattern under the new environment of deepening institutionalization remains highly uncertain.
From a technical perspective, the core trading range for Bitcoin after "returning to $80,000" is $76,000 to $83,000. The $80,000 level itself is a significant psychological threshold and short-term support. The $83,000 level corresponds to the 200-day simple moving average, a critical "bull-bear frontier" contested by both sides. A decisive daily close above this level would open the path towards the $89,000–$94,000 target range. Below, $76,000 acted as a support level tested multiple times in April 2026. A breakdown below this could see technical downside targets in the $70,000–$65,000 range. Looking at momentum indicators, the 7-day RSI has risen to 71.27, nearing overbought territory, suggesting a short-term technical pullback risk is present. However, the MACD formed a bullish crossover in mid-April, providing some momentum support for a medium-term upward move. Synthesizing the technical signals, the most reasonable assessment at this juncture is that BTC is in a "confirmation phase following its return to $80,000." Range-bound consolidation could persist for another 2 to 4 weeks until a clear macro catalyst emerges.
5. Outlook: Three-Scenario Projections and Key Observation Points
Synthesizing the three main themes of geopolitics, the Fed policy path, and institutional capital flows, the crypto market from May to July 2026 may evolve along the following three scenarios.
Scenario 1 (Approx. 35% Probability): Geopolitical Détente + Fed Dovish Signals, BTC Challenges $89,000–$94,000. If the U.S. and Iran reach a substantive framework agreement within the negotiation window following the suspension of the "Freedom Plan," the Strait of Hormuz returns to normal transit, oil prices retreat from highs, and inflation expectations cool. Simultaneously, Warsh releases dovish signals in his first public speech after taking office on May 15. The simultaneous improvement of both macro themes would trigger a "double boost" effect: risk appetite sharply recovers, ETF inflows accelerate, and BTC could break above $83,000 (the 200-day MA) within 2–4 weeks, launching towards the $89,000–$94,000 range. Key observation points for this scenario include: Warsh's inaugural speech around May 15, the April U.S. nonfarm payrolls report released on May 8, and interim announcements from U.S.-Iran negotiations.
Scenario 2 (Approx. 45% Probability): Geopolitical Stalemate Continues + Fed Maintains Wait-and-See Approach, BTC Oscillates in $70,000–$85,000 Range. This is the most fully priced neutral scenario currently. The U.S. and Iran fail to reach a comprehensive agreement within the 4-week ceasefire period, but no new large-scale military conflict erupts; the Strait of Hormuz remains in a "semi-blockade" state. The Fed, under Warsh, maintains its "data-dependent" stance. In this scenario, BTC is most likely to maintain a wide-ranging consolidation pattern. ETF capital flows will be the most direct short-term price driver—if weekly net inflows remain above $300 million, prices will tend towards the upper boundary; if a week of net outflows occurs, prices will test the lower boundary support. In this scenario, range-bound trading is the most suitable strategy for most investors.
Scenario 3 (Approx. 20% Probability): Geopolitical Conflict Escalates + Inflation Spirals Out of Control, BTC Retreats to $65,000–$70,000 Range. If the ceasefire agreement collapses completely, Iran announces a full blockade of the Strait of Hormuz, oil prices break above $120 per barrel, forcing Goldman Sachs to further revise up its year-end PCE forecast; and Fed hawks publicly discuss the possibility of raising rates if necessary to combat inflation. This macro "perfect storm" would simultaneously hit liquidity expectations and risk appetite, potentially causing BTC to break below the $70,000 psychological support level. While relatively low probability, if it occurs, leveraged positions in the crypto market would face systemic liquidation pressure. Under this scenario, cash and short-term Treasuries are the optimal holdings, and Bitcoin positions should only be reconsidered after a clear macro inflection point is confirmed.
6. Conclusion: Identifying Structural Signals Amidst the Macro Fog
The crypto market in May 2026 stands at a historic confluence of three major themes: geopolitics, monetary policy, and institutionalization. The dramatic reversal of the "Freedom Plan," the policy uncertainty surrounding the Fed Chair transition, the verification period for the post-halving cycle pattern, and the structural change of persistent contrarian accumulation via ETFs all combine to form an exceptionally complex and rich macro chessboard. For investors, the key to navigating this phase lies in distinguishing "noise" from "signals": the back-and-forth of geopolitical events and the hawkish-dovish squabbles among Fed officials are, in essence, short-term noise. They influence prices on an intraday to weekly basis but cannot alter the medium-term trend direction pointed to by the structural signals of deepening institutionalization and post-halving supply contraction.
Macro headwinds are often the best friend of long-term allocators. The macro pressures Bitcoin is experiencing in May 2026—rising oil prices, an uncertain Fed stance, ongoing geopolitical conflict—are actually quite mild compared to the "liquidity crisis" of March 2020 or the "FTX collapse + aggressive Fed rate hikes" darkest moment of 2022. Meanwhile, the ongoing rise in institutional holdings, the continuous expansion of the ETF product lineup, and the ability of leading miners to optimize their capital structures during a downturn all quietly tell a larger narrative: Bitcoin is gradually evolving from a fringe speculative asset into a permanent member of the global asset allocation landscape. This process is full of volatility, but the direction is clear. We recommend focusing on three key variables: First, Warsh's inaugural speech around May 15 will determine the repricing direction for rate cut expectations. Second, substantive progress in U.S.-Iran ceasefire talks within the 4-week window will define the evolution path for oil prices and inflation expectations. Third, if U.S. spot BTC ETF weekly flows show net inflows exceeding $500 million for two consecutive weeks, it will be the most direct signal of accelerating institutional accumulation. The macro fog will eventually lift, and investors who maintain their composure within it, identifying the structural signals, will be the most composed winners of the next market cycle.


