


Microsoft FY2027 Q1 Earnings Preview: Can Azure Growth Keep Pace with Surging AI Capex?


- Core View: The real focus of Microsoft's FY2027 Q1 earnings (to be released after the close on October 28) is not Azure growth—management's 45% guidance, Bernstein's 45.6% forecast, and the 44.9% consensus have already converged closely—but the cost side: the midpoint of FY2027 capex guidance is approximately $257.5 billion, equivalent to 77.6% of trailing revenue, and management has already signaled margin contraction. The incremental information from this quarter centers on depreciation, free cash flow, and the magnitude of margin contraction.
- Key Elements:
- Fiscal quarter definition: FY2027 Q1 covers July to September 2026. Microsoft's fiscal year ends on June 30, so misreading it as calendar year 2027 would misalign all time-based judgments.
- Demand side already locked in: Commercial remaining performance obligations rose 84% year-over-year last quarter to $678 billion, roughly twice trailing revenue of $331.84 billion; Azure grew 43% last quarter, with annualized revenue exceeding $100 billion for the first time.
- Market consensus: Revenue of $90.62 billion (up 16.7% year-over-year), earnings per share of $4.71 (up 14.0% year-over-year); Microsoft has beaten EPS consensus in each of the past eight quarters.
- Three capex measures: approximately $175 billion for calendar year 2026, approximately $190 billion for FY2026, and FY2027 guidance of $255 billion to $260 billion. The differences stem from fiscal year ranges, whether finance leases are included, and the reclassification of leases as operating leases.
- Margin mechanism: cash capex hits free cash flow, depreciation is spread into the income statement over subsequent years, and revenue is recognized when delivered. These three occur on different timelines, so 17% revenue growth and margin decline can appear simultaneously.
- Monetization metrics: Paid Microsoft 365 Copilot seats rose from about 20 million to more than 30 million, and GitHub Copilot reached 50 million; but seats do not equal revenue contribution, and conversion rates must be inferred indirectly.
- Four return-side checks: cash capex for the quarter, additions to finance leases, year-over-year change in depreciation and amortization, and free cash flow; the direction of depreciation is the best indicator of future margin pressure.
Overview
Microsoft will report its fiscal 2027 first-quarter results after the U.S. market closes on October 28. According to the company's official announcement, the earnings call webcast will begin at 14:30 Pacific Time, which is 17:30 Eastern Time and 05:30 Singapore Time on October 29.
We first need to clarify the fiscal quarter convention, as this is where mistakes are most likely. Microsoft's fiscal 2027 first quarter covers the three months from July to September 2026, not any period in calendar year 2027. The company's fiscal year ends on June 30, so FY2027 Q1 is the company's current most recent quarter.
The real question for this earnings report is not whether Azure can grow, but whether growth can cover investment. The demand-side evidence is already quite sufficient: last quarter Azure grew 43%, annualized revenue exceeded $100 billion for the first time, and commercial remaining performance obligations grew 84% year-over-year to $678 billion, roughly twice its trailing revenue. The scale on the investment side is equally striking: based on the midpoint of FY2027 guidance, capital expenditures are equivalent to approximately 77.6% of current trailing revenue.
Management has already provided half the answer. On last quarter's earnings call, the company guided to 45% Azure growth for this quarter and double-digit growth in full-year revenue and operating income, while explicitly stating that FY2027 margins will contract. In other words, the company itself has signaled the combination of "high revenue growth alongside declining margins," and what this earnings report needs to verify is the specific magnitude of that combination.

Key Points
Timing and fiscal quarter. Release after the U.S. market closes on October 28; earnings call at 14:30 Pacific Time, which is 05:30 Singapore Time on October 29; FY2027 Q1 covers July to September 2026.
Market consensus. According to MarketBeat, revenue is expected at $90.62 billion, up 16.7% year-over-year, and earnings per share is expected at $4.71, up 14.0% year-over-year.
The Azure bar is 45%. This is the guidance management gave for this quarter on last quarter's call, while the market consensus at the time was approximately 41%.
Demand is already locked in. Last quarter commercial remaining performance obligations grew 84% year-over-year to $678 billion, roughly twice trailing revenue of $331.84 billion.
Margin contraction has already been signaled. Management explicitly stated that FY2027 margins will contract, so the margin decline itself is not a surprise—the magnitude is.
Capex has three conventions. Calendar year 2026 approximately $175 billion, FY2026 approximately $190 billion, FY2027 guidance of $255 billion to $260 billion, and some lease accounting treatment has been reclassified from capital expenditures to operating leases.
Fiscal Quarter, Release Timing, and Convention Notes
Clarifying timing and fiscal quarter is the prerequisite for avoiding the most common errors.
Regarding the release schedule, the company will publish results on its investor relations website after the U.S. market closes on Wednesday, October 28, 2026, with the earnings call webcast beginning at 14:30 Pacific Time. Converted to other time zones: 17:30 Eastern Time on October 28, 21:30 UTC on October 28, and 05:30 Singapore Time on October 29.
Regarding the fiscal quarter convention, Microsoft's fiscal year ends on June 30 each year, so fiscal 2027 begins on July 1, 2026. The FY2027 first quarter being reported corresponds to July through September 2026. Understanding FY2027 as calendar year 2027 would cause all timing judgments to be misaligned, and this type of error is quite common with companies on cross-fiscal-year conventions.
The prior quarter's base needs to be established first, as all comparisons this quarter start from it. FY2026 fourth quarter revenue was $90.01 billion, up 18% year-over-year, beating the $87.62 billion market consensus by $2.42 billion; according to MarketBeat records, earnings per share for the quarter was $4.74, above the $4.24 consensus, while Metir AI's compilation gives earnings per share of $4.81, with GAAP net income of $35.8 billion, up 31% year-over-year—the two EPS figures use different conventions and sources should be noted when citing. At the segment level, Intelligent Cloud revenue was $39.31 billion, up 32%, and Productivity and Business Processes revenue was $37.85 billion, up 14%.
The market reaction is also part of the backdrop. After that earnings report, the stock rose approximately 15%, adding roughly $450 billion in market capitalization, the largest single-day gain on record, after the stock had fallen 19% year-to-date beforehand. As of October 22, the stock closed at $521.08, down 2.23% on the day, with a market capitalization of approximately $3.87 trillion, a trailing P/E of 29.03x, a forward P/E of 26.37x, and a 52-week range of $349.20 to $553.72. For pre-earnings sector sentiment, see our analysis on QQQ declines and AI spending concerns.
Azure: Look at Reported Growth, But Also at Capacity Explanations
Azure is the first item to watch in this earnings report, but it needs to be understood in layers.
On growth, management guided to 45% growth for this quarter on last quarter's earnings call, while the market consensus at the time was approximately 41%, so 45% is the company's self-set bar rather than an external expectation. Last quarter's actual growth was 43%, above the guidance at the time. Bernstein's October 19 forecast was 45.6% Azure growth for this quarter, slightly above the 44.9% consensus it cited.
The constant-currency figure needs to be checked separately. The company typically discloses both reported growth and constant-currency growth, with the difference reflecting currency effects. In public reporting, both this quarter's guidance and last quarter's actual have been presented on a reported basis; the constant-currency figures need to be verified in the formal earnings report, and this difference can reach several percentage points during periods of dollar volatility.
The capacity explanation is the most easily overlooked but most informative part. According to Metir AI's compilation, management attributed last quarter's Azure acceleration in part to efficiency gains in CPU and GPU clusters and faster onboarding of new capacity; in several prior quarters, Azure's AI growth had been described as capacity-constrained, and the easing of capacity constraints converted latent demand into recognized revenue.
This attribution is critical for judging sustainability. If growth comes from capacity release, then the ceiling on growth depends on the pace of capacity delivery rather than demand intensity; once capacity supply catches up, growth will be closer to the true demand level. Therefore, the statements in this earnings report about capacity status—whether it is still described as constrained and to what extent constraints have eased—determine the credibility of next quarter's guidance.
Demand-side evidence comes from backlog. Last quarter commercial remaining performance obligations grew 84% year-over-year to $678 billion, while the company's trailing revenue was $331.84 billion, with the former roughly twice the latter. Remaining performance obligations measure amounts contracted but not yet recognized as revenue, so it is a direct indicator of how locked-in demand is, but it does not indicate over what timeframe these revenues will be recognized, nor the margins at recognition.
Behind capacity there is also a longer-term constraint, namely power and infrastructure. For related long-term power supply arrangements, see our previous report on Microsoft's long-term power agreement with NiSource. The significance of such agreements is that they anchor the capacity expansion timeline to a multi-year scale, which is not synchronized with the rhythm of quarterly earnings.
AI Investment: Three Effects of Cash Capex, Finance Leases, and Depreciation
This section is the part that most needs to be explained precisely, because the same investment appears completely differently in three financial statement locations.
There are three layers of mechanistic difference. Cash capital expenditures affect the cash flow statement—they directly reduce free cash flow in the period paid but do not directly affect the income statement. Finance leases and operating leases are accounted for differently: the former is typically recorded as assets and liabilities and generates depreciation and interest, while the latter is expensed over the usage period, so the same capacity commitment will present as different line items under different lease forms. Depreciation affects the income statement—it amortizes capital expenditures already incurred as expenses over subsequent years, so the current period's margin pressure comes from investment in prior quarters, not current-period investment.
This time lag determines an important conclusion: a company can simultaneously show high revenue growth and declining margins in the same quarter, and the two are not contradictory. Revenue reflects services delivered in the current period, while margins reflect depreciation on past investment beginning to be recognized. Management's explicit statement that FY2027 margins will contract is a direct expression of this mechanism.
The convention issue is particularly prominent for Microsoft, with at least three different capex figures appearing in public reporting. According to TradingKey's compilation, calendar year 2026 capex is maintained at approximately $175 billion, not raised, and CFO Amy Hood explained that the accounting treatment for some data center and office leases has been reclassified from capital expenditures to operating leases. According to Metir AI's compilation, FY2026 capex was approximately $190 billion, while FY2027 guidance is $255 billion to $260 billion, roughly 35% higher.
The three figures are not contradictory; the differences come from three conventions: different fiscal year versus calendar year periods; whether finance leases are included; and after some leases are reclassified as operating leases, reported capex declines while actual commitments have not decreased. Therefore, when citing any figure, the convention must be stated simultaneously, otherwise completely different conclusions will be drawn.
To establish a sense of magnitude, an editorial calculation can be made: based on the FY2027 guidance midpoint of approximately $257.5 billion, capex is equivalent to approximately 77.6% of current trailing revenue of $331.84 billion. This ratio shows that investment intensity is no longer a marginal adjustment but a magnitude that reshapes the cash flow structure.
Therefore, on the investment side, this earnings report needs to verify four items: current-quarter cash capital expenditures; new amounts related to finance leases; year-over-year changes in depreciation and amortization; and free cash flow. Among these, the direction of depreciation change best foreshadows margin pressure in coming quarters, while free cash flow shows the extent to which investment is being absorbed by operating cash flow.
Monetization: Copilot, Cloud Margins, and Free Cash Flow
For investment to translate into returns, it needs to be verified through monetization metrics, and the evidence on this front is currently uneven in strength.
There are clear figures for Copilot. Last quarter Microsoft 365 Copilot paid seats grew from approximately 20 million to more than 30 million, and GitHub Copilot reached 50 million users. Bernstein expects Copilot paid seats to remain above 30 million this quarter. Seat count is direct evidence of adoption, but it does not equal revenue contribution, because per-seat pricing and discount arrangements are not publicly disclosed, so the conversion rate between seat growth and revenue growth needs to be inferred indirectly from segment revenue.
On cloud revenue structure, last quarter Microsoft Cloud revenue was $59.3 billion, up 27%, and Intelligent Cloud segment revenue was $39.31 billion, up 32%. Bernstein expects Microsoft 365 commercial cloud growth of 18% this quarter, accelerating to 20% next quarter, with its core thesis being that both Azure and Office lines accelerate simultaneously, and that easing capacity constraints will bring synchronized growth, which the firm describes as a valuation re-rating opportunity.
Margins are the real test point. Management has guided to FY2027 margin contraction, so what needs to be verified is not the direction but the magnitude, and which segment the contraction primarily occurs in. If contraction is concentrated in Intelligent Cloud and synchronized with depreciation growth, it indicates this is a normal result of the investment cycle; if contraction spreads to the Productivity and Business Processes segment, other causes need to be sought.
Free cash flow is the most comprehensive indicator. At a stage where capex reaches a magnitude of over 70% of revenue, the direction of free cash flow determines whether the company can support investment with internal cash or needs to rely on debt or lease financing. This forms a contrast with several companies we have previously analyzed: when capex exceeds operating cash flow, the gap must be filled by financing, and the choice of financing form in turn affects reporting conventions.
Watch Table: Guidance and Sourced Expectations
Placing management guidance alongside sourced analyst expectations allows actual values to be filled in directly after the earnings release.
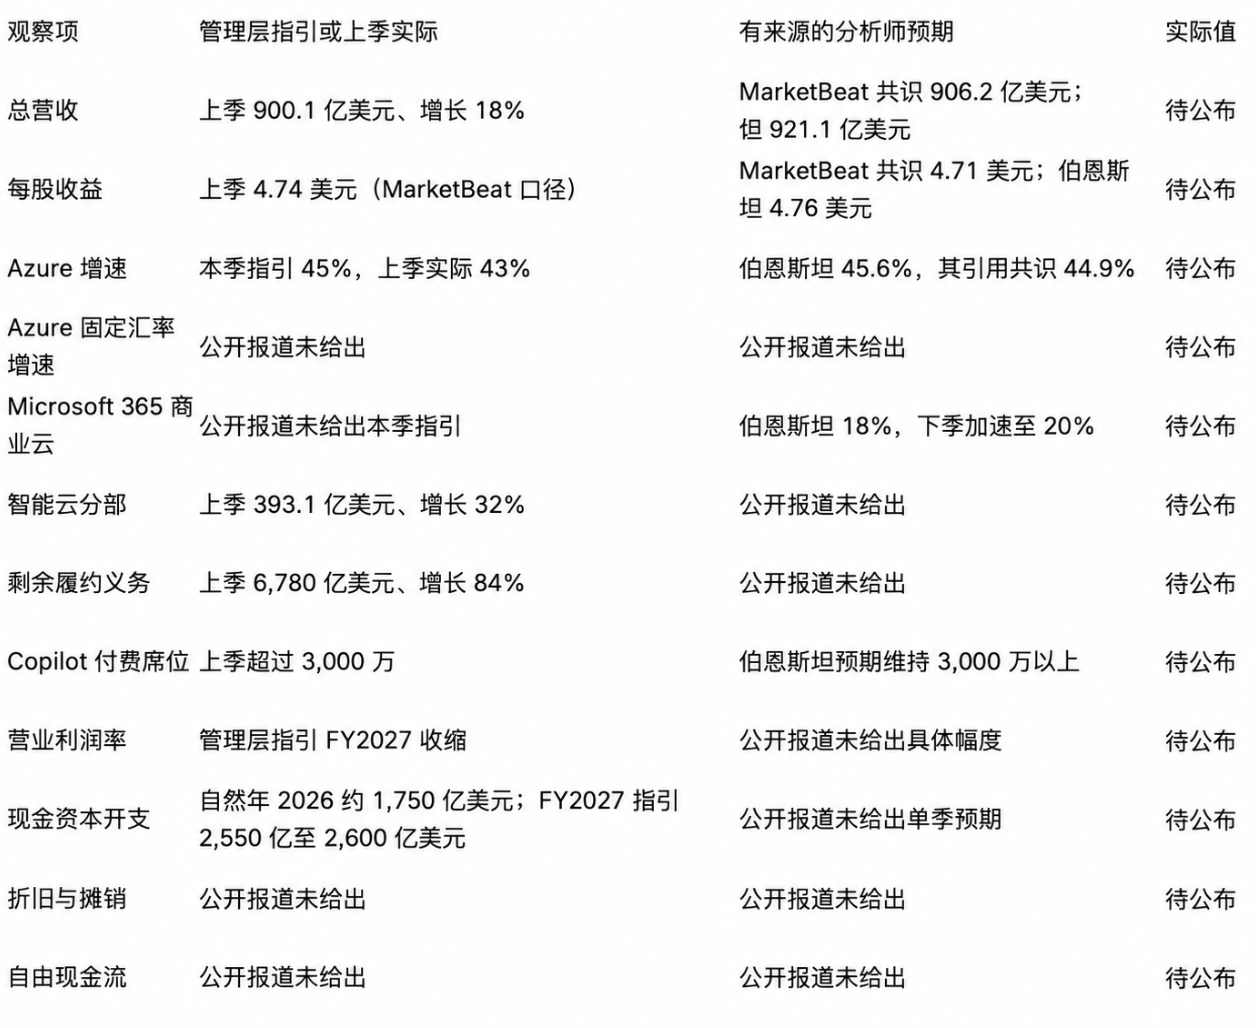
Items in the table marked as not provided in public reporting indicate that there is currently no citable source, and benchmarks should not be set arbitrarily. Bernstein's price target is $662, raised from $660, with an Outperform rating, citing a stock price of $529.05, corresponding to approximately 25% upside. It should also be noted that Microsoft has beaten EPS consensus eight times in the past eight quarters.
View MSFT stock perpetual contract quotes and contract rules on MEXC here. It should be noted that stock perpetual contracts are derivatives and differ from buying Microsoft common stock.
James Mitchell's Exclusive View
In James Mitchell's view, the focus of this earnings report is no longer on Azure's growth figure. Management itself set the bar at 45%, Bernstein forecasts 45.6%, and consensus is approximately 44.9%—the three figures are highly convergent, indicating that growth itself is already close to a certainty within the consensus range. What truly lacks consensus is the cost side: based on the FY2027 guidance midpoint, capex is equivalent to approximately 77.6% of current trailing revenue, and management has explicitly signaled margin contraction. Therefore, the incremental information this quarter is concentrated in depreciation and free cash flow, not in Azure's percentage.
The convention issue is what I think readers most need to learn. The same company's capex has appeared as three figures in public reporting: calendar year 2026 approximately $175 billion, FY2026 approximately $190 billion, and FY2027 guidance of $255 billion to $260 billion. They are not contradictory; the differences come from different fiscal year versus calendar year periods, whether finance leases are included, and the reclassification of some leases from capital expenditures to operating leases mentioned by the CFO. The last item deserves particular attention: reclassification lowers reported capex but does not lower actual capacity commitments, so judging that investment is slowing based solely on a decline in the capex figure is a conclusion that will be misled by accounting treatment.
From a mechanistic perspective, the time lag between revenue and costs determines the earnings characteristics of such companies. Cash capital expenditures hit free cash flow in the period paid, depreciation is amortized into the income statement over subsequent years, and revenue is recognized when services are delivered. The three have different rhythms, so a single quarter can absolutely show all three phenomena simultaneously—revenue growth of 17%, declining margins, and pressure on free cash flow—and this does not mean operational deterioration. Understanding this prevents misreading normal characteristics of an investment cycle as a deterioration in fundamentals.
I think the demand side is underestimated. Commercial remaining performance obligations grew 84% year-over-year to $678 billion, roughly twice trailing revenue—this is a fairly hard indicator because it represents contracted amounts rather than forecasts. But it has two unknowns: over what timeframe these revenues will be recognized, and at what margin they will be recognized. The second unknown is the key, because if the pricing structure of large long-term contracts results in margins below historical levels, then scale growth and profit growth will persistently diverge. If this earnings report can provide the maturity distribution of remaining performance obligations, its information value would be higher than single-quarter revenue.
For investors, the pragmatic approach is to split this earnings report into two independent judgments. The first judgment is demand, based on Azure growth, remaining performance obligations, and Copilot seats—the evidence on this side is currently sufficient. The second judgment is returns, based on depreciation growth, the magnitude of operating margin contraction, and the direction of free cash flow—this side currently lacks public expectations and is therefore the main source of volatility. At a forward P/E of 26.37x and a market capitalization of $3.87 trillion, the market is pricing the second judgment, not the first.
Frequently Asked Questions
When will Microsoft report earnings?
The company will release its fiscal 2027 first-quarter results on its investor relations website after the U.S. market closes on Wednesday, October 28, 2026, with the earnings call webcast beginning at 14:30 Pacific Time. Converted to other time zones: 17:30 Eastern Time on October 28, 21:30 UTC, and 05:30 Singapore Time on





