BTC Poised for a Rebound, HYPE at the $75.1 Watershed | Special Analysis


- Core View: Bitcoin's September 21 staged high of $87,399 has been confirmed on the weekly chart. The current daily Wave ⅰ correction low of $79,775 has entered the target zone and a 4-hour bottom divergence has appeared. This week, watch whether the correction can end and a Wave ⅱ rebound begin.
- Key Elements:
- BTC's rally from $57,820 in July to $87,399 in September is characterized as an oversold bounce, not the start of a bull market.
- Last week's low of $79,775 broke below the prior low of $80,400. The four-week candlestick structure forms a strong top fractal, confirming the weekly top.
- Wave ⅰ has run for 27 trading days with a maximum decline of 8.72%, and the low has entered the $78,000–$80,500 target zone.
- The 4-hour chart's momentum model and price-spread model simultaneously confirm bottom divergence; chasing the decline is not advisable.
- HYPE touched a low of $76.07, entering the projected $75–$77 zone, with divergence appearing in the 4-hour downtrend.
- HYPE's key watershed is $75.10: holding it may mean the correction is nearing an end, while losing it would escalate to a weekly-level correction.
- The mid-term strategy is to stay in cash and observe; for short-term trades, use 30% of position to trade the spread between support and resistance zones with strict stop-losses.
Last week, Bitcoin continued to face downward pressure, hitting an intraday low of $79,775, breaking below the previous week's low of $80,400. The weekly top is essentially confirmed.
Looking back, this rally began on July 1. The price rebounded from a low of $57,820 all the way to $87,399 on September 21. We have consistently characterized this move as an oversold rebound rather than the start of a bull market. After peaking on September 21, the market entered a correction that has now run for 27 trading days, with a maximum drawdown of 8.72%. Last week's low landed right within our previously projected target zone of $78,000–$80,500. On the 4-hour chart, both models also showed bottom divergence simultaneously. So the focus this week is: can a bottom be confirmed near $79,775, thereby opening up room for a Wave ii rebound?
HYPE also weakened last week. After breaking below the short-term ascending channel, the price fell steadily, touching a low of $76.07, which landed exactly within our projected $75–$77 range. This correction began at the September 23 high of $97.98, and the 4-hour downtrend has now shown divergence, with downward momentum clearly fading. The key level to watch this week is $75.10: if it holds, the correction will likely come to an end; if it breaks, the correction could escalate to a weekly-level adjustment.
Summary of Core Views for This Week's Trading:
• Bitcoin daily-level trend structure analysis (see Part One for details)
• Bitcoin hourly-level trend structure analysis (see Part Two for details)
• Bitcoin this week's market forecast and medium/short-term trading strategies (see Part Three for details)
• HYPE hourly-level trend structure analysis (see Part Four for details)
• HYPE this week's market forecast and short-term trading strategies (see Part Five for details)
I. Bitcoin Daily-Level Trend Structure Analysis
In the previous weekly review, using our proprietary "52-week moving average confirmation method" combined with the Elliott Wave theory framework, we analyzed the current trend nature of the BTC market from multiple dimensions, as well as the possibility of the price forming a阶段性 high on September 21, and made projections about the trend structure after the high was formed.
This week, we will continue within the Elliott Wave framework to further assess future market movements.
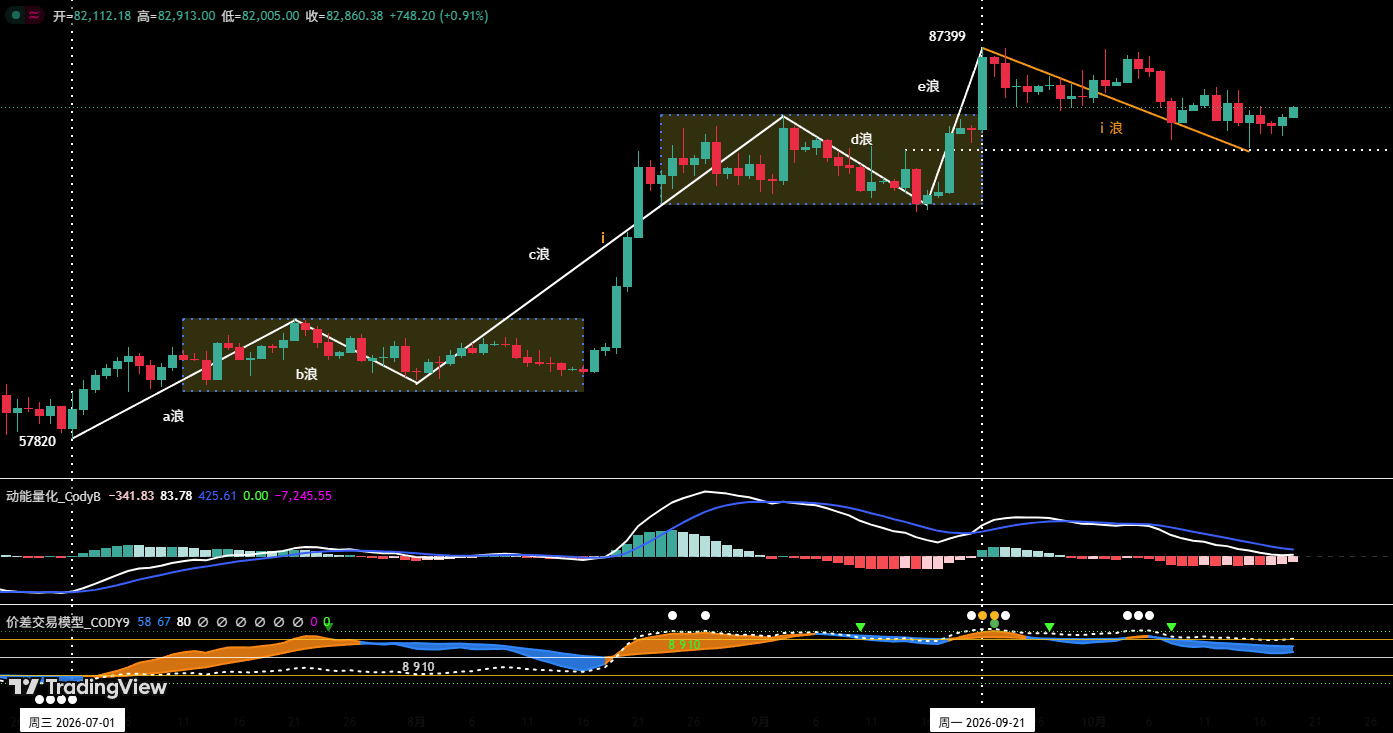
Figure 1: Bitcoin Daily Candlestick Chart
1. Review of Previous Weekly Assessment
The previous weekly review made three progressive judgments about the nature of the BTC market trend and the daily trend structure from both the daily and weekly dimensions:
①. The current rebound that began from the July 1 low of $57,820 should still be defined as an oversold rebound and is not yet sufficient to confirm a bull market.
②. Daily five-wave termination: The five-wave rebound that began from the July 1 low terminated at the September 21阶段性 high of $87,399.
③. Weekly top confirmation: If the intraweek low of the previous weekly candle broke below the prior week's low of $80,400, the weekly top pattern would be essentially established, confirming from the larger cycle that September 21 was the阶段性 high.
④. Daily three-wave correction: If the aforementioned阶段性 high holds, the daily-level correction that began from that point will most likely unfold in a three-wave structure.
2. Weekly Top Confirmed as Expected
The confirmation condition set in the previous weekly review has been triggered: based on actual price action, last week's low of $79,775 has broken below the prior week's low of $80,400, and the recent four weekly candles form a "strong top fractal." The weekly top pattern is essentially established, and the September 21阶段性 high has been confirmed on the weekly level.
3. Current Trend Structure Analysis (Figure 1)
①. Wave i (corrective wave): September 21 to present
• Starting point: $87,399
• 27 trading days elapsed (still ongoing)
• Maximum drawdown within the range: 8.72%
②. The current low of $79,775 has entered the $78,000–$80,500 target zone, and the probability that the Wave i correction ends here is extremely high.
③. After Wave i ends, a Wave ii rebound is expected to unfold.
II. Bitcoin Hourly-Level Trend Structure Analysis
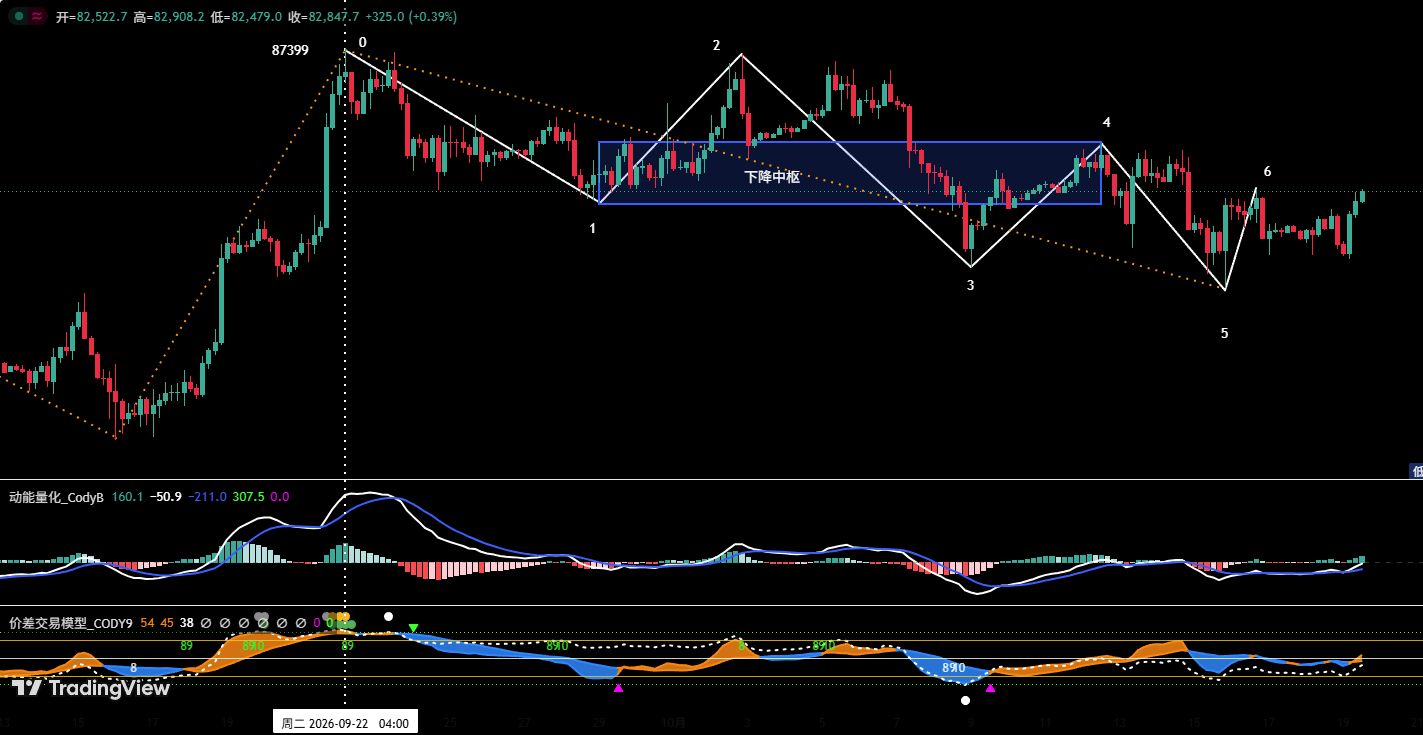
Figure 2: Bitcoin 4-Hour Candlestick Chart
1. As shown in Figure 2: We introduce the Chan Theory framework as a cross-validation perspective outside the Elliott Wave framework, analyzing the BTC trend structure in detail on the 4-hour timeframe:
①. 4-hour decomposition of the daily Wave i:
The daily Wave i correction that began from the September 21 high of $87,399 (Endpoint 0) can be clearly divided on the 4-hour chart into six segments from (0-1) to (5-6).
②. Construction of a descending pivot:
Among them, segments (1-2), (2-3), and (3-4) overlap with each other, forming a descending pivot.
③. Trend projection:
The market is currently in the (5-6) rebound segment. If, after it terminates, the subsequent pullback does not break below Endpoint 5, the probability that the daily Wave i correction terminates at Endpoint 5 (around $79,775) is significant. Otherwise, the market may continue to probe lower, with key focus on support near $78,000.
2. Analysis using our proprietary model system (Figure 2):
①. The "Momentum Quantification Model" shows that the comparison between Endpoint 3 and Endpoint 5 has formed a bottom divergence; the model's two signal lines are intertwined and are about to cross above near the zero axis. If they successfully rise above the zero axis, the 4-hour level enters a strong zone.
②. The "Spread Trading Model" triggered a bottom warning signal near Endpoint 3;
③. The two independent models, comparing Endpoint 3 and Endpoint 5, simultaneously confirm bottom divergence, constituting cross-validation.
3. In summary, the trend structure analysis and the dual-model divergence signals mutually validate each other. The probability that the price terminates the daily Wave i correction near Endpoint 5 (around $79,775) is extremely high, and it is not advisable to chase the decline at this time.
III. Bitcoin This Week's Market Forecast and Trading Strategies
1. BTC This Week's Market Forecast
Core view for this week: Focus on the termination point of the daily Wave i correction and the subsequent Wave ii rebound.
2. Core Resistance Levels
• First resistance zone: around $84,500–$85,500 (previous important level)
• Second resistance zone: $87,500–$90,000 area (previous important level)
3. Core Support Levels
• First support: $78,000–$80,500 area (previous important support level)
• Second support: $74,500–$76,000 area (previous important support level)
• Third support: $69,100–$70,500 area (previous important support level)
4. This Week's Trading Strategies (Excluding the Impact of Breaking News)
①. Medium-term strategy:
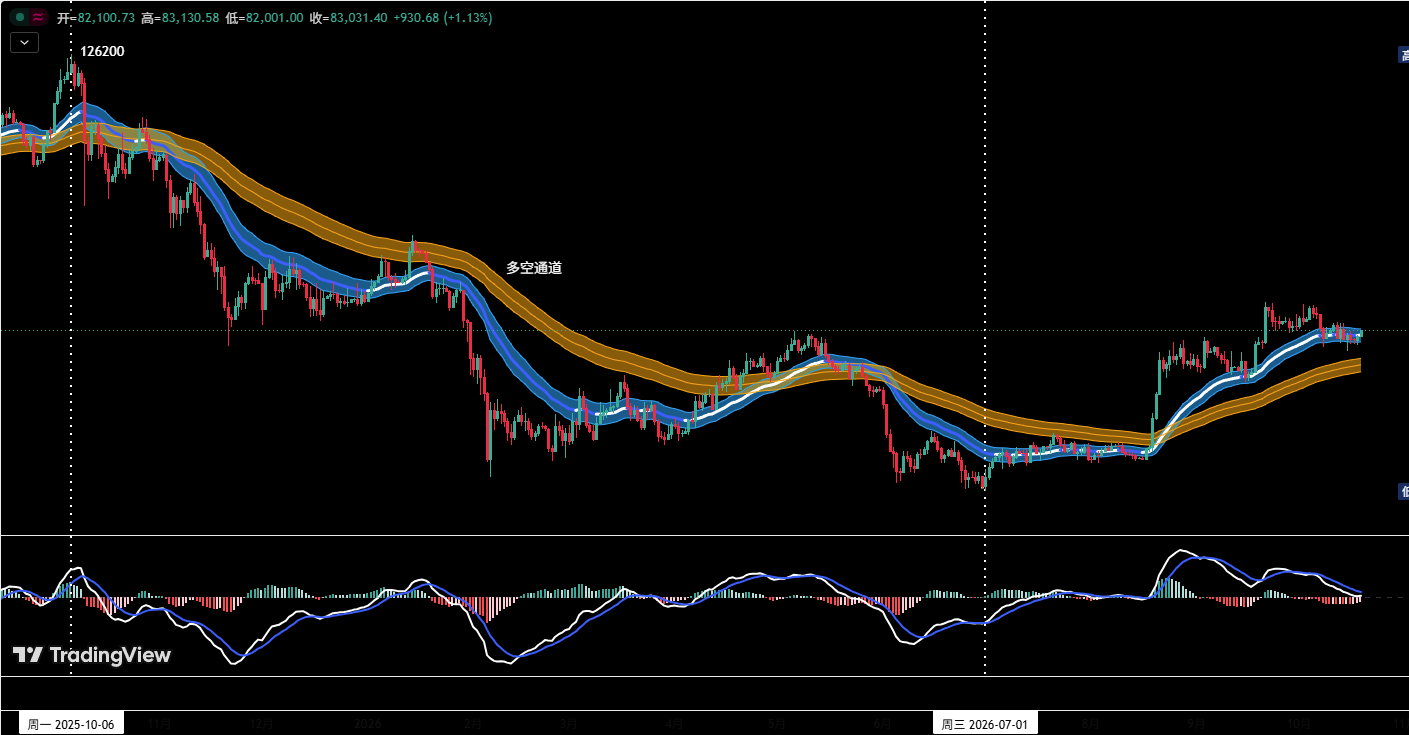
Figure 3: Bitcoin Daily Candlestick Chart: (Position Monitoring Model)
Position Monitoring Model: As shown in Figure 3, the price has broken out of the "long-short channel"; it is currently in the pullback confirmation phase. Therefore, the current medium-term strategy is to stay in cash and observe.
②. Short-term strategy: Use 30% of position, set stop-loss levels, and look for "spread" opportunities based on support and resistance levels. (Use 30-minute/60-minute as the operating timeframe).
③. In short-term operations, to dynamically adapt to complex market developments, we have prepared A/B contingency plans in advance.
• Plan A: Light long position in strong support zone.
• Entry: If this week the price corrects to the $78,000–$80,500 area and shows a clear stabilization pattern, with quantitative models simultaneously issuing bottom signals, a light long position may be established, with position size controlled within 30%.
• Risk control: Set an initial stop-loss level.
• Exit: When the price rebounds to near important resistance levels and combined with model signals, positions may be closed in batches to take profits.
• Plan B: Light short position at strong resistance.
• Entry: If the price rises to the aforementioned resistance areas and shows a clear pattern of pressure and pullback, with quantitative models simultaneously issuing top signals, a light short position may be established, with position size controlled within 30%.
• Risk control: Set an initial stop-loss level.
• Exit: When the price corrects to near important support levels and combined with model signals, positions may be closed in batches to take profits.
IV. HYPE Hourly-Level Trend Structure Analysis
The previous weekly review clearly stated: HYPE was at that time in the pullback confirmation phase after breaking below the lower rail of the short-term ascending channel. If the breakdown was confirmed as valid, the correction would persist last week, with a downside target in the $75–$77 area. Based on actual price action, after the valid breakdown was confirmed, the price correction landed precisely within that target zone, touching a low of $76.07. The actual price action last week was highly consistent with the forecast.
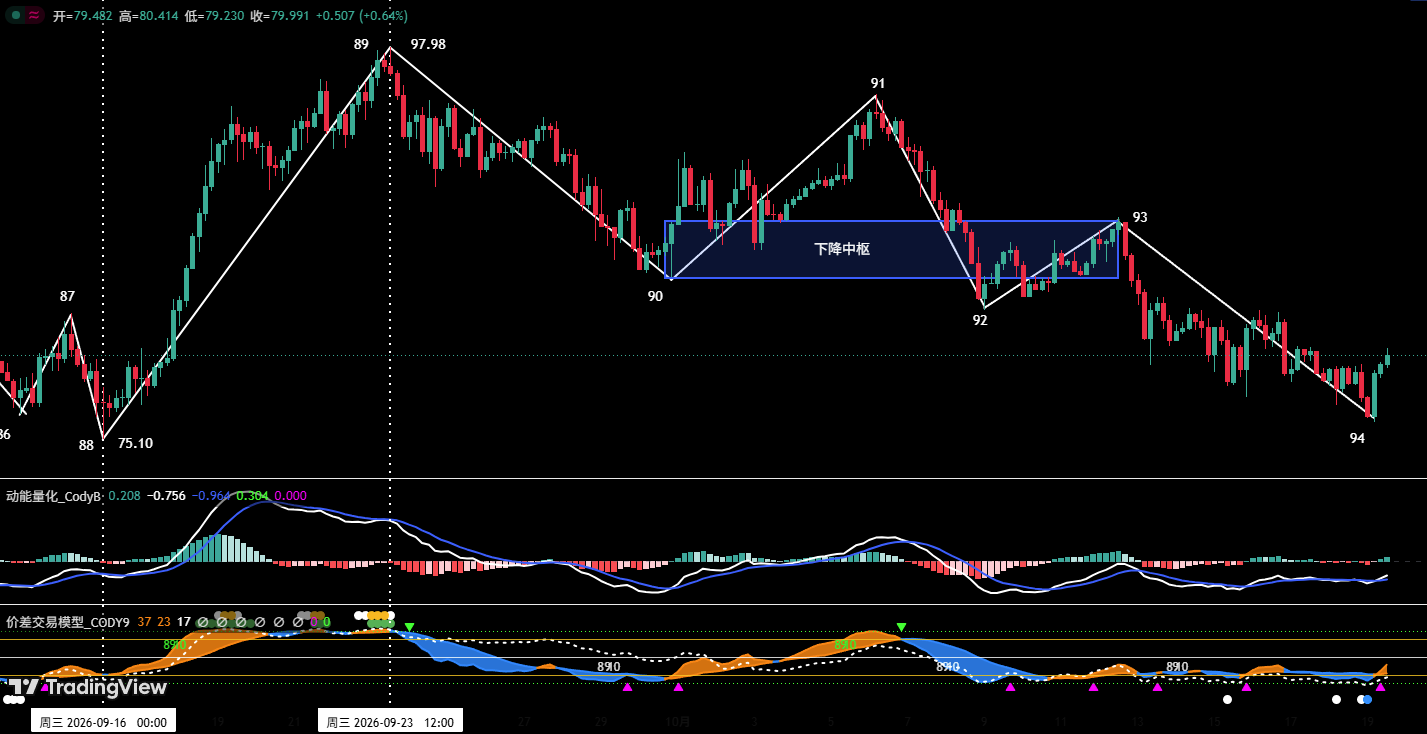
Figure 4: HYPE 4-Hour Candlestick Chart
1. Decomposition of the Daily Correction on the 4-Hour Level
As shown in Figure 4: The daily correction that began from HYPE's September 23 high of $97.98 can be decomposed on the 4-hour framework into a five-segment downtrend structure from (89-90) to (93-94).
2. Construction of a Descending Pivot
①. Based on the overlap of the three segments (90-91), (91-92), and (92-93), a descending pivot is formed.
②. Among them, (89-90) is the pivot entry segment and (93-94) is the pivot exit segment.
3. Pivot-Based Trend Structure Assessment (Base Case)
The market is currently in the pivot exit segment (93-94). Through comparison of downward momentum, this segment shows a clear momentum divergence relationship with the entry segment (89-90) (divergence means declining downward momentum). Therefore, after this segment terminates, a rebound segment is expected to unfold; if the subsequent pullback cannot break below Endpoint 94, the probability that the daily correction that began from $97.98 terminates at Endpoint 94 is extremely high.
4. Risk Scenario if Price Breaks Below the September 15 Low (Extremely Weak Scenario)
If the daily correction that began on September 23 breaks below the September 15 low of $75.10, this correction may escalate to the weekly level. Not only would the correction duration be further extended, but it could also test the support of the long-term ascending trendline.
V. HYPE This Week's Market Forecast and Short-Term Trading Strategies
1. HYPE This Week's Market Forecast
①. Core Resistance Levels:
• First resistance: $80–$82 area
• Second resistance: $88–$90 area
• Third resistance: near $95–$100
②. Core Support Levels:
• First support: $75–$77 area (strong support)
• Second support: $68–$70 area
③. Core View for This Week:
The first support ($75–$77 area) is the long-short dividing line; this week's focus is on observing the outcome of the long-short battle in this area.
2. HYPE This Week's Short-Term Trading Strategies
①. Light long on stabilization (without breaking strong support):
If the price stabilizes above $75.10 and continues to rise, those in cash may consider a light long position, with position size controlled within 30%, targeting the first resistance zone of $80–$82, and set a stop-loss, to be strictly executed.
②. Stay on the sidelines on breakdown:
If the price breaks below the $75.10 support level, the strong support is lost, and it is recommended to stay in cash temporarily and wait for a clear direction before acting.
VI. Special Notes
1. When opening a position: Set an initial stop-loss immediately.
2. When profit reaches 1%: Move the stop-loss to the entry cost price (break-even point) to ensure capital safety.
3. When profit reaches 2%: Move the stop-loss to the 1% profit level.
4. Continuous trailing: Thereafter, for every additional 1% profit, move the stop-loss by 1% accordingly, dynamically protecting and locking in gains.
Financial markets are constantly changing, and all market analyses and trading strategies require dynamic adjustment. All views, analytical models, and trading strategies in this article are derived from personal technical analysis and are solely for the purpose of personal trading logs; they do not constitute any investment advice or basis for action. Markets carry risk, and investment requires caution. Please do not make decisions based on this article.