9月7日美股盘前报告:存储股最高涨11.9%,科磊(KLAC)跟着涨7.32%。周五CPI,核心守得住吗?


- Core View: On September 4, 2026, the U.S. stock market showed divergent movements amid rate hike expectations triggered by strong employment data. Capital flowed from high-valuation tech stocks to low-valuation small caps and upstream semiconductor supply chain players. KLA Corporation (KLAC) surged 7.32% driven by intra-chain capital rotation rather than any company announcement. The core market driver that day was the discount rate, not changes in corporate earnings.
- Key Factors:
- Employment data beat expectations: August non-farm payrolls added 162,000 jobs (vs. 55,000 expected), unemployment rate held steady at 4.1%, the two-year Treasury yield rose to a one-year high of 4.374%, and the probability of a September rate hike climbed to roughly 50%.
- Market divergence logic: Large-cap tech stocks came under pressure (Dow fell 0.51%), while the small-cap Russell 2000 bucked the trend with a 0.25% gain, reflecting capital rotation from longer-duration assets toward undervalued, shorter-duration targets.
- Intra-chain rotation: Upstream companies rose—KLA (KLAC) +7.32%, Micron (MU) +6.10%, Lam Research (LRCX) +5.12%—while downstream players fell, with Hewlett Packard Enterprise (HPE) down 4.48% and Synopsys (SNPS) down 5.40%. Capital shifted positions within the chain rather than buying across the board.
- KLA (KLAC) positioning contradiction: The stock scores 100 points for peer ranking but only 44 points for trend position. The share price sits in the lower half of its 52-week range ($90.67–$307.37). The gain stemmed from capital rotation within the memory sector (SK Hynix up ~7%, SanDisk up 11.9%), with flat volume indicating a repricing event rather than a high-volume breakout.
- Earnings guidance drives valuations: Lululemon (LULU) beat last quarter but cut its full-year EPS guidance, falling 17.4%; Abercrombie (ANF) raised guidance and rose 4.3%. Six apparel companies have drawn down anywhere from 3.2% to 55.5% from their highs. The market prices the future, not the past.
On Monday, September 7, U.S. markets were closed for Labor Day, with no trading or economic data released. Therefore, this article is a preview for the coming week, not a review of that evening's market action. The last trading day was Friday, September 4, when only the Russell 2000 rose 0.25% among the four major indices, while the Dow Jones Industrial Average fell 0.51%, the S&P 500 fell 0.38%, and the Nasdaq Composite fell 0.29%. The stock of the day was KLA Corporation (KLAC), which surged 7.32% to close at $185.60—despite the company releasing no corporate announcements that day. Today's Stock Market Academy makes up for the weekend lesson: on the same day, in the same apparel sector, Lululemon (LULU) dropped 17.4% while Abercrombie & Fitch (ANF) rose 4.3%—the difference wasn't in last quarter's earnings. The macro focus this week is Friday's August CPI report at 12:30 UTC. Data in this article is based on U.S. market close on September 4, 2026.
1. September 4 Close: Only Small Caps Rallied
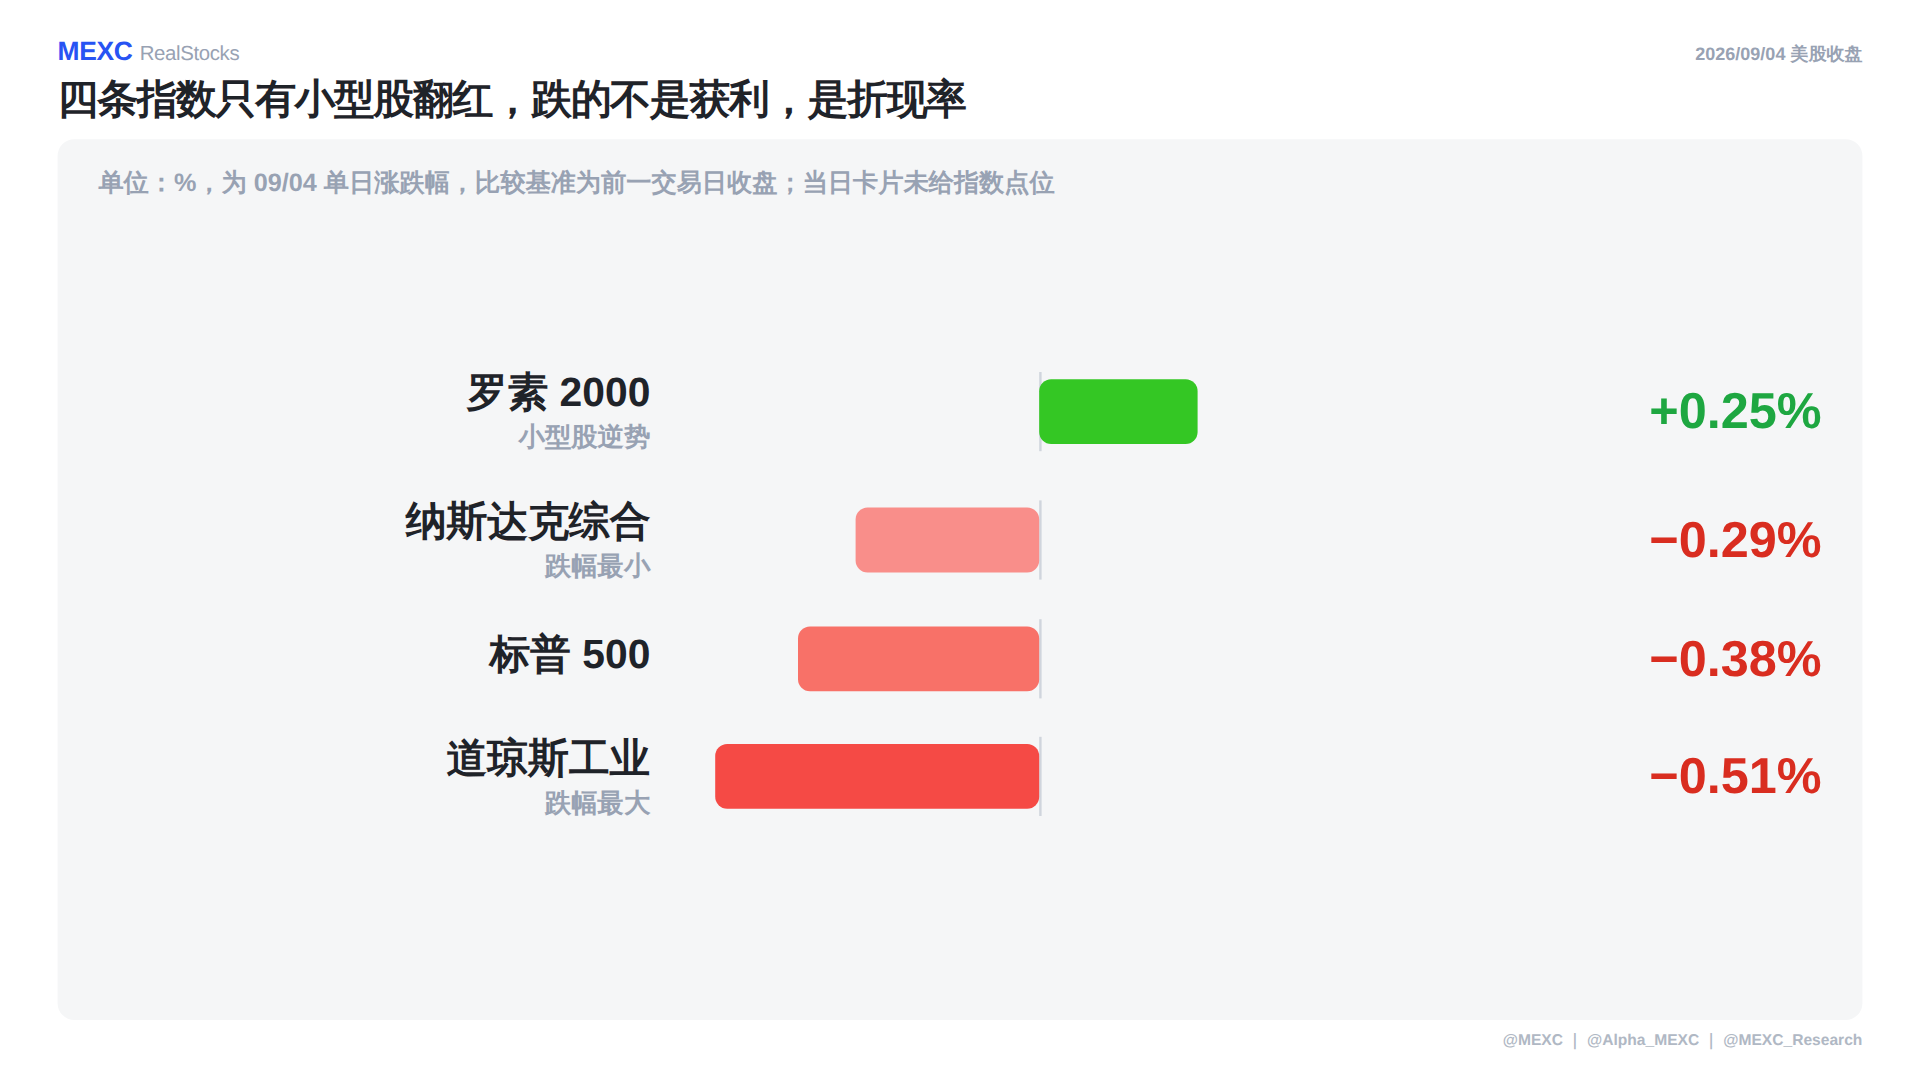
Units are in %, with daily changes relative to the prior trading day's close. Since the chart doesn't provide index point levels, this article only discusses percentage changes, not point figures. On September 4, only the Russell 2000 rose 0.25% among the four indices. The Dow Jones Industrial Average fell 0.51%, the steepest decline, while the S&P 500 fell 0.38% and the Nasdaq Composite fell 0.29%, the smallest drop.
The reason for the decline is written in the same day's employment data: August nonfarm payrolls added 162,000 jobs, far exceeding the market expectation of just 55,000, while the unemployment rate held steady at 4.1%. Strong employment is normally good news, but at this stage it means money is getting more expensive—the two-year Treasury yield climbed to 4.374% that day, a one-year high, and market pricing for a September rate hike briefly rose to around 50%. As discount rates rise, the first assets to get squeezed are those with earnings further out in the future. That's why the three indices weighted heavily toward big tech closed lower, while small caps—which already had lower valuations and shorter durations—managed to close in positive territory.
One key thing to remember: what fell that day in U.S. stocks wasn't earnings—it was the discount rate. Corporate profitability didn't deteriorate in a single day; what changed was the rate at which the market discounts future cash flows. Understanding this is the key to seeing why the biggest gainer below follows a completely different logic from the broader market.
2. Stock of the Day—KLA (KLAC): Perfect Peer Ranking, Trend Position at Only 44
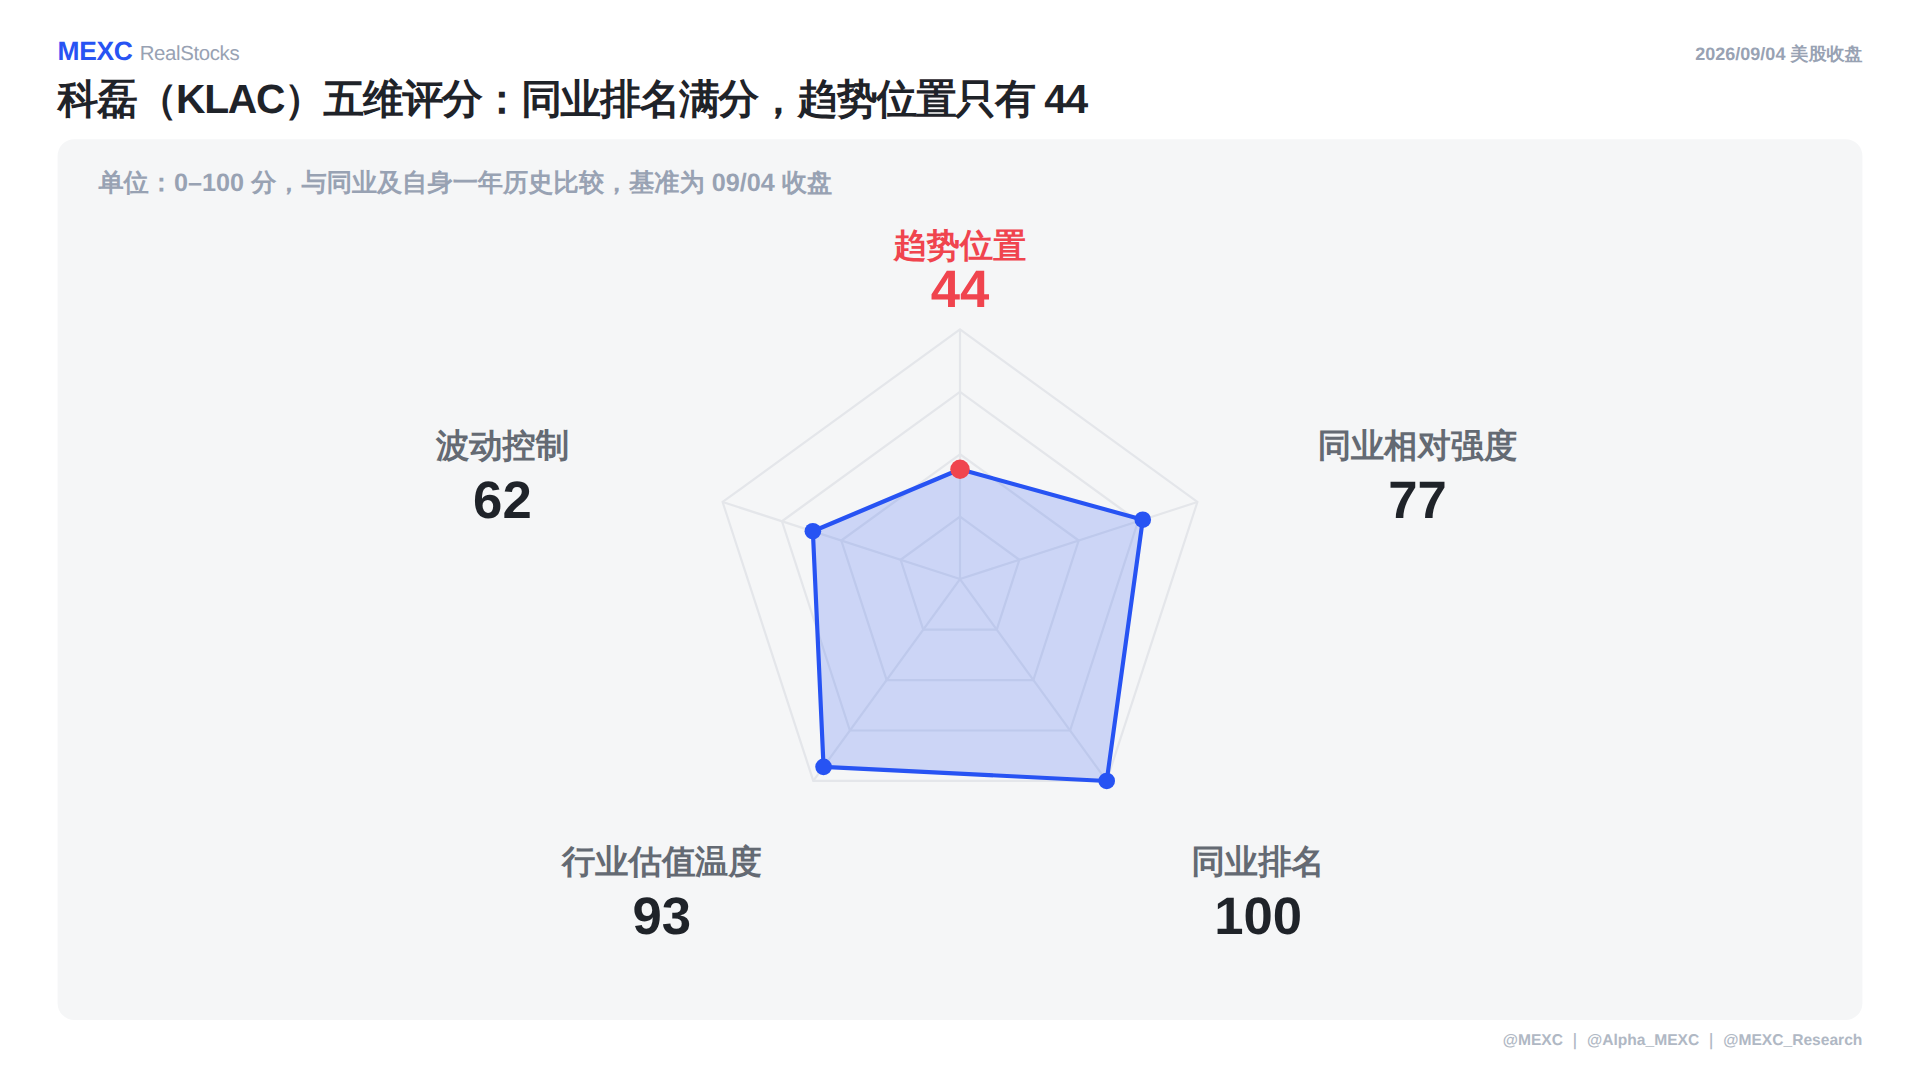
Units are scored 0–100, compared against peers and its own one-year history, based on the September 4 close. KLA (KLAC) closed at $185.60 that day, up 7.32%, adding $16.5 billion to its market cap to reach $242.4 billion. Volume matched its 30-day average, with no surge in activity. Across the five dimensions, Peer Ranking scored a perfect 100, Industry Valuation Temperature scored 93, Relative Strength vs. Peers scored 77, and Volatility Control scored 62—but Trend Position scored just 44, the weakest corner of the pentagon.
The real story is this gap. A Peer Ranking of 100 means nothing in its group was stronger that day; a Trend Position of 44 means the price remains in the lower half of its one-year range—which spans from $90.67 to $307.37, placing $185.60 at the 44th percentile. Rising the most and standing the highest measure two different things: looking only at +7.32%, you'd assume this is a strong stock; factoring in the Trend Position of 44, you realize this is a stock climbing back from lower levels.
The volume column should also be read together with the price action. Volume that day matched the 30-day average, suggesting the price move wasn't driven by a sudden influx of new capital but rather by the same money changing positions—this is repricing, not a volume-backed breakout.
Same Supply Chain: Money Moves Upstream While Downstream Gets Sold
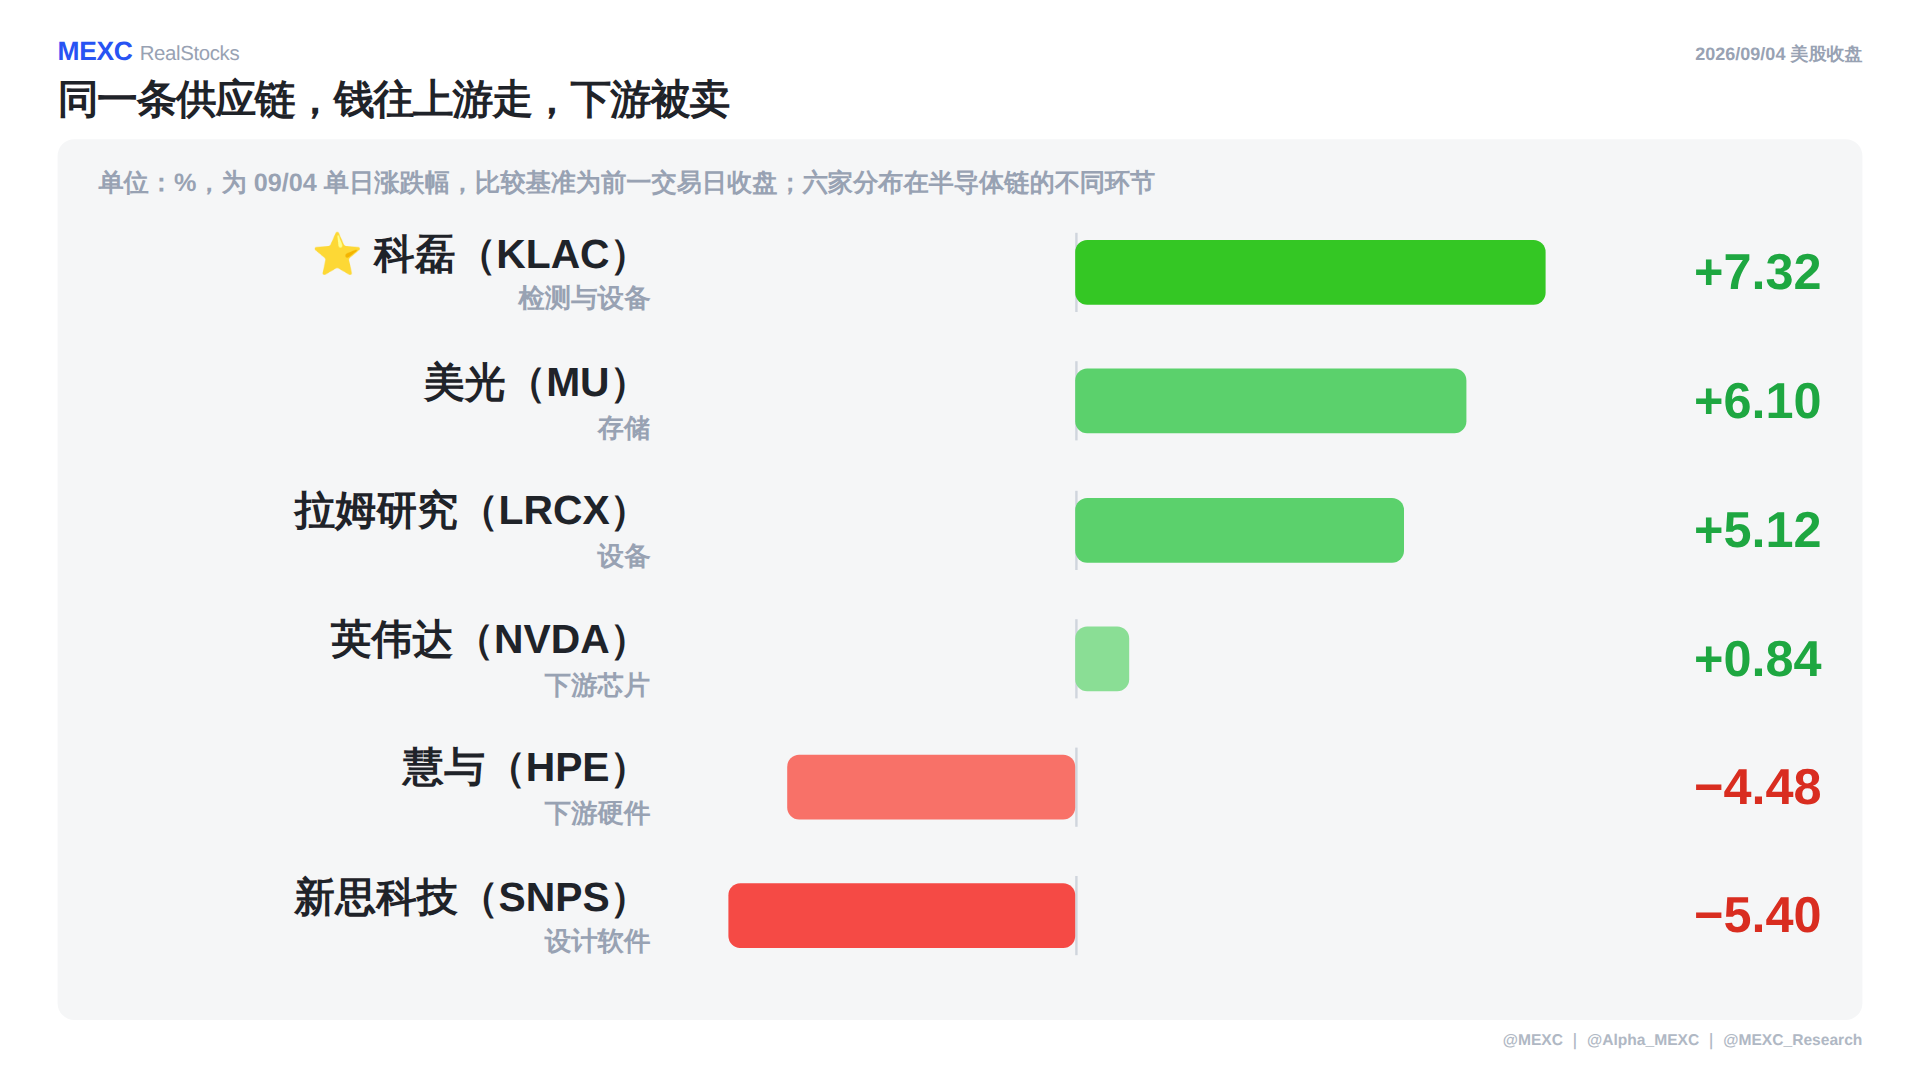
Units are in %, representing single-day percentage changes on September 4, compared against the prior trading day's close. Six companies span different segments of the semiconductor chain, ranked that day as follows: KLA (KLAC) rose 7.32%, Micron (MU) rose 6.10%, Lam Research (LRCX) rose 5.12%, Nvidia (NVDA) rose 0.84%, while Hewlett Packard Enterprise (HPE) fell 4.48% and Synopsys (SNPS) fell 5.40%.
The most important thing that day wasn't who rose the most, but where the line between gains and losses was drawn. All three gainers were upstream equipment and memory companies; the two decliners were one downstream hardware maker and one design software firm. Opposite directions within the same chain indicate this wasn't broad-based buying but rather capital rotating within the chain: money was pulled from downstream and allocated upstream.
Nvidia's (NVDA) column deserves a closer look. It rose just 0.84% that day—the smallest gain among the six advancers. Its price is already near its one-year high; at such elevated levels, upside room is naturally compressed. KLA (KLAC), by contrast, sits in the lower half of its range, so the same influx of capital produces a much larger percentage move. This is a difference in elasticity driven by positioning, not by which company is better.
3. Rising the Most ≠ Standing the Highest
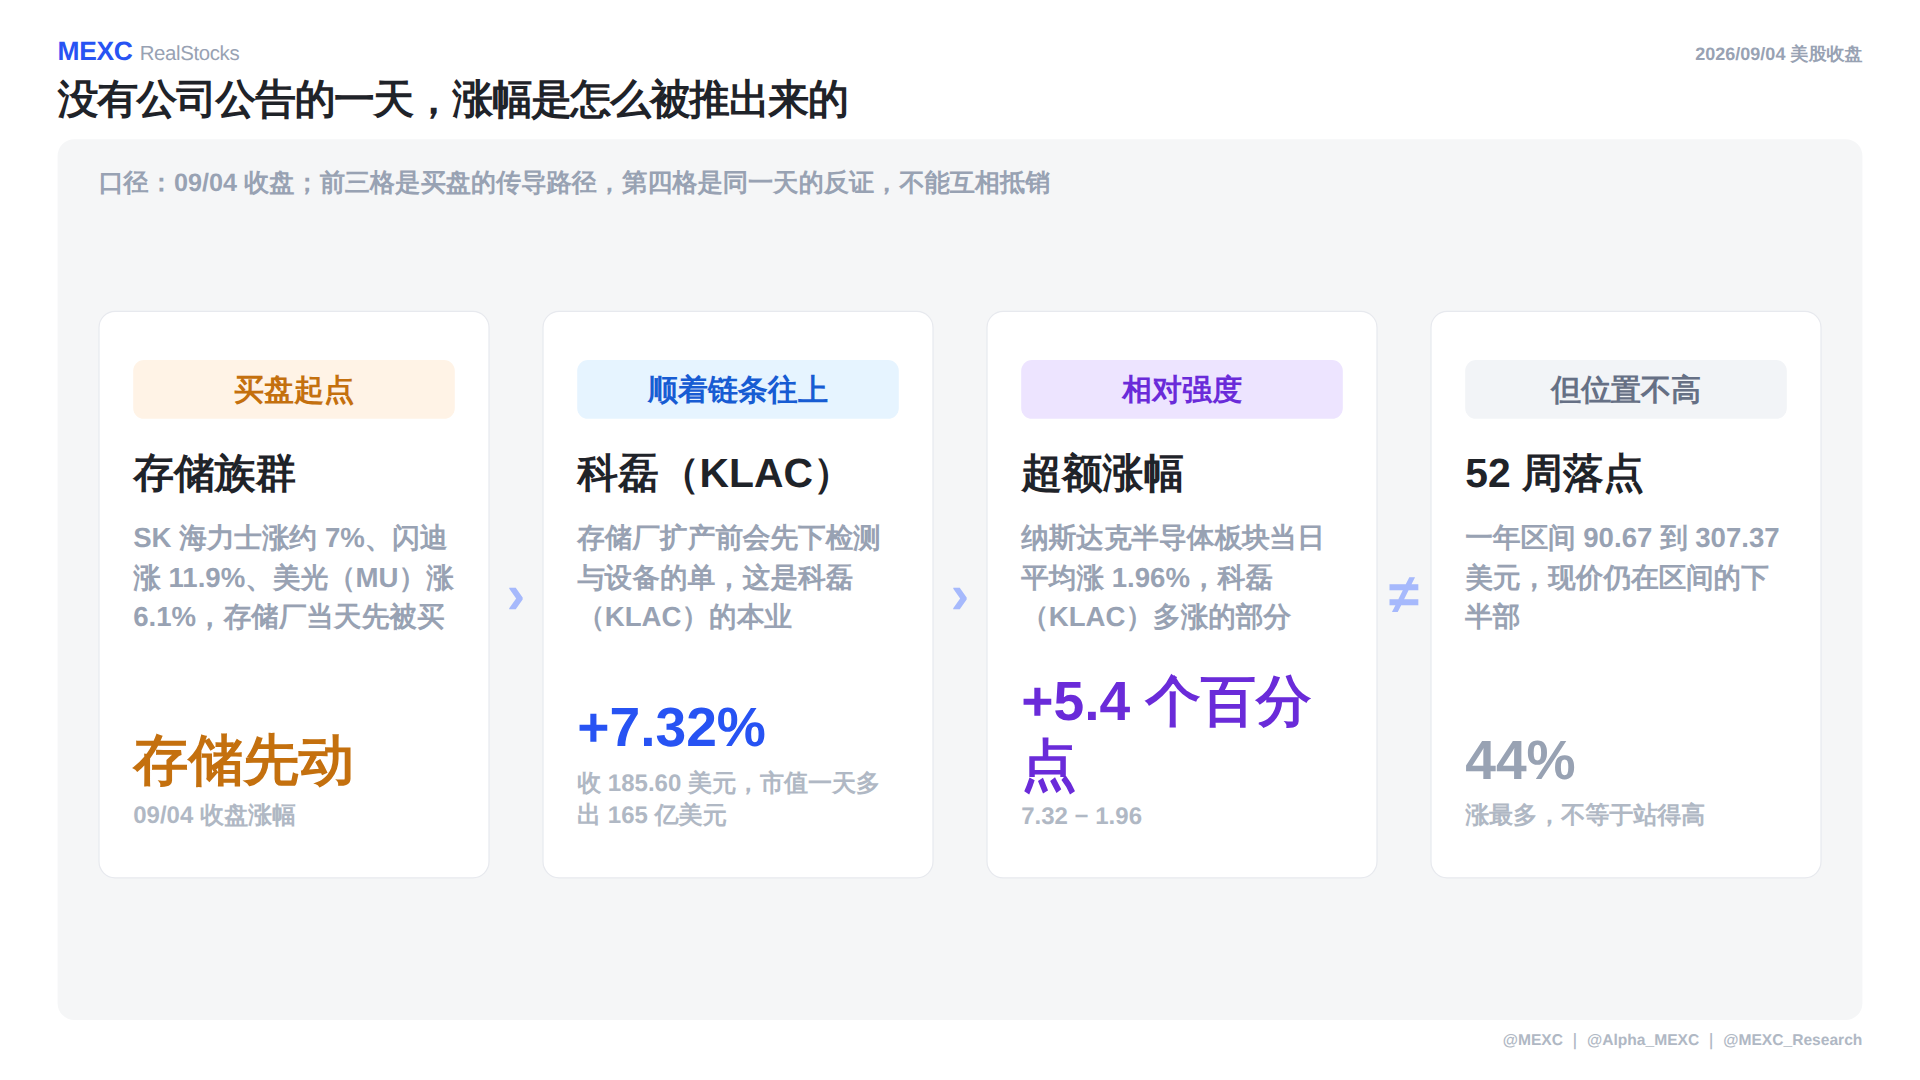
Based on the September 4 close. Breaking down that day, the gain was built in steps: First, buying pressure started in the memory segment—SK Hynix rose roughly 7%, SanDisk rose 11.9%, and Micron (MU) rose 6.1%, with memory makers getting bought first. Second, money flowed up the chain, because memory makers place orders for inspection and equipment before expanding capacity—and inspection is exactly KLA's (KLAC) core business. Third, comparing it to the sector, the Nasdaq Semiconductor Index averaged a 1.96% gain that day while KLA rose 7.32%—an outperformance of 5.4 percentage points. That gap represents KLA's own relative strength.
The fourth block is the same day's counter-evidence and cannot be offset against the first three: the 52-week position sits at just 44%. The first three blocks explain "why it rose today," while the fourth answers "where it stands after the rise"—and the answers to these two questions can be completely inconsistent.
One important clarification: KLA (KLAC) released no corporate announcements that day. The gain came from a broader rotation of capital within the equipment and memory complex, not from any company-specific news. This creates a practical difference in interpretation—when a gain is driven by a company announcement, you can read the reason the same day; when it's driven by sector-level capital rotation, the rationale won't surface until order numbers appear in the next earnings report. Until then, it's an expectation that hasn't been validated by results.
The supporting player was Constellation Energy (CEG), which rose 4.88% to close at $298.96, while the Nasdaq Independent Power Producers Index averaged a 5.09% gain that day. Its commonality with KLA (KLAC) lies in the same business model: nuclear plants sell generation capacity to data centers under long-term contracts, effectively locking in years of output in advance; memory makers placing equipment orders before capacity expansion similarly convert future capacity into today's orders. Both are cases of the market buying the same thing—a future that has been locked in ahead of time.
4. Stock Market Academy: Same Day, Same Sector, Guidance Moves in Opposite Directions

Based on earnings and full-year EPS guidance released on September 4, with percentage changes reflecting close versus the prior trading day. Lululemon (LULU) reported quarterly revenue of $2.4 billion with a 60.5% gross margin, beating earnings expectations, but same-store sales in the Americas fell 12%. The company also cut its full-year EPS guidance from $10.95–$11.15 to $9.48–$9.73. Its stock fell 17.4% that day to close at $100.61. Abercrombie & Fitch (ANF) reported quarterly revenue of $1.27 billion—a record for that period and its 15th consecutive quarter of growth—with operating margin expanding from 17.1% to 19.9%. The company raised its full-year EPS guidance from $10.20–$11.00 to $13.10–$13.60. Its stock rose 4.3% to close at $149.67.
Both companies won on last quarter, yet their stock prices diverged by 21.7 percentage points. What killed the valuation wasn't the revenue line or the gross margin line—it was the guidance line. Lululemon (LULU) cut its earnings commitment for the coming year; Abercrombie (ANF) raised the same thing. The market was repricing "how much this company can earn over the next year," not "how much it earned last quarter."
Here's why: stock prices track the future, not the quarter that just passed. Earnings in a report are historical facts—events the market has already priced in through expectations before the announcement. Guidance, however, is the company's only public statement about the future—a number signed by management. So the same earnings report can simultaneously be a win and a loss: a win for last quarter, a loss for next year, and prices follow the latter. There's only one rule: check guidance first, then earnings.
Same Sector, Drawdowns Differ by a Factor of 17
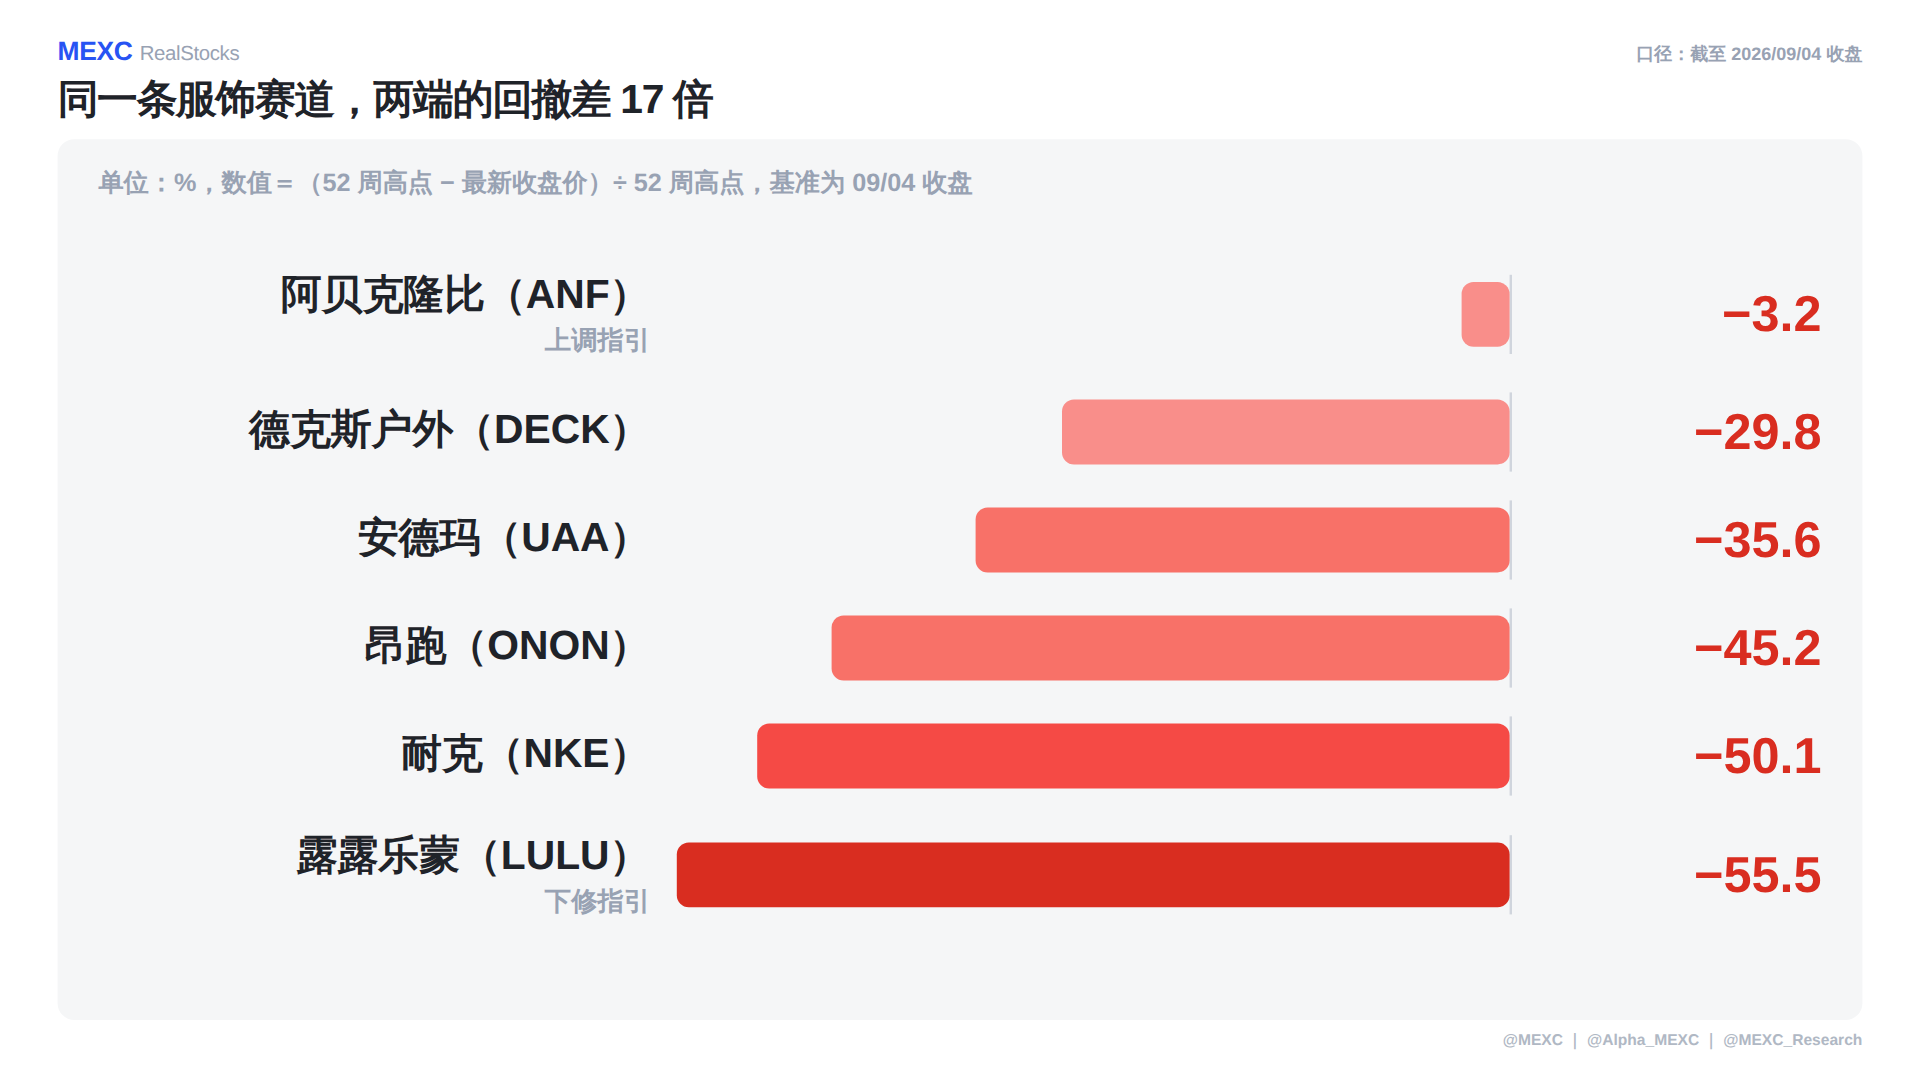
Units are in %, calculated as (52-week high − latest close) / 52-week high, based on the September 4 close. The six apparel companies ranked as follows: Abercrombie & Fitch (ANF) sits 3.2% below its high, Deckers Outdoor (DECK) is 29.8% off, Under Armour (UAA) is 35.6% off, On Holding (ONON) is 45.2% off, Nike (NKE) is 50.1% off, and Lululemon (LULU) is 55.5% off its high. The gap between the two extremes is roughly 17-fold.
Within the same sector, facing the same consumer environment, the same tariffs, and the same inventory cycle, drawdowns can still diverge this dramatically. The cycle hits everyone equally; the difference lies in whether the market still believes in the company's next chapter: the one that raised guidance sits nearly at its high, while the one that cut guidance has already lost more than half its value.
Company profile—Abercrombie & Fitch (ANF): Founded in 1892, this American apparel group operates the Abercrombie brand for adult consumers and Hollister for teenagers. Both brands share the same supply chain and store network, profiting from the speed of style refresh. Its operating margin expanded from 17.1% to 19.9% this quarter—not by selling items at higher prices, but by reducing the volume of unsold inventory.
5. What to Watch This Week: August CPI at 12:30 UTC Friday
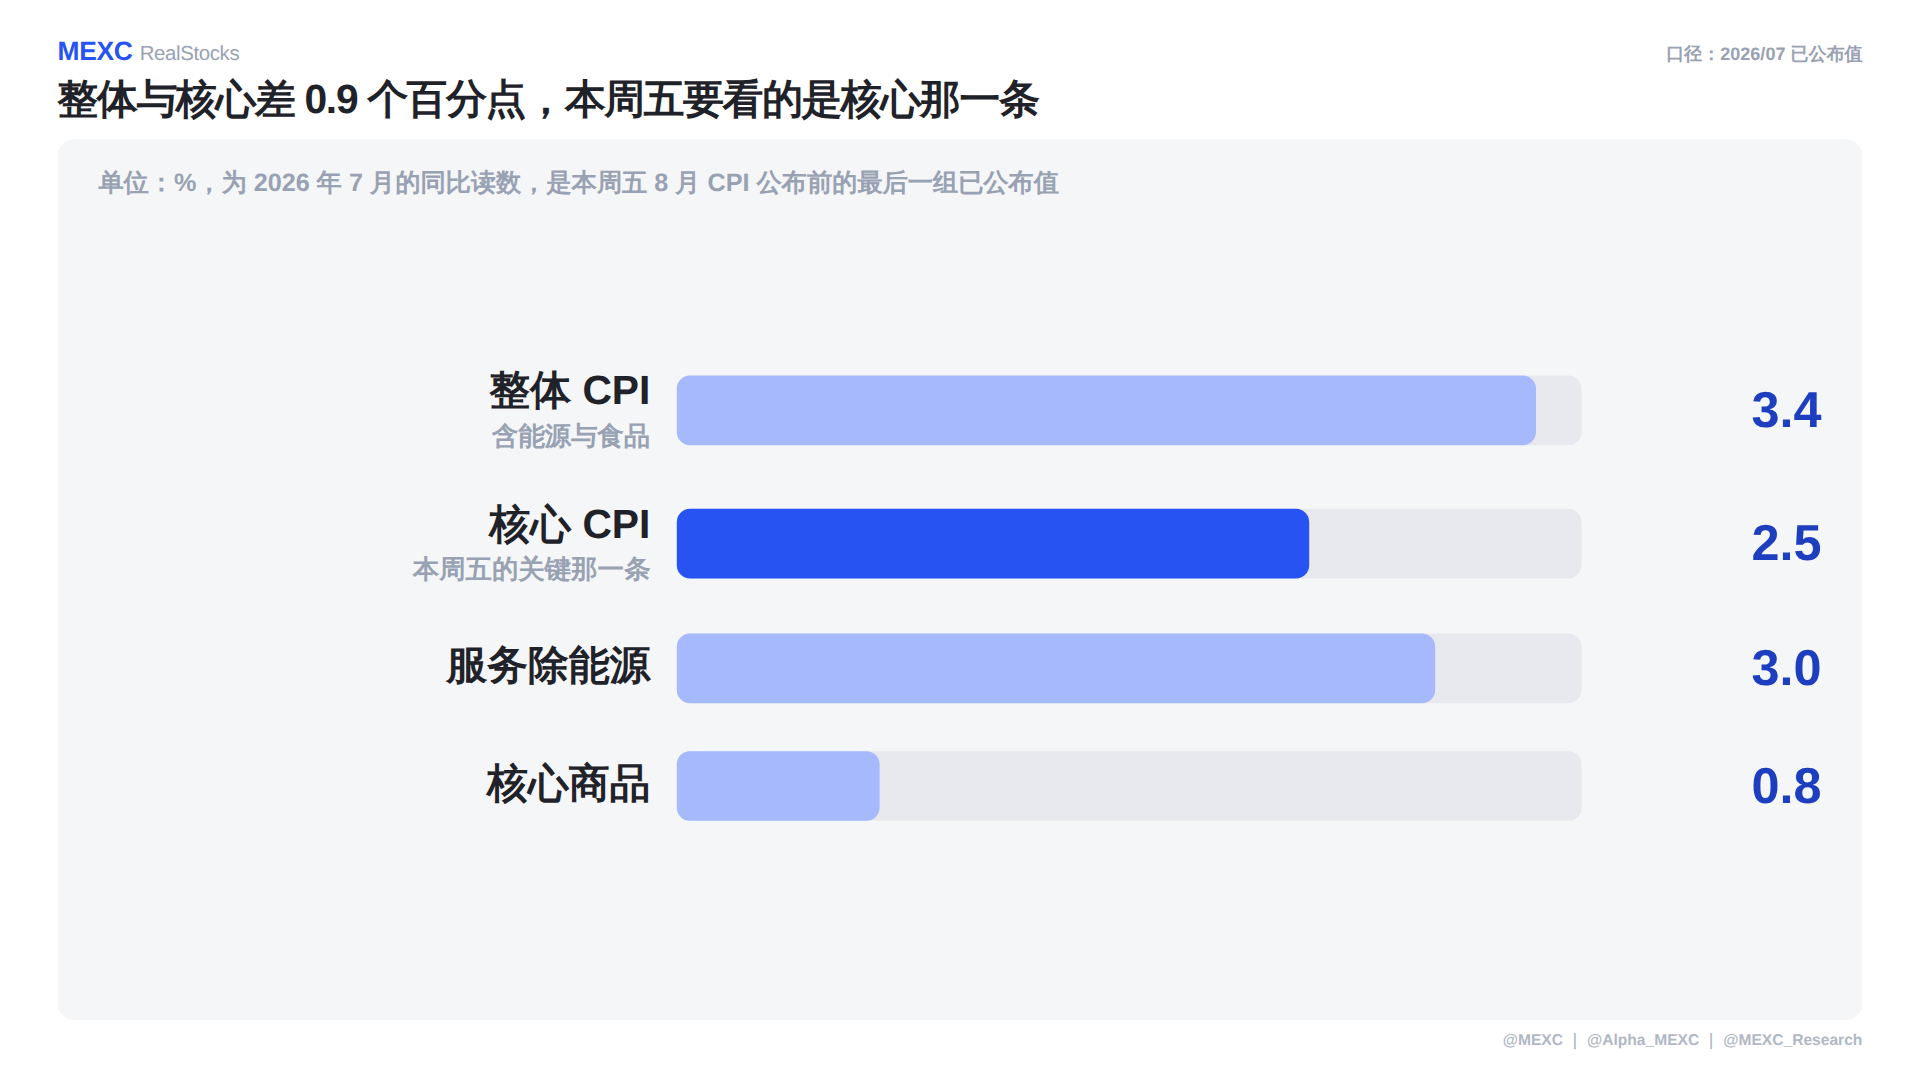
Units are in %, representing year-over-year readings for July 2026—the last published set before Friday's August CPI release. The four July metrics were: headline CPI at 3.4%, core CPI at 2.5%, services excluding energy at 3.0%, and core goods at 0.8%.
The schedule this week: Monday is closed (Labor Day); Tuesday brings the NFIB Small Business Optimism Index and consumer credit data; Wednesday has the MBA mortgage applications; Thursday at 12:30 UTC, PPI is released, with Oracle (ORCL) and Adobe (ADBE) reporting after the close; Friday at 12:30 UTC, August CPI comes out, with Kroger (KR) reporting before the open. (U.S. market hours are 13:30 UTC to 20:00 UTC, with each time shifted one hour later during standard time.)
Why Friday's release matters most: it's the final inflation print before the September 16 rate decision. Policy currently sits at 3.50%–3.75%, having remained on hold for five consecutive meetings. Inflation determines rates, and rates determine the prices of stocks and bonds—this is the upstream driver for all asset prices this week.
You should focus on core rather than headline inflation, for a specific reason: energy prices are driven by supply and geopolitics, beyond the reach of monetary policy. The gap between headline and core is 0.9 percentage points, and both the services and goods lines sit close to core—indicating that energy is propping up a significant portion of the headline number.
6. Gasoline Supports the Headline; Housing Decides the Core
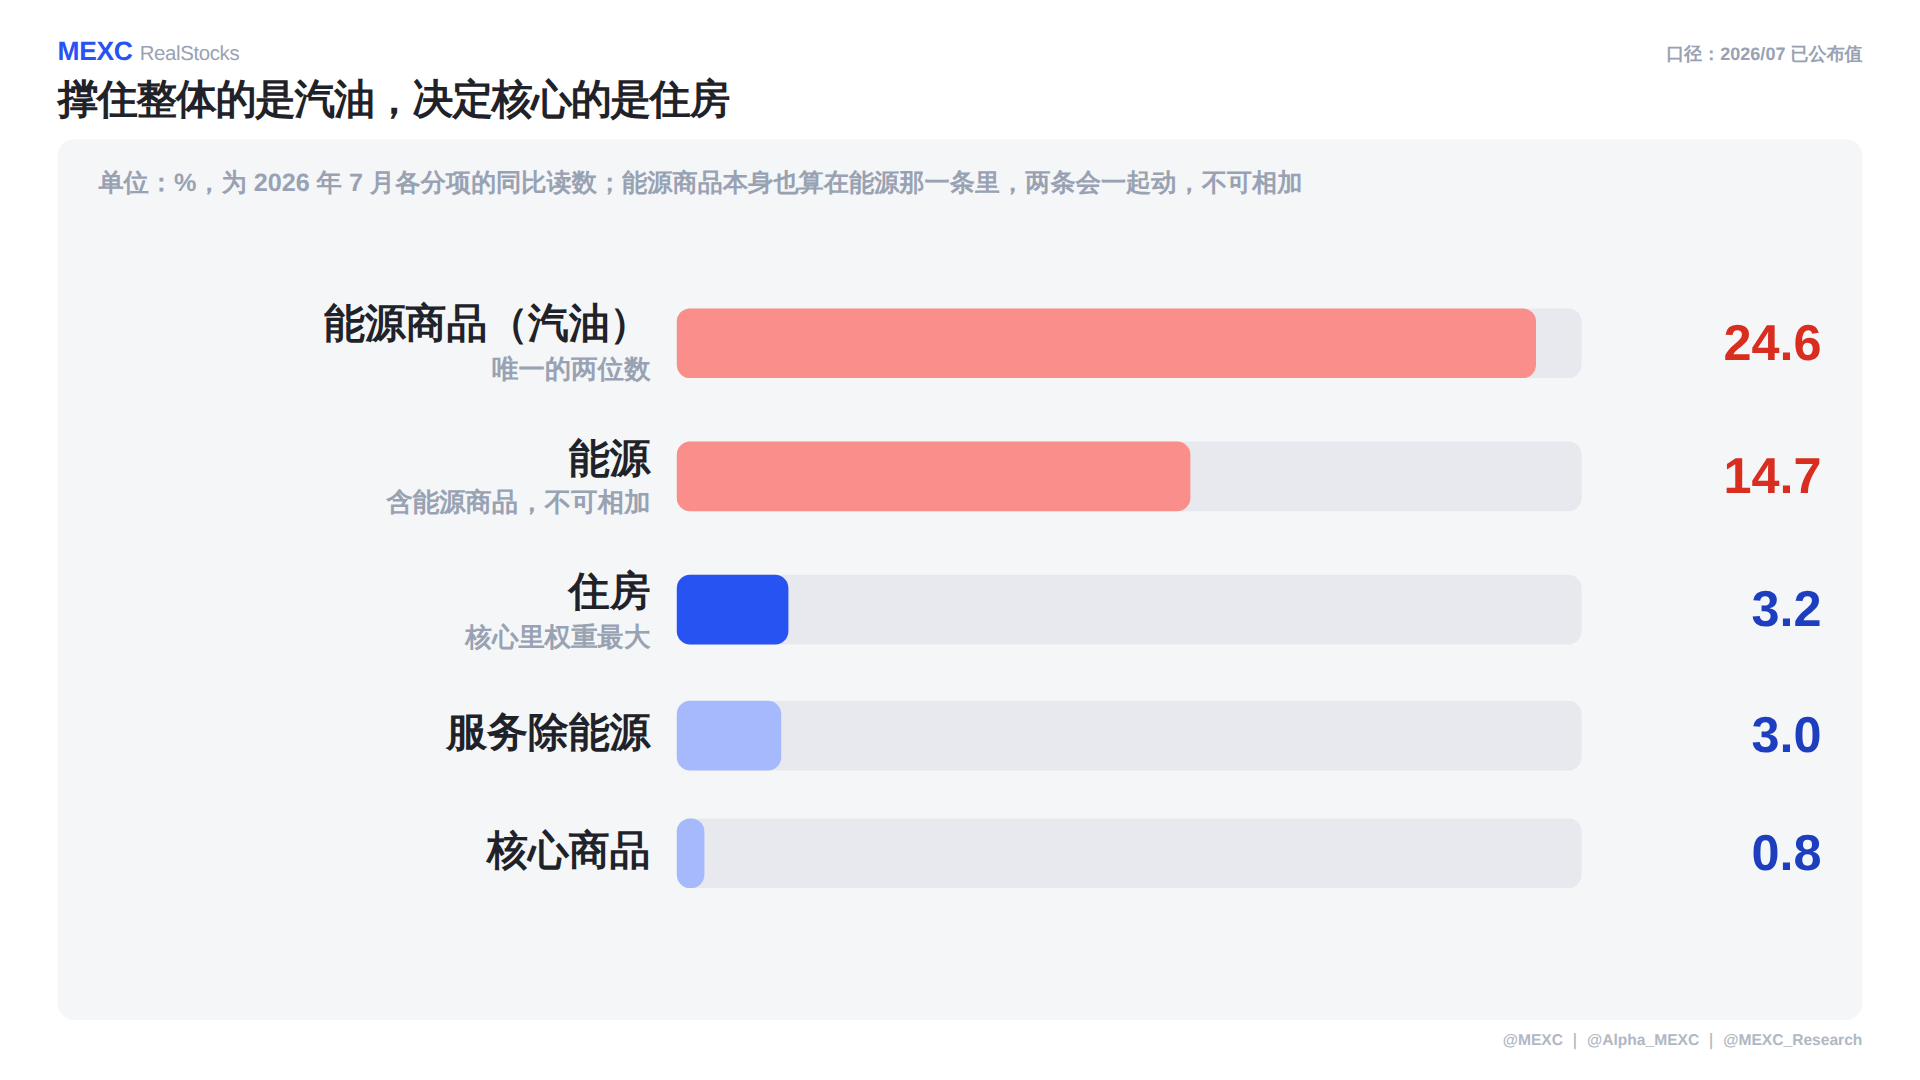
Units are in %, representing year-over-year readings for July 2026 by component. Breaking down July: energy commodities (mainly gasoline) rose 24.6%—the only double-digit figure—while energy overall rose 14.7%; shelter rose 3.2%; services excluding energy rose 3.0%; and core goods rose 0.8%.
There's a definitional issue that must be clarified first: energy commodities are already included within the broader energy category, and the two move together—they cannot be added. Seeing 24.6% and 14.7% side by side, don't assume energy's contribution to inflation is the sum of both.
The comparison worth remembering is this: what's propping up the headline reading is the gasoline line—the only double-digit figure—while core goods rose just 0.8%, exerting almost no upward pressure. Shelter's 3.2% increase may not look high, but it carries the largest weight within core CPI; whether core can continue to decline depends primarily on this line.
So when Friday's data arrives, the read requires two steps: first, check whether core CPI holds at 2.5% year-over-year; second, turn to the shelter line. Relying solely on energy retreat to bring down the headline won't take you far—because the effect of falling energy prices dissipates as the base period shifts, while shelter is a slow-moving variable. Once it stays sticky, the core isn't coming down.
7. FAQ
Q1: KLA (KLAC) rose 7.32% in a single day—why does its "Trend Position" in the five-dimensional score sit at only 44?
Because the two measure different things. A single-day gain compares performance over just that day, while trend position measures where the price sits within its 52-week range. KLA (KLAC) closed at $185.60 on September 4, within a one-year range of $90.67 to $307.37—placing it at the 44th percentile, still in the lower half of its range. In the same scorecard, Peer Ranking scored a perfect 100 while Trend Position was only 44—reflecting exactly this: no one was stronger that day, but its standing isn't high.
Q2: KLA (KLAC) issued no corporate announcements that day—where did the gain come from?
From an overall rotation of capital within the memory complex. That day, SK Hynix rose roughly 7%, SanDisk rose 11.9%, and Micron (MU) rose 6.1%—memory makers were bought first. Since memory manufacturers place orders for inspection and equipment before capacity expansion—and inspection is KLA's (KLAC) core business—capital flowed up the chain accordingly. Note that such gains lack company-level confirmation on the day itself; the actual order figures won't appear until the next earnings report.
Q3: Within the same supply chain, why did some stocks rise while others fell?
Because this wasn't