






8月25日美股盘前报告:Strategy 募资 20.1 亿,一枚比特币都没买


- Key Takeaways: US stock indices closed with divergence on August 24, 2026, as funds rotated from growth stocks into defensive sectors. The day's focus was on Strategy (MSTR), whose stock price rose despite raising $2.01 billion through a new share issuance without adding to its Bitcoin holdings, alongside Bitcoin's 22% weekly gain against only two of six crypto-related stocks closing in the green — highlighting the divergence in transmission mechanisms between crypto prices and crypto stocks.
- Key Elements:
- Market Divergence: Dow rose 0.26%, S&P 500 fell 0.28%, Nasdaq dropped 0.76%; tech sector fell 0.97% while consumer defensive stocks rose 1.82%, showing clear capital preference.
- MSTR Data: Closed at $122.63, up 2.83%, with a market cap of $40.6 billion; Bitcoin holdings remained unchanged (840,447 BTC) after raising $2.01 billion from share issuance, while USD reserves grew to $5.1 billion; Bitcoin-per-share declined due to dilution.
- Crypto Stock Divergence: Bitcoin posted its best weekly gain in nearly two years at +22%, yet only two of six crypto stocks closed in the green, with a spread of nearly 8 percentage points between the best and worst performers — mainly due to differing transmission paths across business models such as treasury holdings, trading fees, and mining operations.
- Beta Application: MSTR has a Beta of 3.56, meaning position exposure is 3.56x the dollar amount; however, Beta only measures correlation with the broader market and does not explain residual risk (company-specific risk). A high Beta may simply reflect greater inherent volatility.
- SMTC Earnings: Reported after market close, with implied volatility of ±21.07% — the highest this week; market focus is on whether data center revenue can reach $97 million (guiding +35% QoQ) and the ramp-up timeline for CopperEdge/1.6T products.
Key Takeaways
On August 24, 2026, U.S. stock indices closed mixed. The Dow Jones Industrial Average rose 0.26% to 53,417 points, the S&P 500 fell 0.28% to 7,653 points, and the Nasdaq Composite dropped 0.76% to 25,980 points. Ahead of earnings season, capital flows clearly shifted from growth to defensive sectors. The standout performer of the day was Strategy (MSTR), closing at $122.63, up +2.83% on the day. However, despite raising $2.01 billion through a new share issuance last week, the company did not purchase a single Bitcoin. On the same day, Bitcoin posted a weekly gain of 22%, yet only two of the six crypto-related stocks closed in the green. This article breaks down three key points: the "Bitcoin per share" metric to watch when reading issuance-for-Bitcoin announcements, how Beta functions as a position amplifier, and the guidance pillar that tonight's post-market SMTC earnings report needs to validate.
1. Today's Market: August 24 Close – Indices Diverge, Money Shifts from Growth to Defensive
Let's look at the closing numbers for the day.
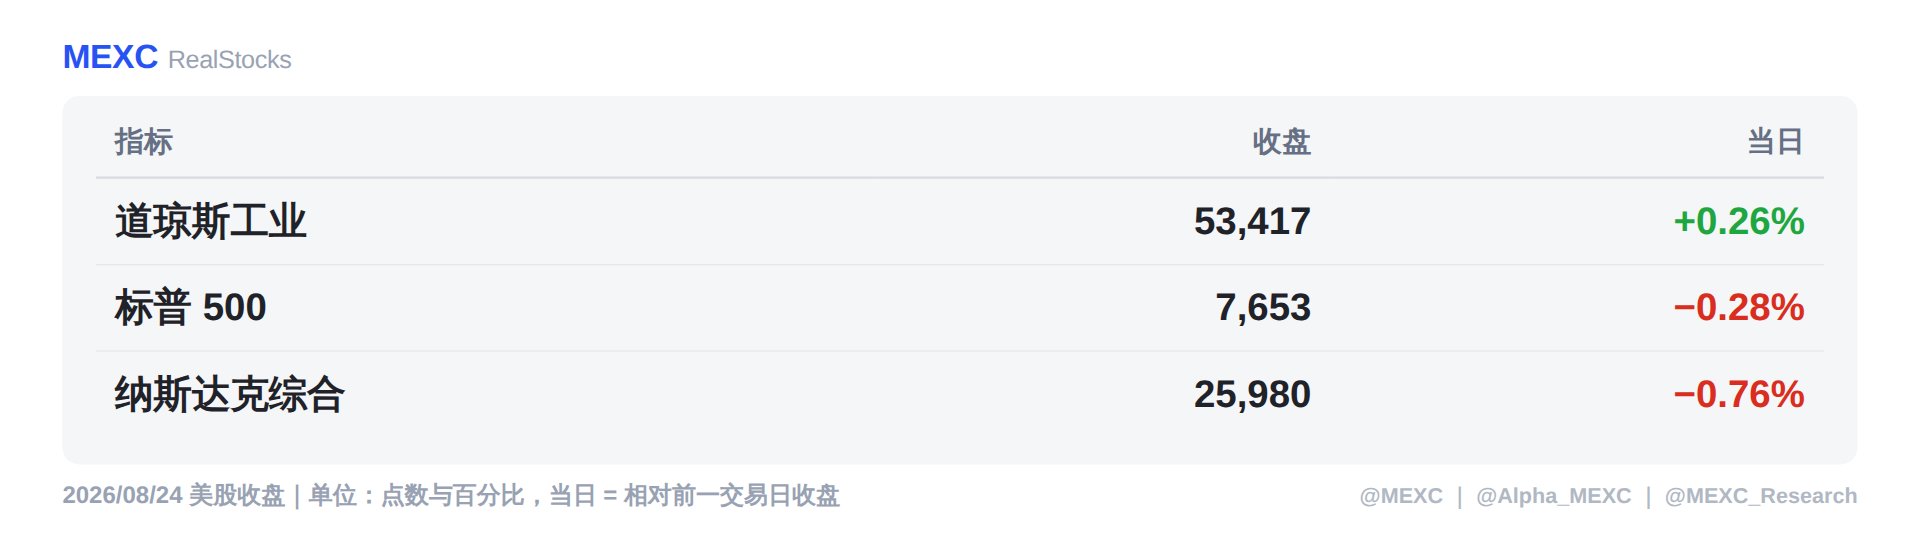
The Dow closed in the green, while the S&P 500 and Nasdaq closed in the red. This isn't simply a case of "mixed results" – it signals capital repositioning: the tech sector fell an average of about 0.97% on the day, while the consumer defensive sector rose approximately 1.82%.
NVIDIA (NVDA) fell 2.91% to $208.48. Notably, there was no specific news about the company that day. This decline is attributable to pre-emptive position trimming ahead of its post-market earnings report on Wednesday – the market reducing risk exposure before a major event. This is a common pattern during earnings season and is distinct from a fundamental judgment call.
PDD Holdings (PDD) reported earnings before Monday's market open, and its stock closed down 1.48% to $87.07. Revenue grew 8% year-over-year to RMB 112.4 billion, but adjusted net profit declined approximately 13% year-over-year. Increased investment in its ecosystem weighed on profits, and management also noted changes in the global trade and regulatory environment. This is a classic "revenue still growing, profits receding" combination.
On the other hand, there were precious metals. December gold futures held near the historic high zone around $4,700. The Nasdaq Gold Index averaged +0.74% on the day, while the semiconductor sector fell 1.82%. The contrasting moves clearly illustrate where capital preference lay that day.
2. Star of the Day: Strategy Rises 2.83%, But Didn't Buy a Single Bitcoin This Time
The strongest performer of the day was Strategy (MSTR, formerly MicroStrategy), closing at $122.63, up +2.83% on the day. Its market cap increased by roughly $1.1 billion in a single day to $40.6 billion; trading volume reached 41.02 million shares, about twice the daily average.
But the real news isn't the price increase.
Last week, the company raised $2.01 billion through a new share issuance of 18.26 million shares, yet its Bitcoin holdings did not increase by a single coin. Of this capital, $1.59 billion was placed into a newly established USD cash account, bringing its dollar reserves to $5.1 billion. The company still holds 840,447 BTC with an average cost of $75,385 per coin – and with the price back above $77,000, the paper value of these holdings has turned positive.
One-Minute Concept: For Issuing Shares to Buy Bitcoin, Watch the "Bitcoin Per Share" Metric
The most common metric used to compare such companies is how much Bitcoin backs each share.
When a company issues new shares at market price for cash, the increase in share count is called dilution – but if the cash raised is converted into more Bitcoin, the Bitcoin backing per share actually increases, making the dilution beneficial to existing shareholders.
The August 24 announcement is precisely the opposite case: shares were issued, but no Bitcoin was added.
So the method for reading such announcements is straightforward: first grab two numbers – how much share count increased, and how much Bitcoin increased. Only by looking at both together can you determine whether the Bitcoin-per-share metric is moving up or down. Looking only at the amount raised, or only at how much the stock price moved that day, will lead to incorrect conclusions.
Five-Dimension Score: Strongest and Weakest Appear in the Same Chart
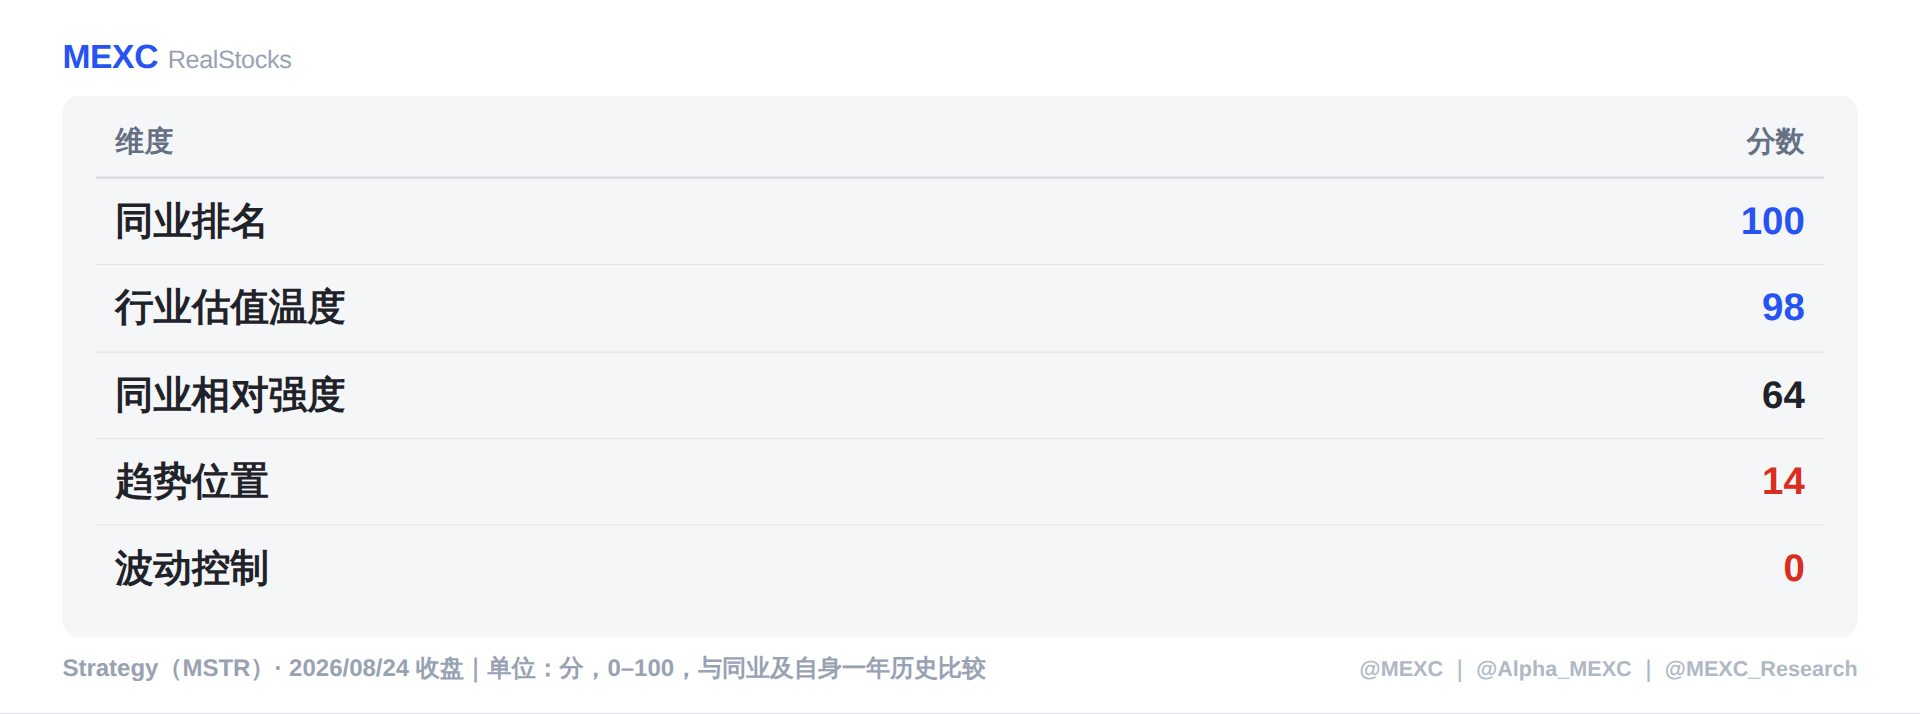
The shape of this scorecard is itself the conclusion: perfect score for peer ranking, 98 points for industry valuation temperature, but only 14 points for trend position and 0 points for volatility control.
In plain English – it is indeed the strongest among its peers, but its price remains in the 14th percentile low of its one-year range, and its volatility is extremely amplified (Beta 3.56).
One more detail worth noting: the stock reached an intraday high of $125.11, with an intraday gain of +4.9%, before closing back to +2.83%. Different media outlets cite numbers from different points in time. When you see two different gain percentages, first confirm whether the source is referencing the intraday high or the closing price. The next update on holdings and cash will be disclosed in a subsequent 8-K filing.
3. Star of the Day: Bitcoin Rises 22% in a Week, Only Two of Six Crypto Stocks Close Green
The truly memorable comparison is here.

Bitcoin delivered its best single-week performance in nearly two years, gaining 22% for the week. Yet on the same day, among these six "crypto concept stocks," only two closed in the green, while four closed in the red, a spread of nearly 8 percentage points between the top and bottom performers. The Nasdaq Financial Capital Markets Index also averaged -1.53% on the same day.
This illustrates one key point: Bitcoin prices and crypto stocks have never followed the same curve.
The same driver landing on different balance sheets transmits with completely different efficiency – some companies directly hold Bitcoin, so price changes are fully reflected in their book value; others earn fees from trading volume, requiring transaction volumes to generate revenue; and some are mining and computing infrastructure operations, with cost structures weighed down by significant fixed assets and debt – a rising Bitcoin price doesn't necessarily mean better current-period results.
Transferable Judgment: When a sector is presumed to "move together in lockstep," re-group the companies by how their revenue is generated rather than by their label.
4. US Stock Mini-Lesson: Beta Is Not a Risk Score, It's a Position Amplifier
The Beta 3.56 that keeps appearing above is exactly the indicator we'll unpack today.
Investing the same $100,000 in different stocks might give you the equivalent of $100,000 of market exposure in one, but $350,000 in another – the difference isn't how much you invested, but how many times your chosen stock amplifies the market's movements.
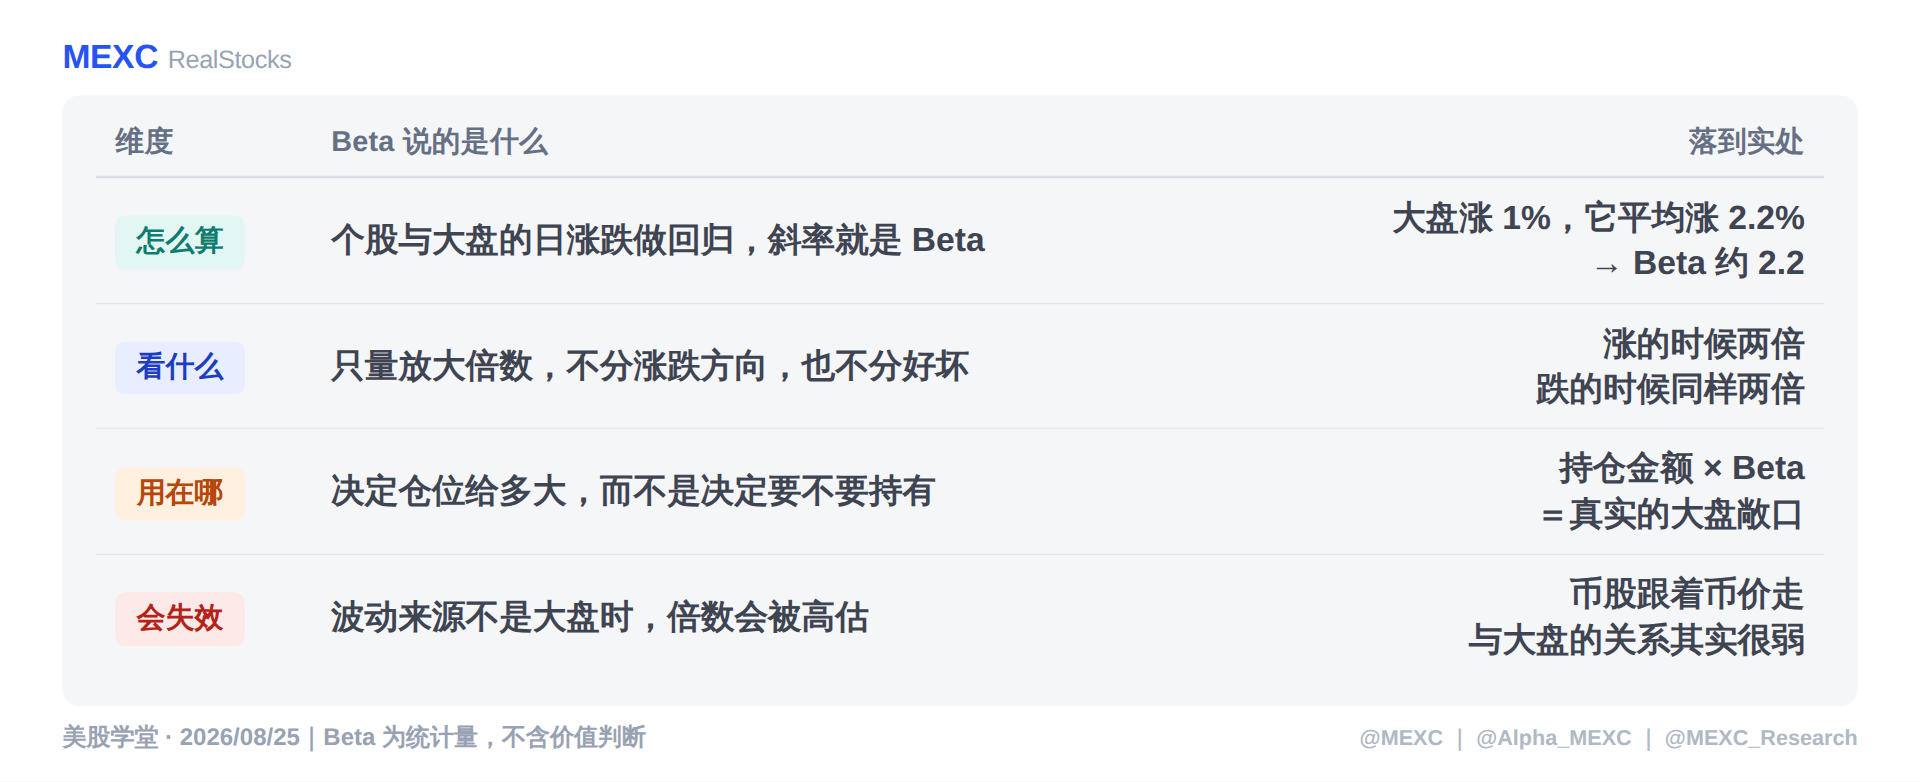
The real takeaway from this table is in the last row.
Beta only answers "how much does it move," and never "why does it move." Two stocks with the same Beta of 3 might have one tracking interest rate expectations and the other tracking Bitcoin – same multiplier, completely different drivers.
Is a Stock with Beta 3 Three Times Riskier Than the Market?
Not necessarily. Beta only measures the portion that "moves with the market." The regression also has a residual term, which captures the company-specific factors – earnings, regulation, loss of a key customer – Beta doesn't account for them at all.
The accurate interpretation is: Beta 3 means "for every 1% the market moves, it moves an average of 3%." As for how much it moves independently beyond that, this number says nothing.
Look at explanatory power, not just the multiple. When a regression's explanatory power (R²) is low, it indicates the market can't explain the stock's movements. In that case, a high Beta is the wrong tool for the job – it's actually measuring "high volatility," not "sensitivity to the market." This is precisely the situation with crypto stocks: their Betas are high largely because they are inherently volatile, not because they move in sync with the market.
Transferable Criterion: When you encounter any Beta, first ask two questions – how long is the sample period, and has the company changed its business during that period. If it has, the multiple calculated from old data describes a different company entirely.
5. US Stock Mini-Lesson: Six US Companies, Betas Differing by More Than Tenfold
When you lay out the numbers, the gap is larger than most people expect.
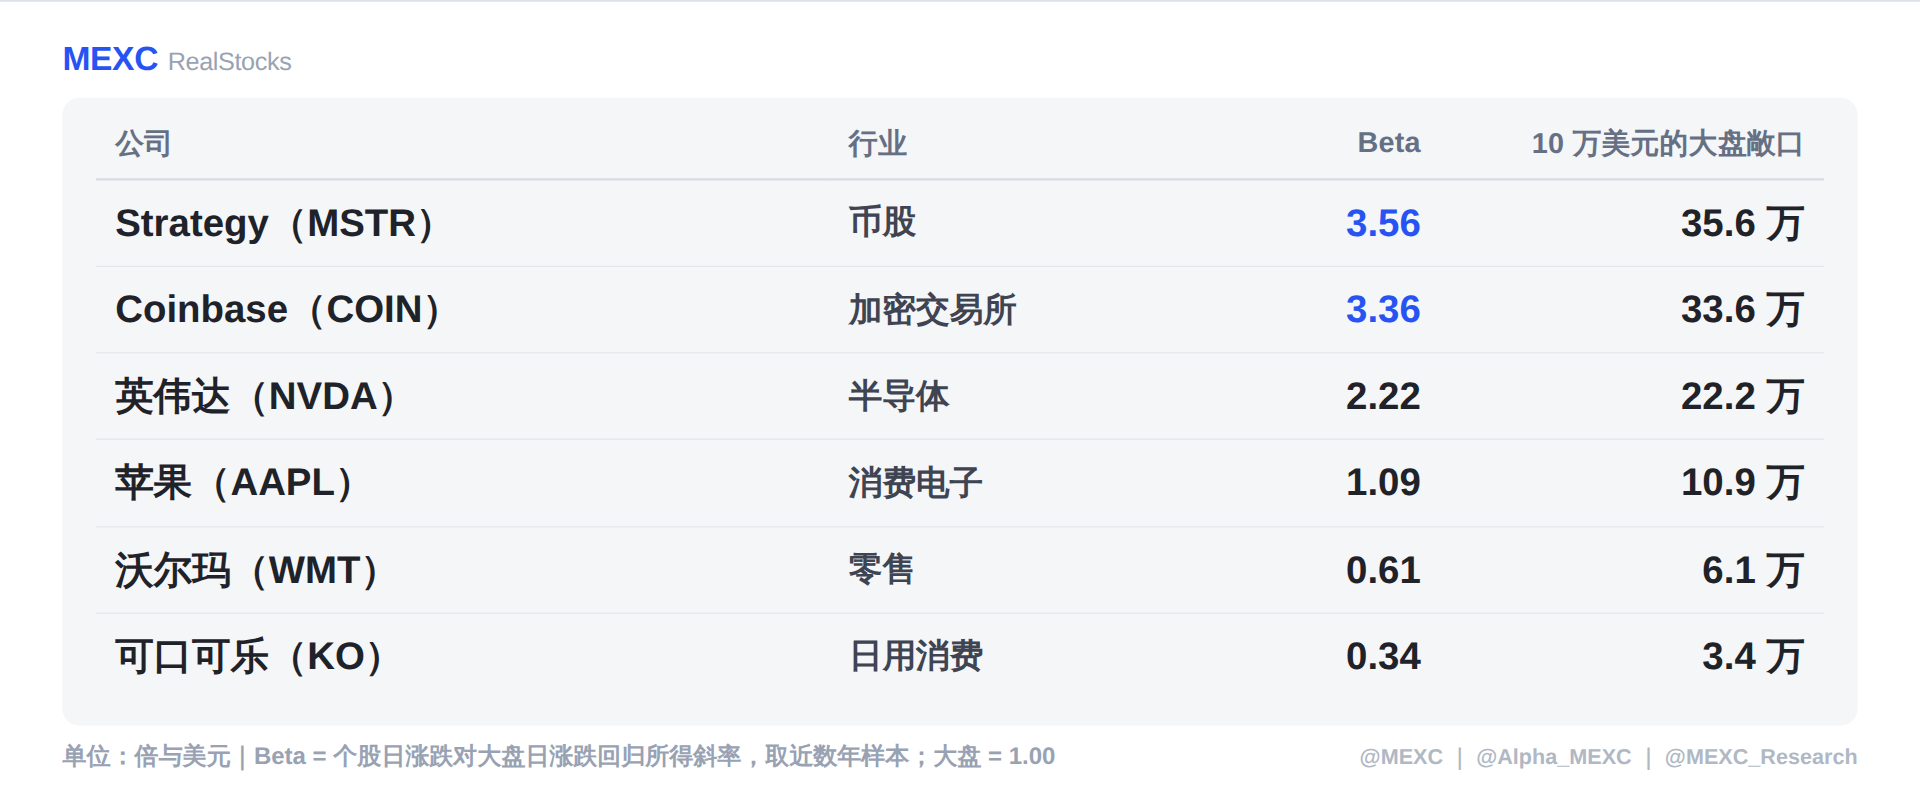
From Coca-Cola's 0.34 to Strategy's 3.56, the multiples differ by more than tenfold, and all six are US-listed companies.
With the same $100,000 position, the former equates to $34,000 of market exposure, while the latter equates to $356,000. The dollar amount is identical, but the market risk undertaken is entirely different.
So in practice, there are two rules:
First, convert first, then decide the position size. Position value × Beta equals your true market exposure. To achieve the same exposure in MSTR as you would in Apple, you'd only be able to open roughly one-third of the position size.
Second, high Beta doesn't mean it follows the market. First ask where the stock's volatility comes from; if you misidentify the source, the multiple is just statistical noise.
6. What to Watch Tonight: Consumer Confidence at 14:00 UTC, SMTC After the Close
Tonight at 14:00 UTC, the August Consumer Confidence Index will be released (along with New Home Sales). The macro focus this week is Wednesday at 12:30 UTC with the Core PCE Price Index and revised Q2 GDP, followed by the Jackson Hole Symposium speech on Friday – tonight's release is the only demand-side indicator for the first half of the week.
Post-market earnings: SMTC Corporation, at 20:30 UTC, options-implied volatility ±21.07%.
The company doesn't make switches or optical modules; instead, it sells the signal chips that go inside optical modules: FiberEdge drivers and transimpedance amplifiers are responsible for pushing electrical signals onto fiber optic cables, while CopperEdge provides active equalization chips that enable copper cables to run at higher data rates. Whoever is shipping 800G and 1.6T optical modules is also shipping its products – making it a leading indicator for AI network-side demand.
What to Watch Isn't Total Revenue, It's the Data Center Segment

The reason for ignoring total revenue is simple: within total revenue, the IoT and high-end consumer segments still account for the majority and are growing steadily, which averages out the real changes. What truly determines how the market values the company is whether the data center segment can continue to accelerate.
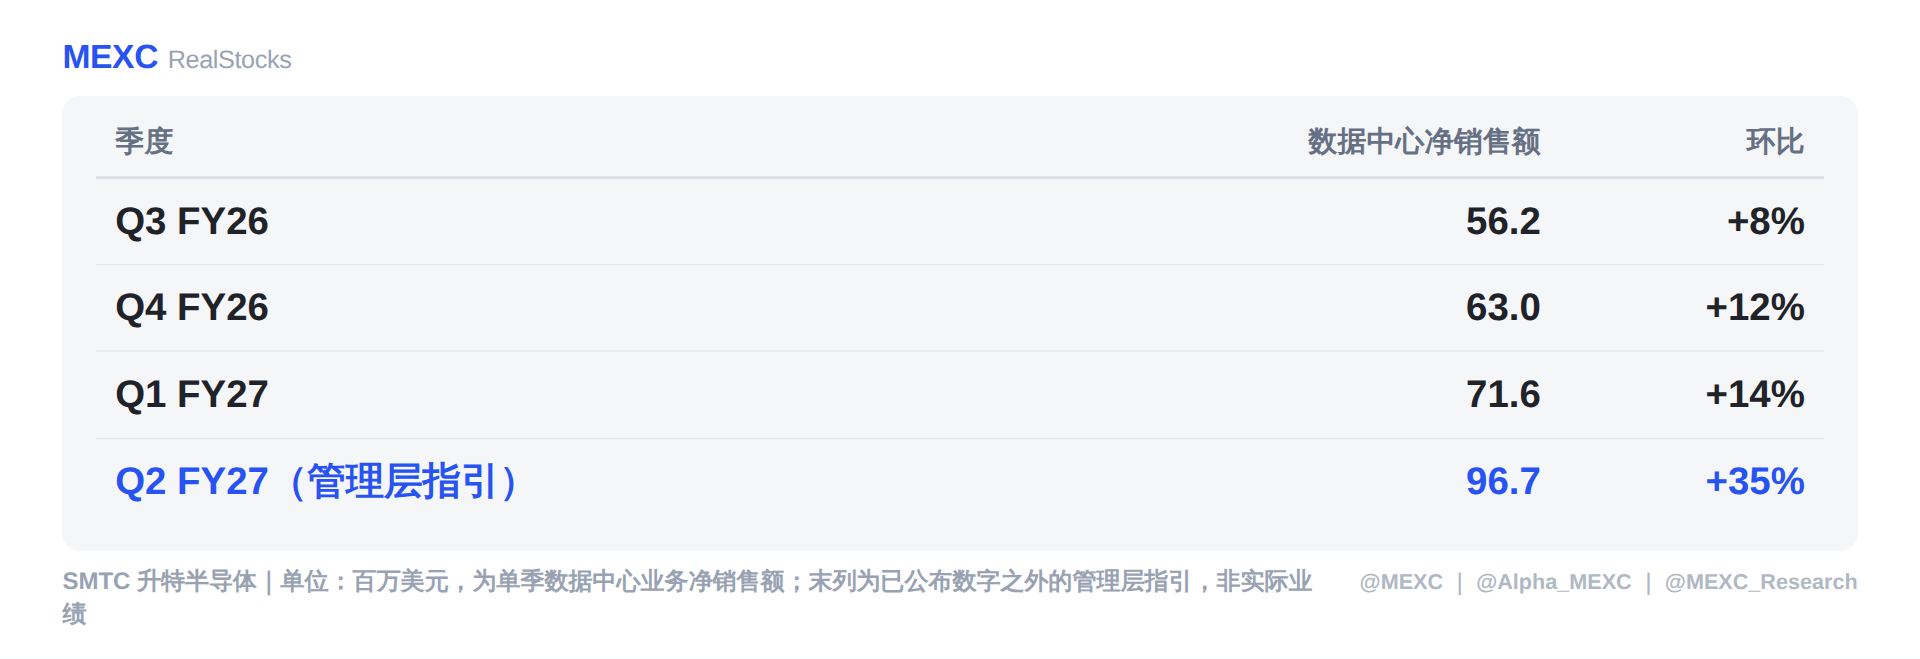
The three reported quarters showed steady sequential growth of +8% / +12% / +14%, but management's guidance for the second fiscal quarter jumps directly to sequential +35%, year-over-year +85%, approximately $97 million. Last quarter's $71.6 million was already a record level, up 39% year-over-year.
Two Things to Watch Tonight:
- Whether data center segment net sales can reach approximately $97 million, which is the fulfillment line for the +35% sequential guidance. Meeting it means acceleration; falling short means the pace has been delayed.
- How management discusses customer adoption progress for CopperEdge active copper cables on the earnings call, and the shipment cadence for 1.6T FiberEdge – these two items determine the slope for the second half of the year.
This Week's Dispersion Ranking: The Smallest Company Has the Deepest Divergence
SMTC's ±21.07% is the highest this week, more than three times NVIDIA's ±6.17%. This is related to the stock having fallen more than 30% from its June high – the smallest company by market cap has the deepest market divergence.
It's important to emphasize that implied volatility is derived from option prices and measures the expected one-day amplitude after the earnings release – it indicates magnitude only, not direction. A larger number represents deeper disagreement, not a higher likelihood of a decline.
7. Frequently Asked Questions (FAQ)
Q1: Is a company issuing new shares to raise funds for buying Bitcoin good or bad for existing shareholders?
The key isn't how much was raised, but whether Bitcoin per share is moving up or down. An increase in share count is dilution, but if the cash raised is converted into more Bitcoin, the Bitcoin backing each share actually increases, which is beneficial to shareholders. So when reading such announcements, you need to capture two numbers simultaneously: how much share count increased, and how much Bitcoin increased. The 8/24 announcement was the opposite case – $2.01 billion in shares issued, with no change in Bitcoin holdings.
Q2: Why did Bitcoin rise 22% in a week, yet most crypto stocks closed lower?
Because the transmission paths differ. Companies that directly hold Bitcoin see price changes fully reflected in their book value; companies that earn fees from trading need trading volume to generate revenue; and mining and computing infrastructure operations have cost structures weighed down by significant fixed assets and debt – a rising Bitcoin price doesn't necessarily mean better current-period results. On 8/24, only two of the six crypto stocks closed green, which reflects exactly this difference.
Q3: How should Beta actually be used?
Beta is the amplification factor of an individual stock's volatility relative to the market; it describes magnitude only, not direction. Two practical methods: first, when you see a daily percentage move, divide it by Beta to assess whether the move is abnormal; second, use it to inversely size positions – position value × Beta = true market exposure. If you want to take on market-equivalent risk, a stock with Beta 3.56 would only allow a position roughly one-third the size.
Q4: Is a stock with Beta 3 three times riskier than the market?
Not necessarily. Beta only measures the portion that "moves with the market"; the residual term in the regression captures what's specific to the company – earnings, regulation, customer churn – Beta doesn't account for these at all. Also, you need to look at the regression's explanatory power: when it's low, a high Beta is actually measuring "high volatility," not "sensitivity to the market."
Q5: Why do different media outlets report different gains for the same stock?
Most likely, they're referencing different points in time. On 8/24, MSTR reached an intraday high of $125.11, up 4.9%, before closing back at +2.83%. When you see two different numbers, first confirm whether the source is referencing the intraday high or the closing price.
Q6: Can options-implied volatility be used to predict whether a stock price will rise or fall?
No. Implied volatility is derived from option prices and measures the expected one-day amplitude after the earnings release – it indicates magnitude only, not direction. A larger number represents deeper market disagreement. SM


