Bitcoin Nears $80K Mark, HYPE Hits New All-Time High | Special Analysis


- Key Insights: Bitcoin surged 26.72% last week, reaching $79,515 and approaching the $80K mark, while HYPE hit a new all-time high of $83.38. Analysis suggests that BTC's daily wave C is nearing its end, with this week's focus on a potential wave D pullback and the conclusion of wave E rebound. Range-bound consolidation remains the most probable scenario; HYPE has opened upside room after breaking its previous high, targeting $90.
- Key Factors:
- Bitcoin began its rebound from the July 1 low of $57,820. Wave C has been running for 22 trading days with a maximum gain of 27.8%, approaching the 1.9x extension target of wave A (15.8%).
- On the weekly timeframe, since the October 2025 high of $126,200, the market has been in a four-segment corrective structure. The current (3-4) rebound segment is approaching the upper boundary of the range at $82,850, a key bullish/bearish dividing line.
- Quantitative models indicate significant short-term overbought conditions. Combined with the strong resistance zone of $80,600–$82,850, the probability is high that the (3-4) rebound segment will conclude at the upper boundary of the range. Path 2 (rejection from the upper boundary with continued range-bound consolidation) carries the highest probability.
- BTC's key resistance levels are $80,600–$82,850, $84,500, and $90,000; support levels are $73,500–$75,000 and $67,300–$69,100.
- HYPE has been tracked for 27 consecutive periods since its first coverage on February 23, with a maximum gain of 225.7%; the rally from the August 2 low of $51.11 has run for 21 trading days and reached a new all-time high.
- HYPE's key resistance is $90, with support at $77 and $73. Strategy: existing holders should move up stop-losses, while those without positions should wait for a confirmed pullback to $77 and then enter light long positions.
This week, the crypto market once again delivered a breathtaking performance. Fueled by macroeconomic tailwinds, Bitcoin surged 26.72% in a single week, reaching a high of $79,515 and closing in on the psychological $80,000 mark. Meanwhile, HYPE stole the spotlight, hitting a new all-time high of $83.38 on the back of significant positive news. Market sentiment has undergone a dramatic reversal — the pervasive pessimism that dominated earlier has quickly dissipated, with a growing number of investors shifting from观望 to actively building long positions.
Looking back at last week's analysis, we explicitly stated in our article that "the probability of the daily chart continuing its upward wave C is relatively high." The market's subsequent movement has aligned closely with our forecast, with Bitcoin completing its powerful rally as expected. As for HYPE, we also identified early on in the low zone a signal of a "daily-level rebound forming from the August 2 low," and have been tracking it continuously since. The live market performance has once again validated the logic of our analytical framework. In fact, since our initial coverage of HYPE on February 23, we have maintained weekly updates for 27 consecutive editions, during which the maximum gain reached 225.7%. This is not merely a coincidental call but a powerful testament to the long-term efficacy of our systematic analytical framework.
At the current juncture, while market sentiment has clearly warmed, powerful rallies are often followed by intense battles at key resistance levels and heightened volatility. This week, we will continue to systematically outline the potential evolution paths for BTC and HYPE based on multi-timeframe wave structure, quantitative model signals, and key support/resistance levels, providing specific short-to-medium-term trading plans to help you seize higher-probability trading opportunities amid fluctuating market conditions.
Summary of This Week's Core Trading Views:
• BTC Multi-Timeframe Trend Structure Analysis (Details in Part 1)
• BTC Weekly Market Forecast and Medium/Short-Term Trading Strategy (Details in Part 2)
• HYPE Daily-Level Trend Structure Analysis (Details in Part 3)
• HYPE Weekly Market Forecast and Short-Term Trading Strategy (Details in Part 4)
Market Validation of Last Week's Trading Strategy and Core Views:
• BTC Market Analysis Validation — Emphasized in last week's article: The probability of the daily chart continuing its upward wave C was relatively high. As it stands, the actual market movement has matched our forecast.
• HYPE Market Analysis Validation — Review from last week's article: The probability of a daily-level rebound from the August 2 low was significant. Current live market action is highly consistent with our analytical view.
I. Bitcoin Multi-Timeframe Trend Structure Analysis
Last week, Bitcoin surged on significant volume, catalyzed by macroeconomic tailwinds, recording a maximum single-week gain of 26.72% and reaching a high of $79,515, approaching the psychological $80,000 milestone. Following this powerful price rally, market sentiment has notably reversed, with many investors shifting from excessive pessimism about the medium-term trend to actively taking long positions. Below, we will systematically analyze the current market from two dimensions — the weekly chart trend structure and the daily wave pattern — combined with key resistance levels, to clarify the market's current stage and subsequent evolution path, providing a reference for investment decisions.
1. Bitcoin Weekly-Level Trend Structure Analysis: (Based on market analysis since October 6, 2025)
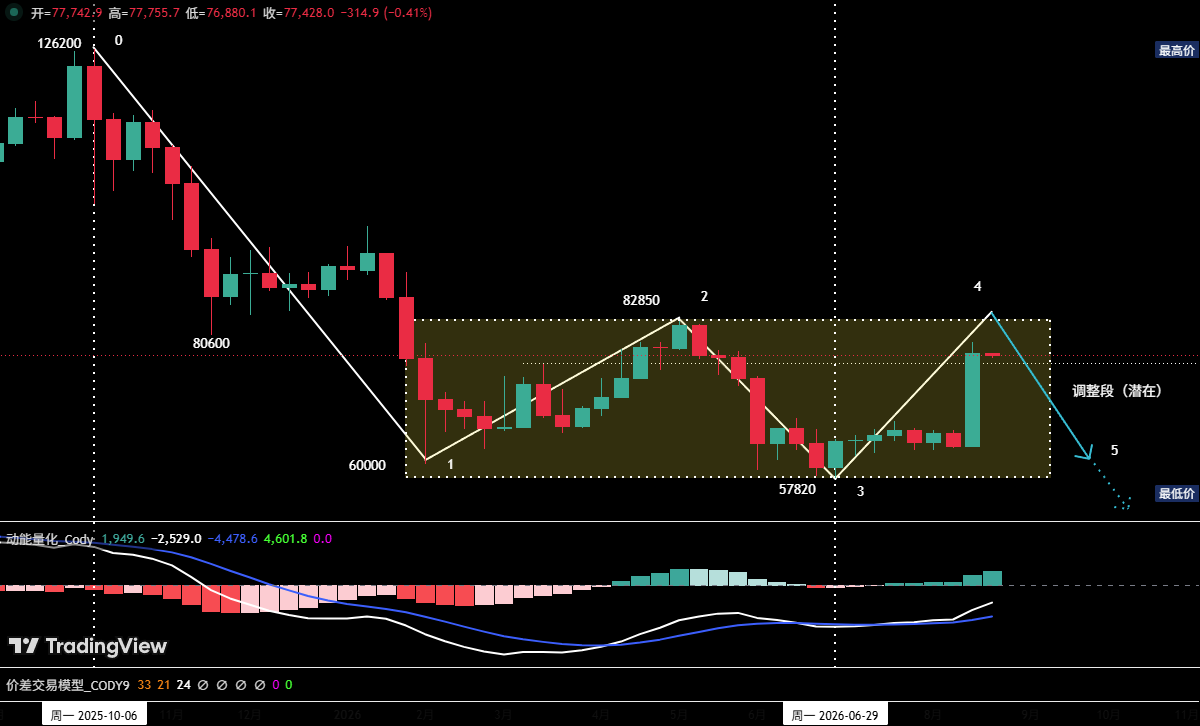
Chart 1: Bitcoin Weekly K-line Chart
①, The weekly structure shows that the medium-term correction initiated from the October 6, 2025 high of $126,200 has, to date, presented a four-segment adjustment structure: (0-1), (1-2), (2-3), (3-4). Currently, it is trading within the (3-4) rebound segment.
②, Since breaking below $82,850 on January 31, the price has overall fallen into a wide-ranging consolidation pattern between $57,820 and $82,850. The weekly chart indicates that the current rebound is once again approaching the upper boundary of this range around $82,850, a level that constitutes the short-term bull/bear demarcation line.
③, Whether this (3-4) rebound segment can effectively break through the upper boundary of the range is the core variable determining the medium-term trend. Based on technical pattern projections, the subsequent market could follow one of three paths:
Path 1: Break Above the Upper Bound, Opening Upside Space
The rebound segment (3-4) continues its upward trajectory. If the price effectively holds the strong resistance zone of $80,600–$82,850 and breaks above the upper boundary of the range, a new upward leg would commence, targeting the $90,000 psychological level.
Path 2: Resistance at the Upper Bound, Maintaining Range-Bound Consolidation
The rebound shows signs of stalling near the upper boundary of the range, with technical indicators issuing topping signals, leading to the termination of the rebound segment (3-4) near the upper bound. The price would then pull back towards the middle or lower boundary of the range to seek support, potentially initiating a downward adjustment segment (4-5); once segment (4-5) concludes within the range or near its lower boundary, the price would likely attempt to challenge the upper boundary again.
Path 3: Resistance at the Upper Bound, Breaking the Range to Continue Downtrend
The rebound segment (3-4) terminates near the upper boundary. The price then declines consecutively and effectively breaks below the support at the lower boundary of $57,820, initiating a downward adjustment segment (4-5). After breaking the lower boundary support, this segment continues to fall, seeking lower support levels, thereby extending the downtrend.
④, According to our proprietary quantitative model analysis, after the sharp short-term surge, overbought signals are significant. Combined with the suppression from the strong resistance zone of $80,600–$82,850, the probability of the current (3-4) rebound segment concluding near the upper boundary of the range is extremely high. Integrating the three evolution paths above, the likelihood of Path 2 is the greatest.
2. Bitcoin Daily-Level Trend Structure Analysis:
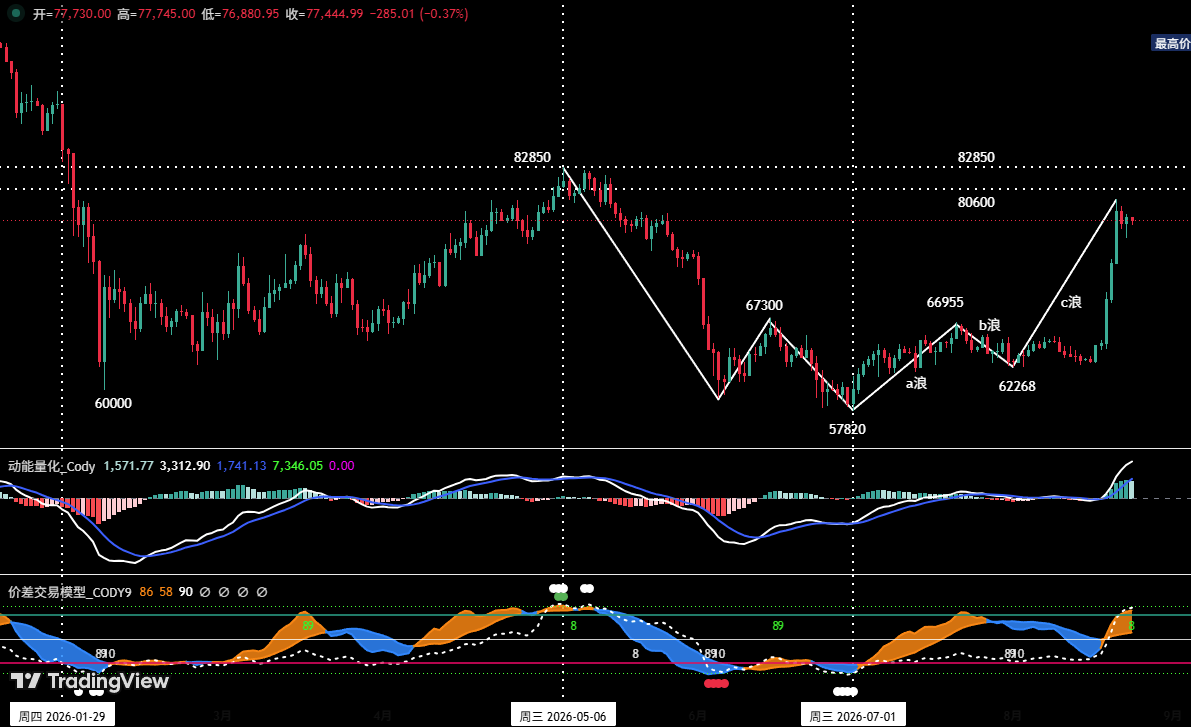
Chart 2: Bitcoin Daily K-line Chart
Daily Wave Structure Analysis: The rebound initiated from the July 1 low of $57,820 corresponds to the weekly-level (3-4) rebound segment. Below, we will break down this segment within the daily timeframe, using wave counts to clarify the current stage of the rebound and provide technical support for short-term trend assessment.
1. Wave A (Impulse/Rebound Wave): July 1 to July 21
▪ Start: $57,820, End: $66,955
▪ Duration: 21 trading days
▪ Maximum gain: 15.8%.
2. Wave B (Corrective Wave): July 21 to August 1
▪ Correction Range: $66,955 → $62,268
▪ Correction Period: 11 trading days
▪ Technical Feature: The pullback precisely tested the 50% Fibonacci retracement level of Wave A's advance.
3. Wave C (Impulse/Rebound Wave): From August 1 to Present
▪ Starting Point: $62,268
▪ Currently trading for 22 trading days (ongoing).
▪ Current maximum gain: 27.8%, approaching 1.9 times the gain of Wave A.
4. Weekly (3-4) Rebound Segment, Likely Corresponds to a Daily 5-Wave Rebound
From a technical pattern and volume perspective: To date, the high of Wave C has touched approximately $79,571 (achieving the 1.9x extension target of Wave A), accompanied by increased trading volume over consecutive sessions. This significant change elevates the probability of Wave C transforming into a main impulse wave. If Wave C concludes, after a subsequent Wave D correction, it is highly likely that a Wave E advance will emerge and break above the Wave C high.
II. Bitcoin Weekly Market Forecast and Trading Strategy
1. BTC Weekly Market Forecast:
Core View This Week: Closely monitor the potential termination point of the daily Wave E rebound and the effective support levels for the potential Wave D correction.
2. Key Resistance Levels:
• First Resistance Zone: $80,600–$82,850 (Key previous level)
• Second Resistance Zone: Around $84,500 (Key previous resistance area)
• Third Resistance Zone: $90,000 area (Key psychological level)
3. Key Support Levels:
• First Support Level: $73,500–$75,000 zone (Key previous support area)
• Second Support Level: $67,300–$69,100 zone (Key previous support area)
4. This Week's Trading Strategy (Excluding Impact of Unexpected News)
①, Medium-Term Strategy:
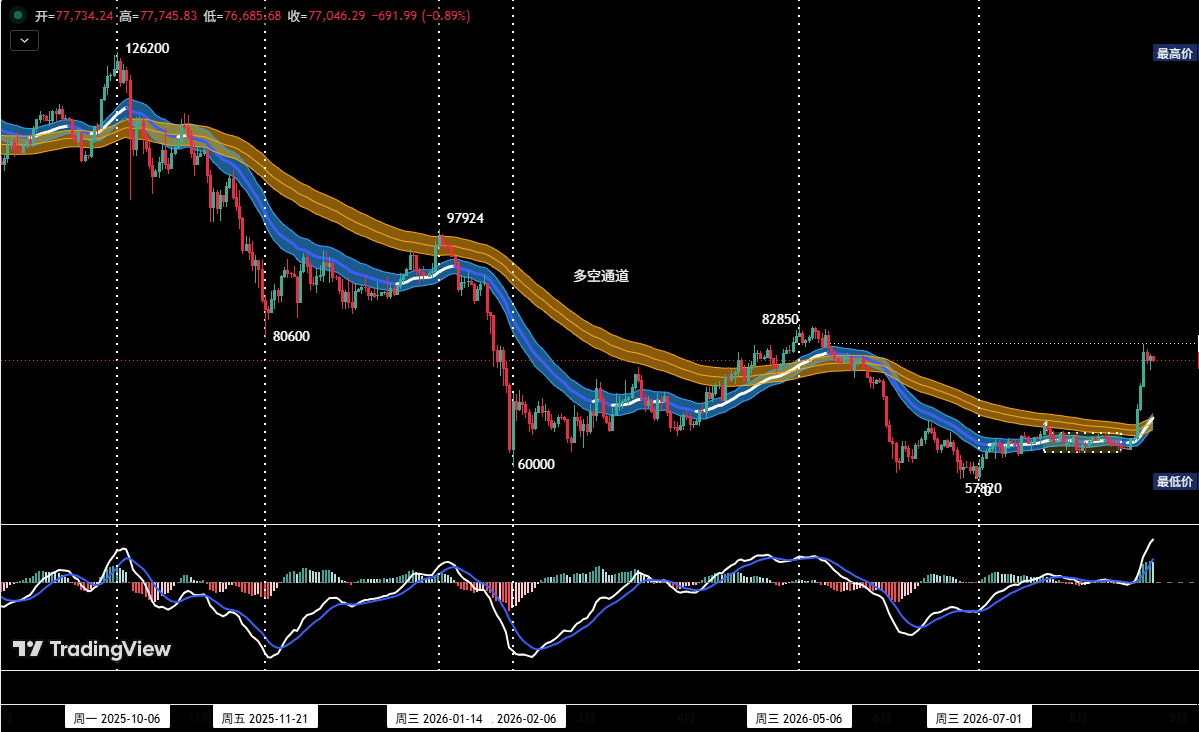
Chart 3: Bitcoin Daily K-line Chart: (Position Monitoring Model)
Position Monitoring Model: As shown in (Chart 3), the current price has effectively broken through the "Bull/Bear Channel," indicating a short-term shift in market structure. The current medium-term position is reduced to zero, maintaining a cash-only observation stance for now.
②, Short-Term Strategy: Utilize 30% of capital with stop-losses in place, seeking "spread" trading opportunities based on support and resistance levels. (Using the 30-minute/60-minute timeframe as the operating cycle).
③, For short-term operations, to dynamically adapt to complex market evolution, we have drafted the following operational plan in advance.
• Plan A: Light Long Position on Strong Support Zone.
• Entry: If a pullback occurs after the end of the Wave C rebound, and when the price falls back to the aforementioned first or second key support levels, showing clear signs of stabilization with the quantitative model simultaneously issuing a bottom signal, a long position of around 30% can be established.
• Risk Management: Set initial stop-loss.
• Exit: When the price rebounds near key resistance levels, combined with model signals, the position can be progressively closed to take profits.
III. HYPE Daily-Level Trend Structure Analysis:
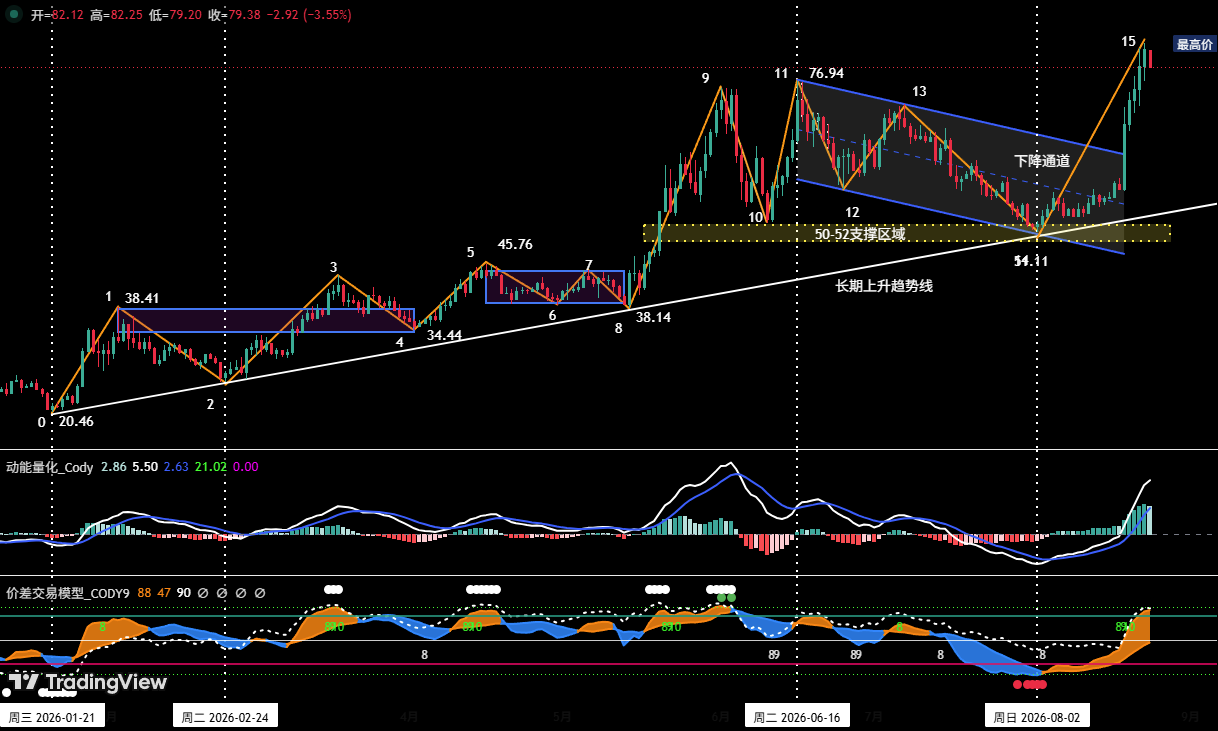
Chart 4: HYPE Daily K-line Chart
1. HYPE Recommendation and Analysis History
①, Initial Coverage and Core Upward Logic (February 23)
In our weekly review published on February 23, we first presented the investment value and long opportunity in HYPE. At that time, the broader crypto market was in an extremely pessimistic environment. Based on trend theory analysis, we arrived at the following core judgments:
First, Trend Theory Reversal Confirmation
After completing its bottom formation at $20.46 on January 21, 2026, HYPE initiated an independent, upward-trending consolidation. At that time, the price had confirmed a breakout above the long-term descending trendline connecting the September 2025 high (approximately $59.48) and the October 2025 high (approximately $50.17), signaling an official reversal of the previous bearish structure.
Second, Elliott Wave Theory Projection
Using Elliott Wave Theory to deconstruct HYPE's price structure, we noted:
▪ Medium-term Wave I (Impulse Wave): January 21 ($20.46) to February 3 ($38.41)▪ Medium-term Wave II (Corrective Wave): February 3 to February 23, indicating the correction structure was nearing its end
▪ Medium-term Wave III (Potential Main Impulse Wave): Poised to start at any time.
(For detailed content, please refer to the February 23 Weekly Review article)
Currently, the daily chart shows that the medium-term Wave III (Main Impulse Wave) officially commenced from the February 24 low of $25.60. We precisely captured this key launch point.
②, Continuous Tracking and Performance Validation
Since February 23, we have published 26 consecutive special analyses, with this week marking the 27th (maintaining a weekly update frequency). Each edition systematically deconstructs the evolution of the trend structure from a multi-timeframe perspective, providing clear investment decision recommendations and trading plans for the following week.
▪ Price Milestone: Last week, driven by significant positive news, the price reached an all-time high since its listing, touching $83.38.
▪ Performance: Since the initial recommendation, the maximum gain has reached 225.7%, validating the effectiveness of the initial investment logic.
2. Daily Trend Structure Analysis:
The current upward move, initiated from the August 2 low of $51.11, has been running for 21 trading days. Catalyzed by significant positive news last week, the price has already set a new all-time high. Currently, the daily chart indicates that the corrective trend from June 16 to August 2 has concluded. Last week saw both price and volume rise, indicating ample upward momentum: with the price hitting a new all-time high, further upside space is suggested, with the next target pointing to the $90 psychological level.
IV. HYPE Weekly Market Forecast and Short-Term Trading Strategy
1. HYPE Weekly Market Forecast:
①, Key Resistance Levels:
• First Resistance Level: Around $90
②, Key Support Levels:
• First Support Level: Around $77
• Second Support Level: Around $73
Core View This Week:
Focus on observing whether the breakout above the previous high resistance at $77 last week is confirmed by a successful pullback retest.
2. HYPE Short-Term Trading Strategy This Week:
Short-term operations this week:
①, For those holding long positions: If you established longs in the $50–$52 zone according to the previous trading plan, it is recommended to raise the initial stop-loss to protect existing profits, strictly adhere to stop-loss discipline, and hold for further gains.
②, For those in cash: If the price pulls back to the previous high resistance at $77 and confirms an effective breakout, consider light long positions. Ensure a stop-loss is set and strictly enforced.
V. Special Notes:
1. On Entry: Immediately set an initial stop-loss.
2. When Profit Reaches 1%: Move the stop-loss to the entry cost price (breakeven point) to ensure capital safety.
3. When Profit Reaches 2%: Move the stop-loss to the 1% profit level.
4. Continuous Tracking: Thereafter, for every additional 1% profit, the stop-loss moves up by 1%, dynamically protecting and locking in gains.
The financial market changes rapidly, and all market analyses and trading strategies require dynamic adjustments. All views, analytical models, and trading strategies presented in this article are derived from personal technical analysis and serve solely as personal trading logs. They do not constitute any investment advice or operational basis. The market carries risks; investment should be cautious. Please do not make decisions based solely on this content.