Five historic indicators are simultaneously flashing signals that the Bitcoin bear market has bottomed out.


- Core Thesis: Multiple long-term indicators based on market cycles, relative strength, and on-chain cost basis are simultaneously emitting extreme signals, suggesting Bitcoin may be near or at the price and time low of the current bear market. The next 1-3 years could yield significant positive returns, though marginal returns are showing a decreasing trend.
- Key Elements:
- Bitcoin's price has fallen 50% from its all-time high, with the bear market persisting for over 40 weeks; historical cycles indicate that lows typically occur around the 60th week after a peak, pointing to roughly the end of November 2026.
- The 14-week RSI moving average of Bitcoin relative to the Nasdaq 100 stands at 72.6, the highest oversold level in history. The RSI has exceeded 70 only 0.35% of the time historically—a signal that has historically preceded strong performance over the next 1-3 years.
- Bitcoin's RSI relative to Gold hit an all-time high overbought reading (indicating Bitcoin was oversold) in February 2026. This is an extremely rare event that has historically marked long-term price lows for Bitcoin.
- Bitcoin's on-chain realized price is $53,000, 18% below the spot price. Historically, the price has been below this level only 12% of the time; every instance of entering this zone has been followed by significant positive returns over the subsequent 150 weeks.
- The current cycle is the first to incorporate ETF holdings, corporate treasuries, and complex derivatives trading. These structural changes could render historical patterns invalid, warranting caution given the small sample size.
Original article from Blockworks Research
Compiled by Golem, Odaily (@web3_golem)

Key Takeaways:
- Bitcoin is currently 50% down from its all-time high, with the bear market lasting over 40 weeks. A series of long-term cyclical indicators suggest the market may be at or near the bottom in terms of both price and time;
- This month, Bitcoin hit its most oversold level ever against the Nasdaq index, and in February of this year, it also hit its most oversold level ever against gold. Previous instances approaching these extreme levels have typically signaled the emergence of long-term cycle lows and foreshadowed strong performance and positive returns for Bitcoin over the following 1-3 years;
- Bitcoin's realized price (the aggregate on-chain cost basis of the circulating supply) is currently $53,000, 18% below the spot price. Historically, every bear market low has seen Bitcoin's price fall below the realized price. Bitcoin's price has spent only 12% of its history below the realized price. From this point, Bitcoin has delivered substantial returns over 1-3 year timeframes;
- Historical bear market cycles have typically bottomed around week 60 after the all-time high, suggesting the low of this cycle could occur around the end of November 2026;
- In summary, the confluence of various factors currently suggests the period from now until December 2026 could represent a highly attractive long-term re-accumulation opportunity for Bitcoin.
Diminishing Returns and the Need for Tactical Investment
Since March 2021, Bitcoin's price has largely been range-bound; against the Nasdaq index, Bitcoin has also been range-bound since November 2017, spanning nearly nine years. Over this extended timeframe, Bitcoin's performance against the equity index has been fairly flat, while its volatility remains significantly higher. On a risk-adjusted basis, Bitcoin has underperformed the equity index.
This backdrop is crucial for how Bitcoin is held. As Bitcoin's price rises and falls, its marginal returns are diminishing. The passive, always-long strategy that rewarded holders in past cycles is proving less effective, making it increasingly necessary to tactically increase or decrease Bitcoin exposure to capture excess returns.
To identify these opportunity windows, the indicators presented here are conditional signals that remain "quiet" for the majority of history. Their strongest signals appear in the tails, occurring only a few times per decade.
Currently, these signals have emerged simultaneously, all pointing to the same conclusion: Bitcoin is likely at or near the long-term cyclical price low.
Indicator One: Nasdaq/Bitcoin Relative Strength Signal
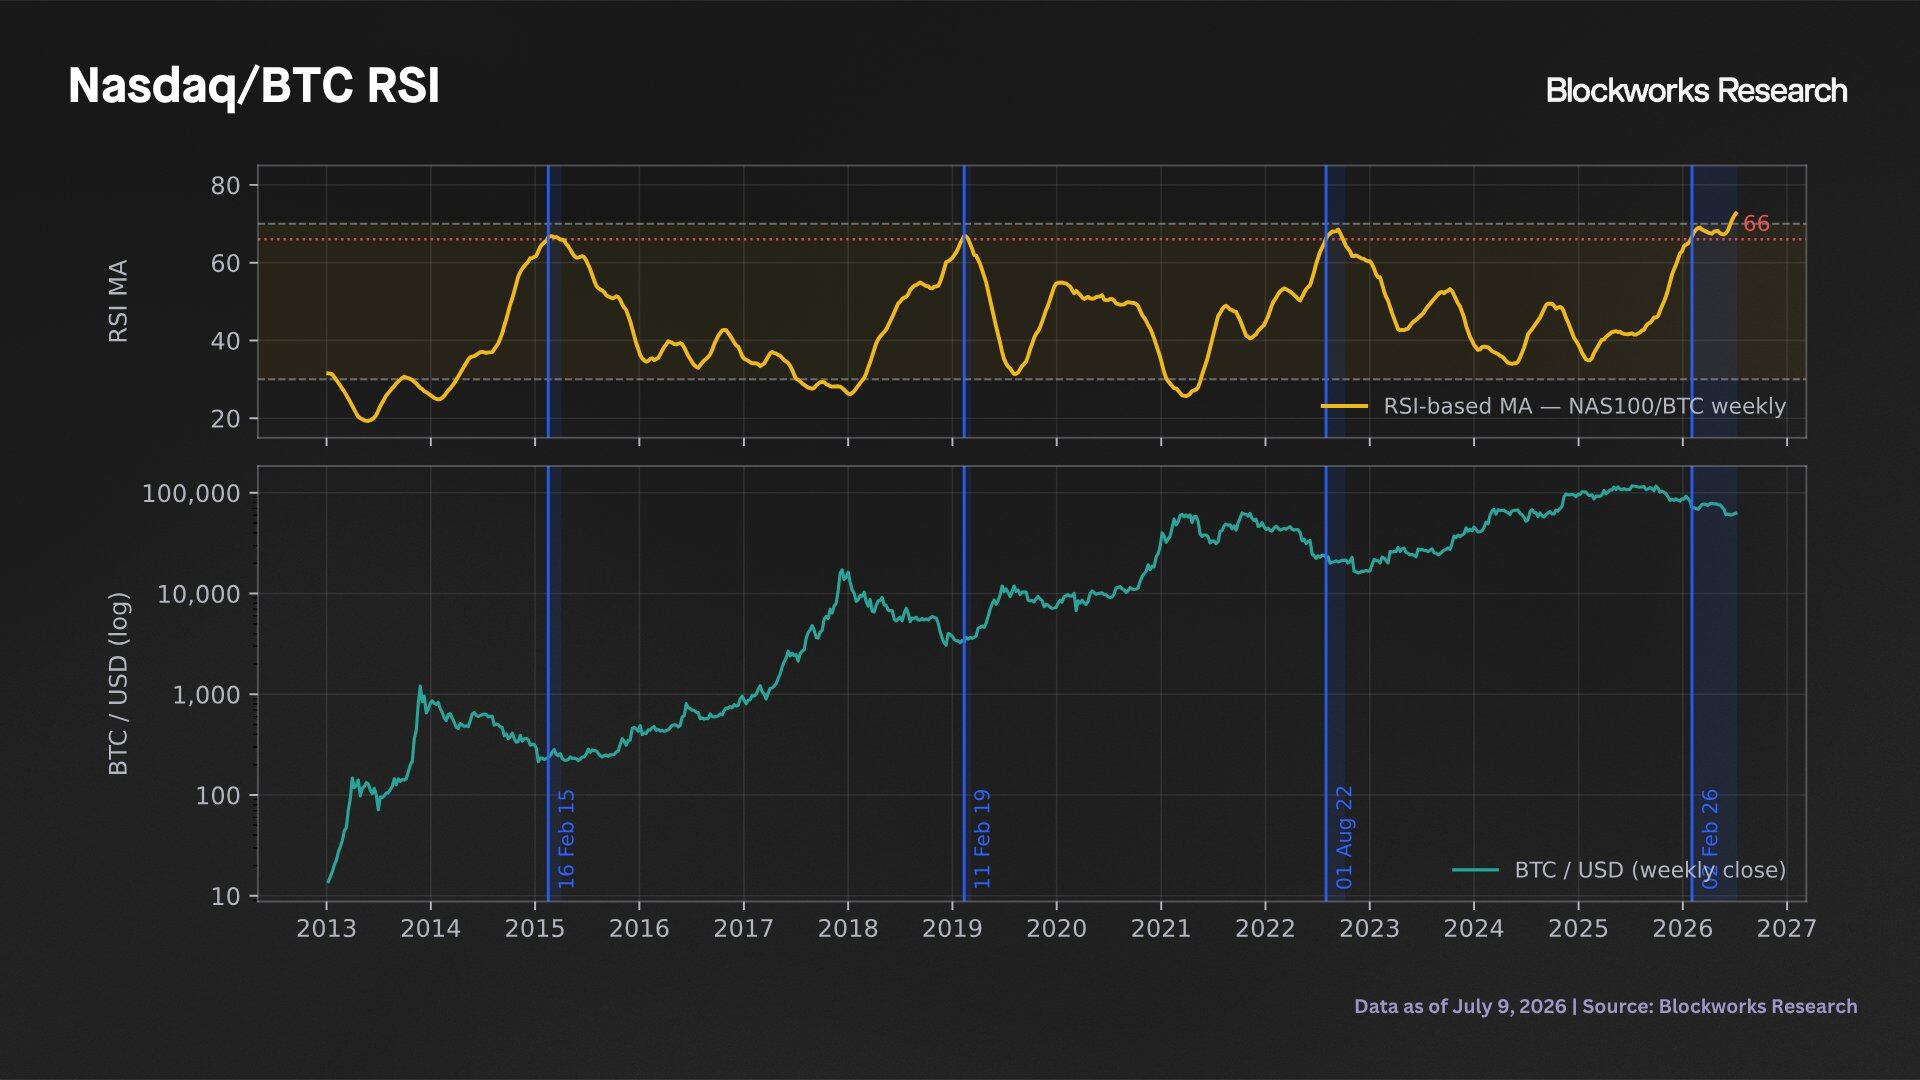
The first signal is based on the ratio of the Nasdaq 100 index to Bitcoin, calculated using weekly closing prices over the past 875 periods. We compute the 14-period Relative Strength Index (RSI) of this ratio and smooth it using a 14-period simple moving average.
A rising RSI indicates the Nasdaq is overbought relative to Bitcoin; a falling RSI indicates the opposite. This metric is not an intraday trading tool. It is a 14-week moving average of the 14-week oscillator, with its overbought and oversold transitions occurring over multi-year market cycles, not days or weeks.
Nasdaq/BTC RSI
Nasdaq relative overbought conditions are rare events. The RSI moving average has been above 65 for only 5.78% of its history and above 70 for only 0.35% of its history. These thresholds have been breached in only four periods: February 2015, February 2019, August 2022, and the period starting in late January 2026 that continues to the present.
The current reading needs to be analyzed from three aspects:
- First, the current level of 72.6 is at an all-time high, 4.1 points above the previous high of 68.5 set in September 2022. All readings above 70 have occurred within the past month;
- Second, this current cycle has lasted 24 weeks, setting a record for the longest duration, far exceeding the 11 weeks in 2015, 4 weeks in 2019, and 10 weeks in 2022;
- Third, having occurred only four times in 16 years, this situation represents one of the rarest phenomena for this indicator. By this measure, the Nasdaq index is the most overbought it has ever been against Bitcoin, which conversely means that, viewed through a longer time frame, Bitcoin is the most oversold it has ever been against the Nasdaq index.
Indicator Two: Long-Term Expected Returns
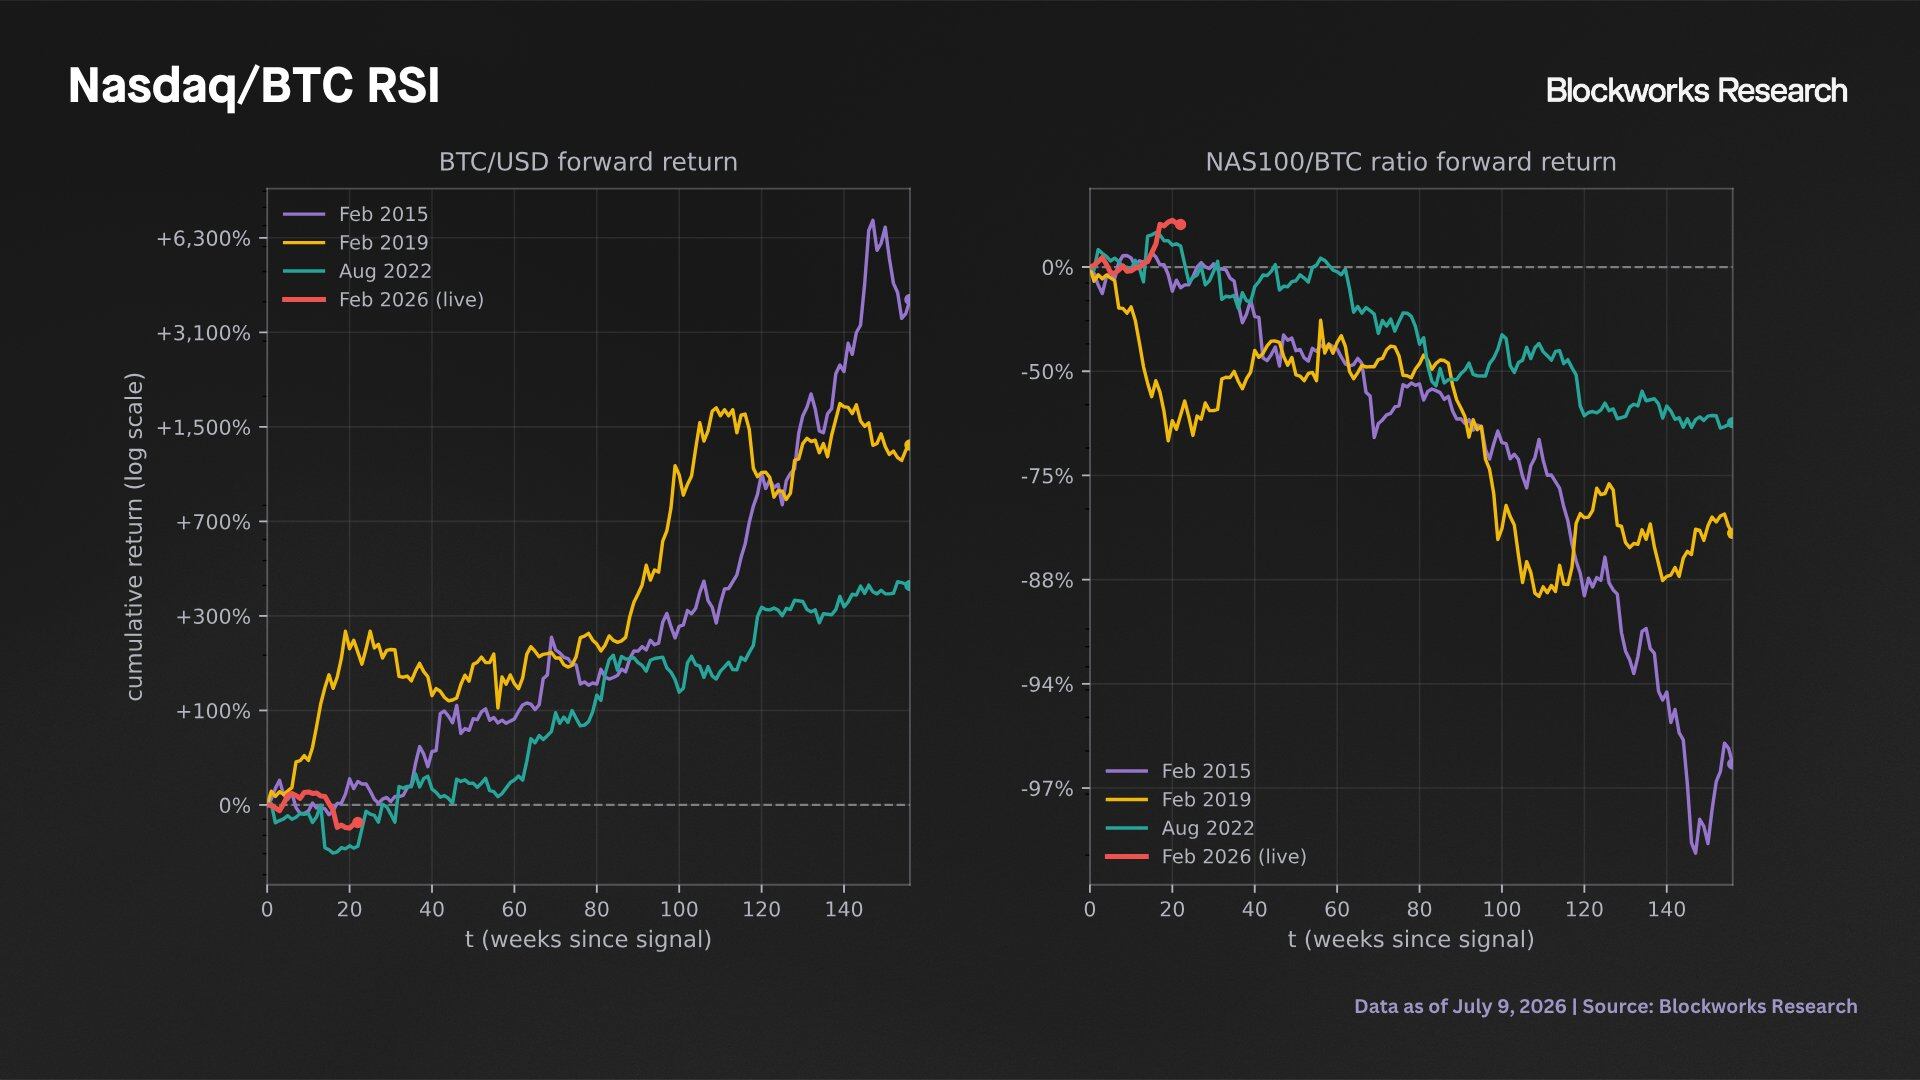
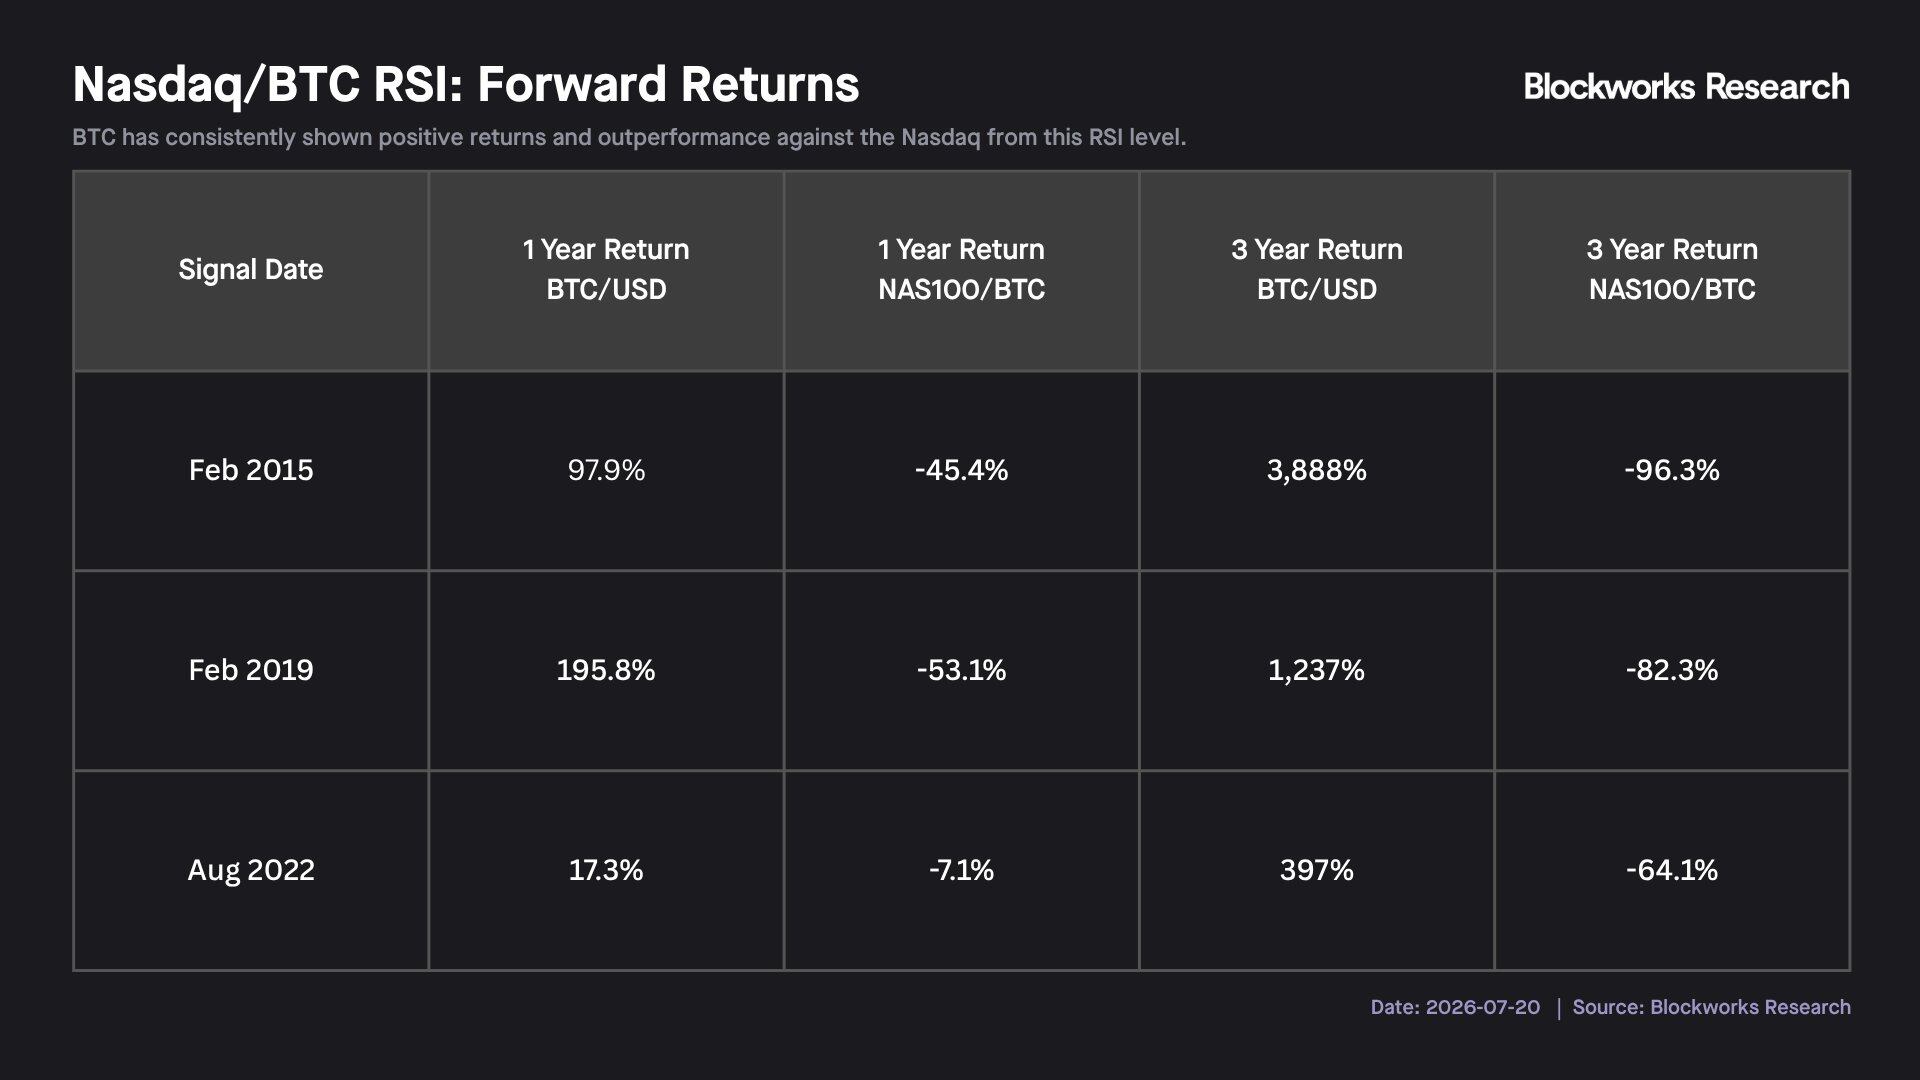
Marked by each instance where the Nasdaq/Bitcoin RSI exceeded 66, the expected return profiles for BTC/USD and BTC/NAS100 have shown upward asymmetry in the three completed cycles, but only over longer time horizons.
BTC/USD vs. BTC/NAS100 Expected Return Profile Comparison
Nasdaq/BTC RSI Expected Returns
This table has two important characteristics:
- First is the time horizon. Short-term expected returns hold almost no predictive value, as 30-120 day returns are small and directionally inconsistent. For example, holding Bitcoin in 2022 resulted in a 29.1% decline over 120 days, but a 397% rebound three years later. The relative strength signal offers little indication of price direction over the next one to two quarters.
- Second is the diminishing magnitude of returns. The three-year Bitcoin return in each cycle has been roughly one-quarter to one-third of the previous cycle's return, consistent with the principle of diminishing marginal returns discussed earlier. In all observations, Bitcoin significantly outperformed the Nasdaq index over the subsequent three years.
Indicator Three: Gold/Bitcoin Relative Strength Signal
If the Nasdaq index represents Bitcoin's status as a risk asset, gold represents its status as a monetary store of value.
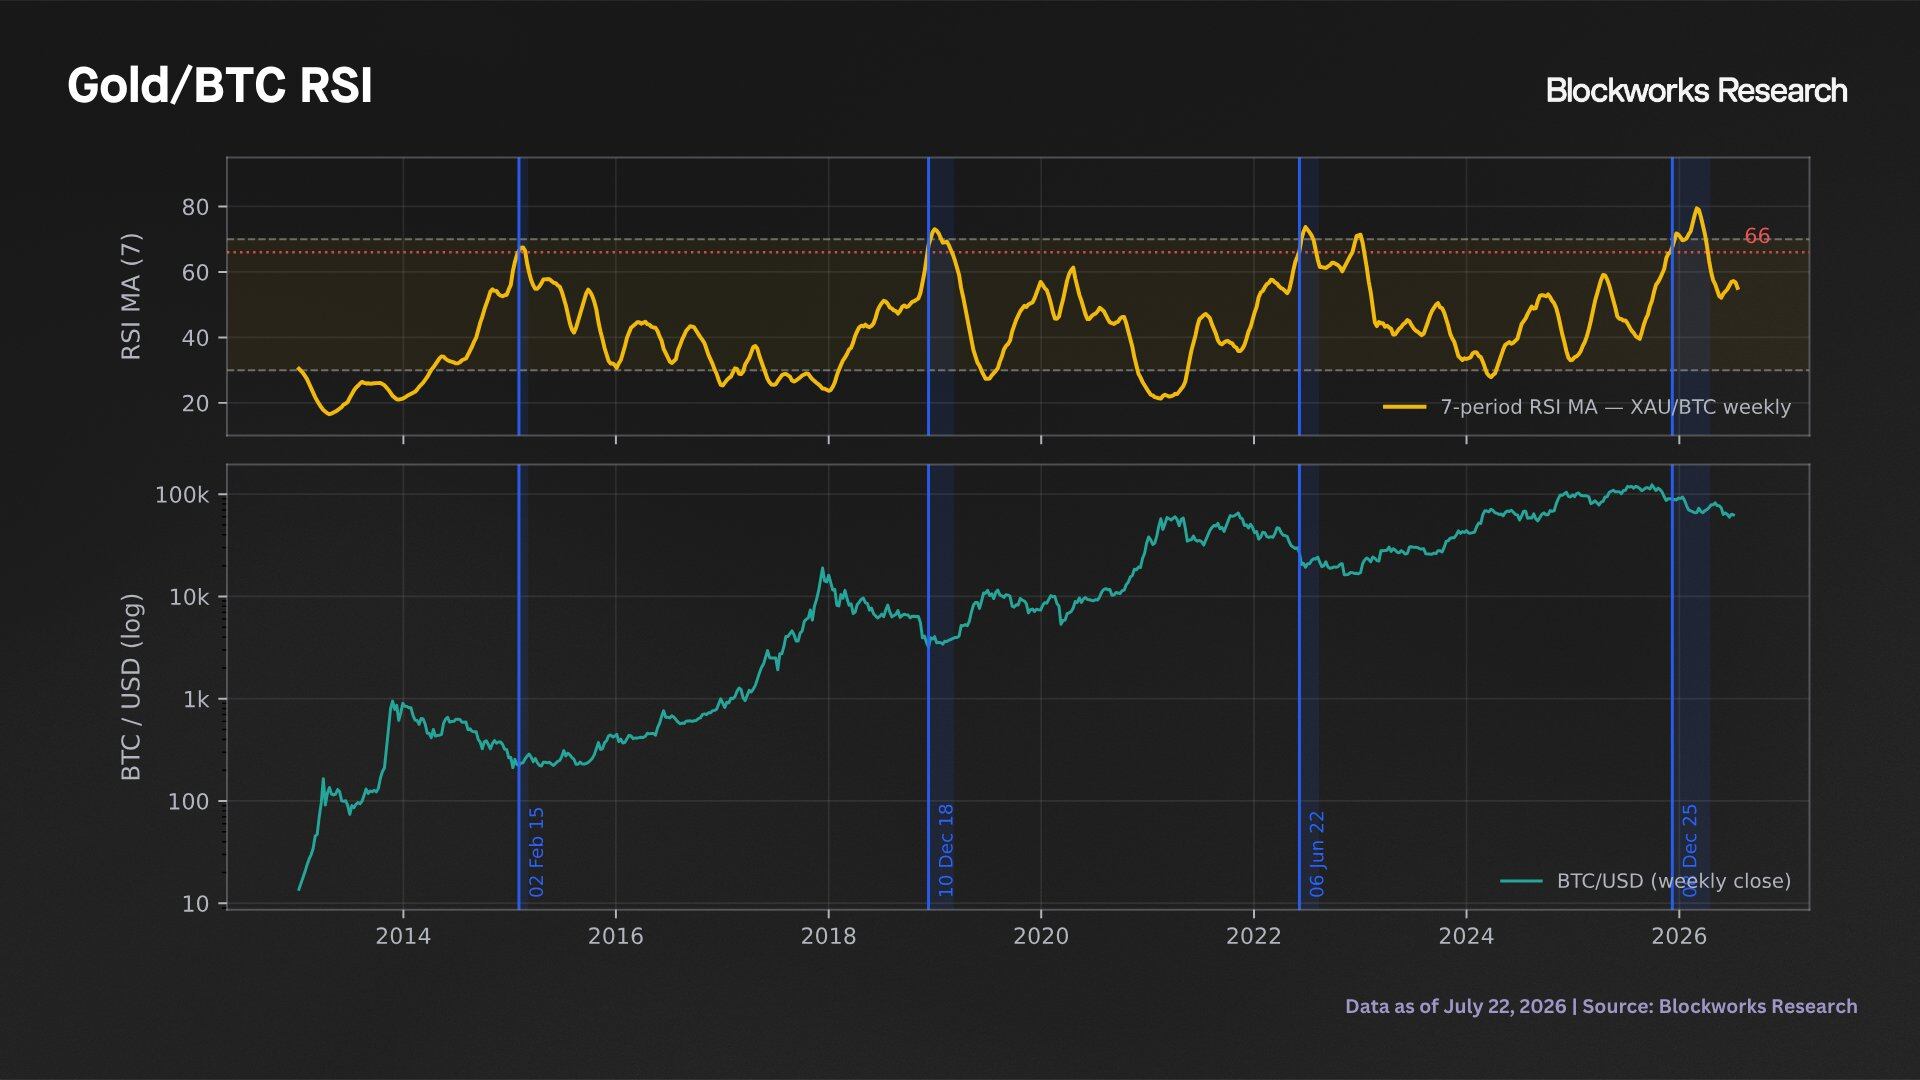
Constructing a similar indicator on the Gold/Bitcoin ratio, we observe analogous data: readings above 66 are rare, exhibit mean-reverting properties, and are clustered around extreme values. According to this metric, February 2026 represents the most overbought period in Gold/Bitcoin history.
Gold/Bitcoin RSI
Elevated RSI readings in this pair coincide with long-term cyclical price lows for Bitcoin, demonstrating a characteristic pattern. The expected return profile for this indicator mirrors the findings from the Nasdaq study. Over a 1-3 year timeframe, given such extreme RSI readings, Bitcoin has historically outperformed both Gold and the US Dollar.
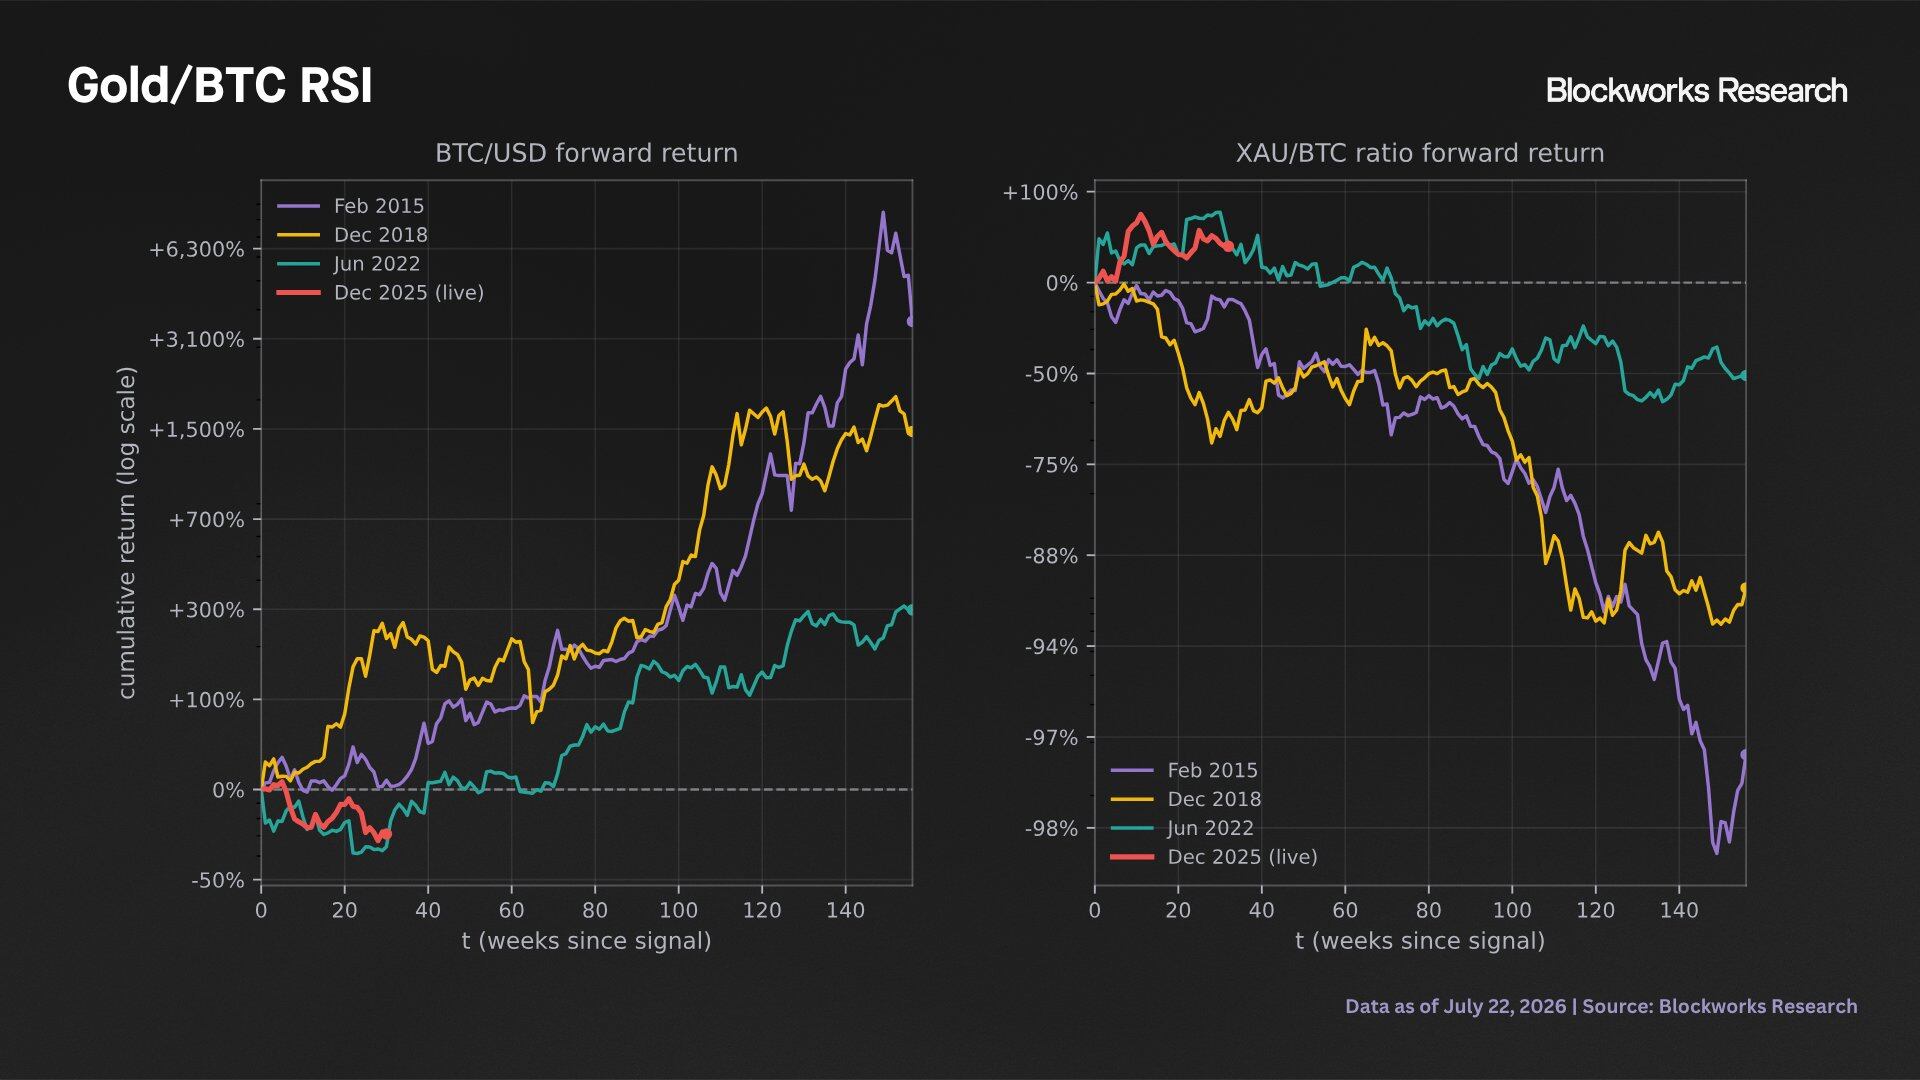
BTC/USD vs. XAU/BTC Expected Return Profile Comparison
Indicator Four: Bitcoin Realized Price (On-Chain Cost Basis)
Bitcoin's realized price estimates the aggregate on-chain cost basis of all Bitcoin in circulation. Unlike the spot price, which reflects Bitcoin's current market value, the realized price measures the average price at which the existing supply last moved on-chain, thereby estimating the on-chain cost basis. Historically, the realized price has represented a deep value level for Bitcoin.
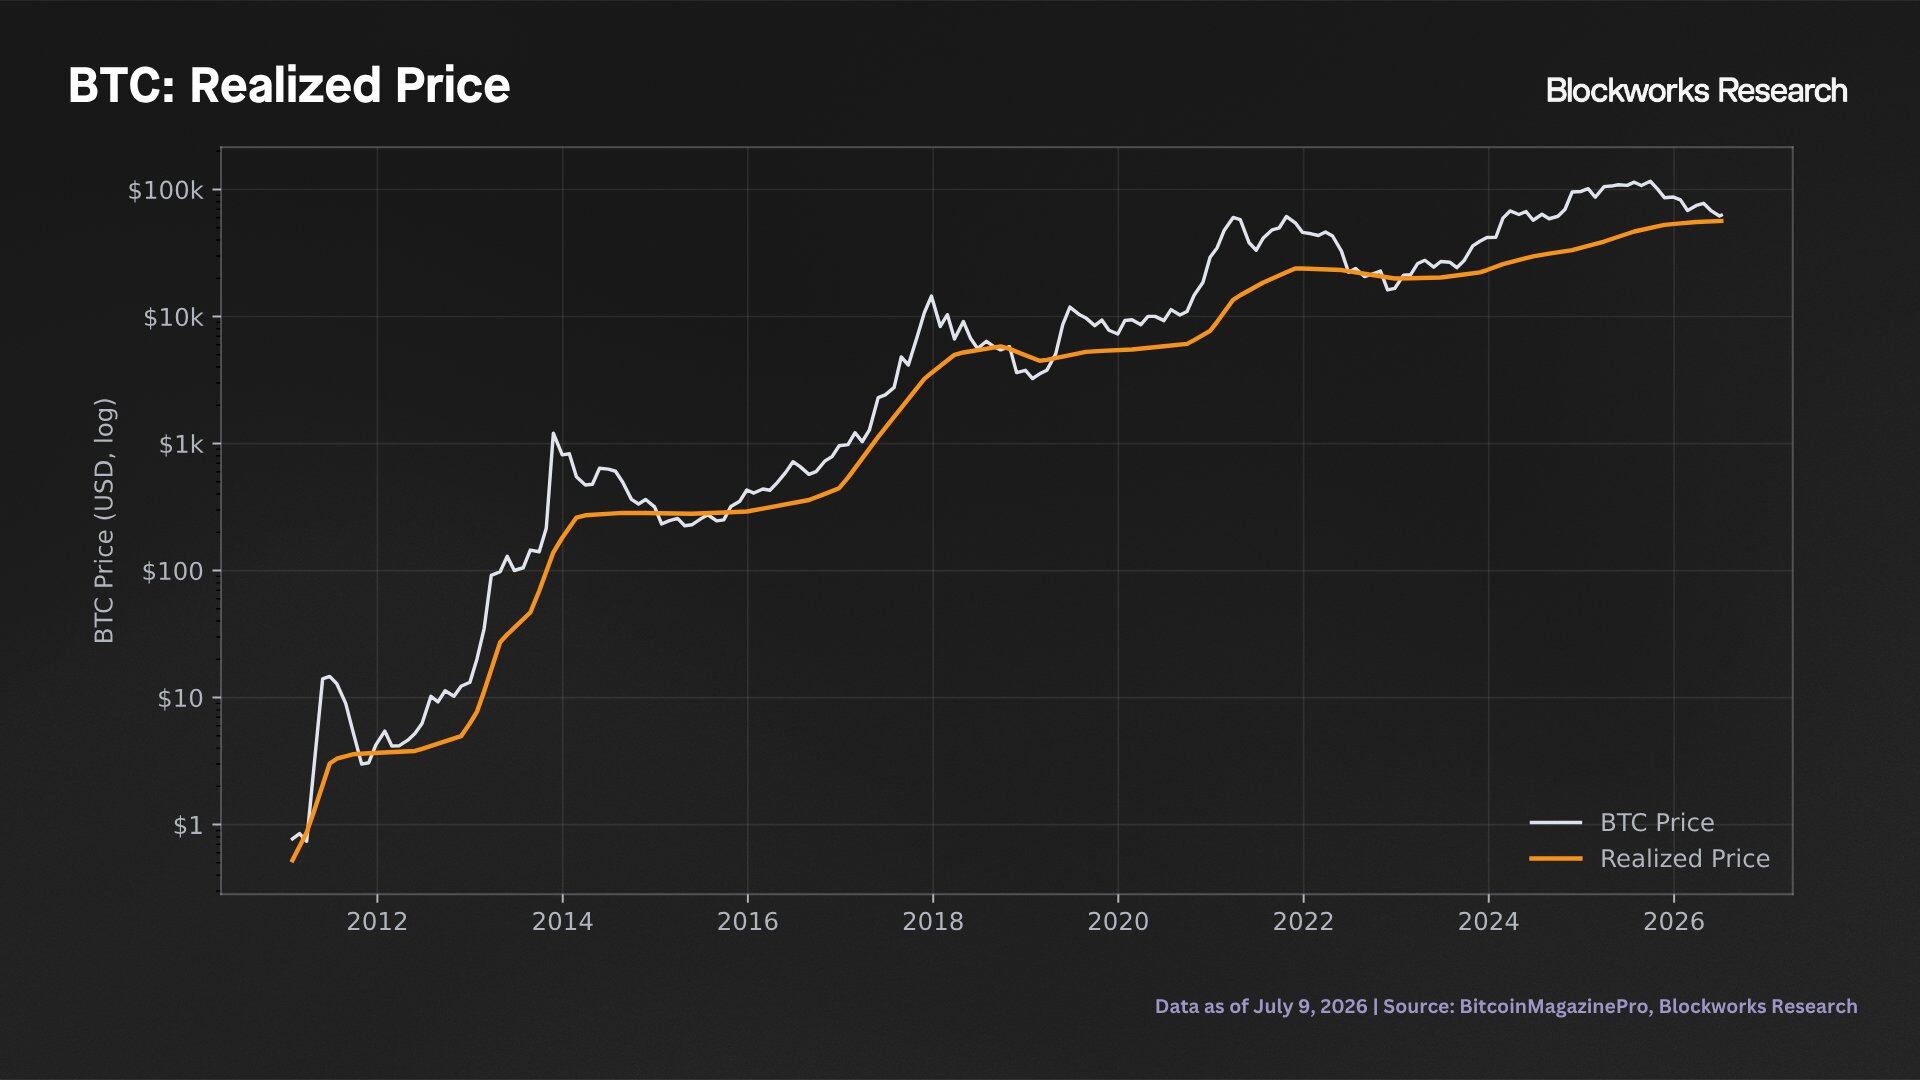
Bitcoin On-Chain Realized Price
The realized price serves as a reference standard, not an absolute floor. Currently, Bitcoin's realized price is $53,000, 18% below the spot price. Bitcoin's spot price has traded below the realized price for only 12% of its history.
Similar to the RSI indicators mentioned above, this situation is a tail-end cycle signal. Historically, every bear market low in Bitcoin's spot price has occurred below the realized price. Furthermore, historically, upon entering this zone, the price has typically declined further before bottoming. Therefore, a drop to or below $53,000 would be consistent with historical patterns, not a deviation from them.
Looking forward from the point of entering this zone, long-term expected returns have been substantial.
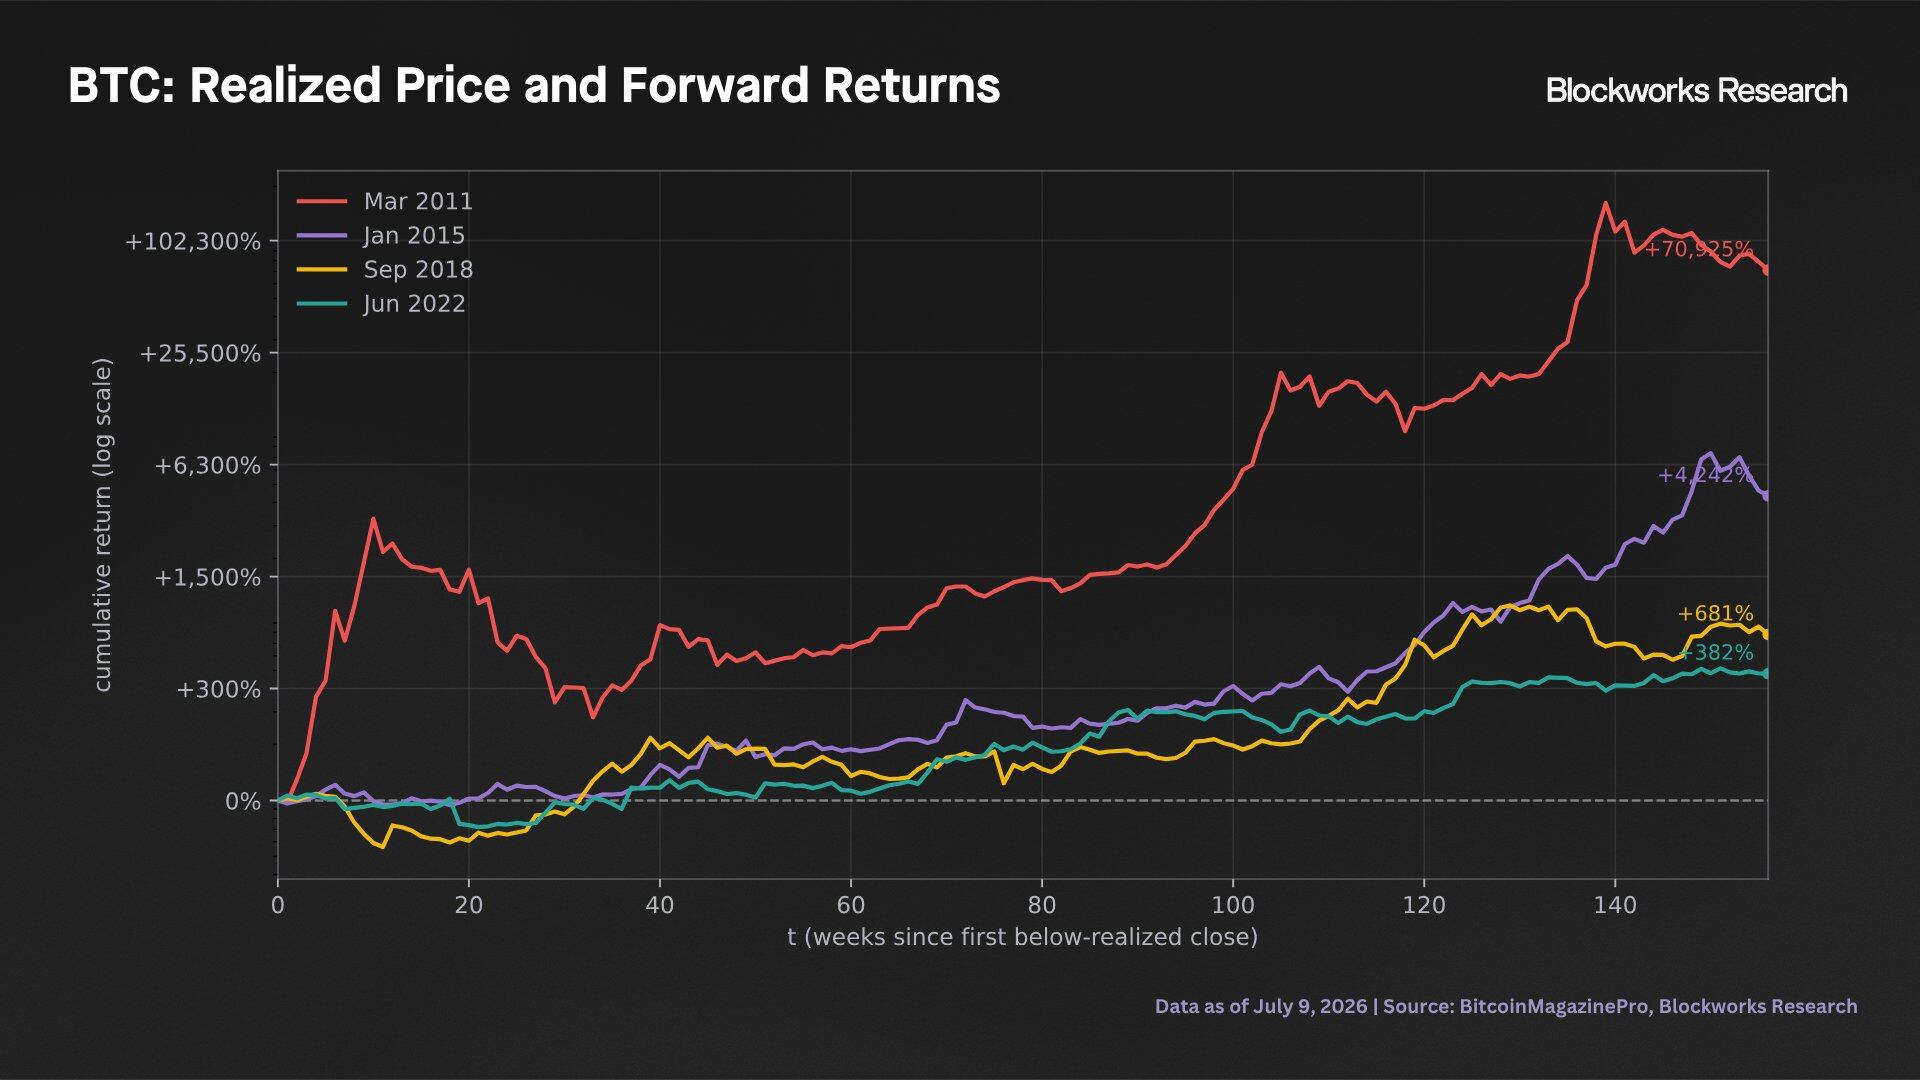
Price Performance After Bitcoin Spot Price Drops Below Realized Price
Calculated from the first weekly close below the realized price in each cycle, historical data shows significant positive returns over the subsequent 150 weeks. The magnitude of these numbers has declined cycle-over-cycle, consistent with the diminishing trend observed in the RSI indicators, but the directional bias remains consistent.
Historically, Bitcoin's first weekly close below the realized price has marked the final phase of a bear market, not the beginning or middle. Nonetheless, the multiple of Bitcoin's spot price to its realized price has dropped significantly from its previous highs around 2025, indicating reduced market risk.
Indicator Five: Cycle Clock
The final indicator is the most straightforward, illustrating the historical structure of Bitcoin bear markets using both price and time as metrics.
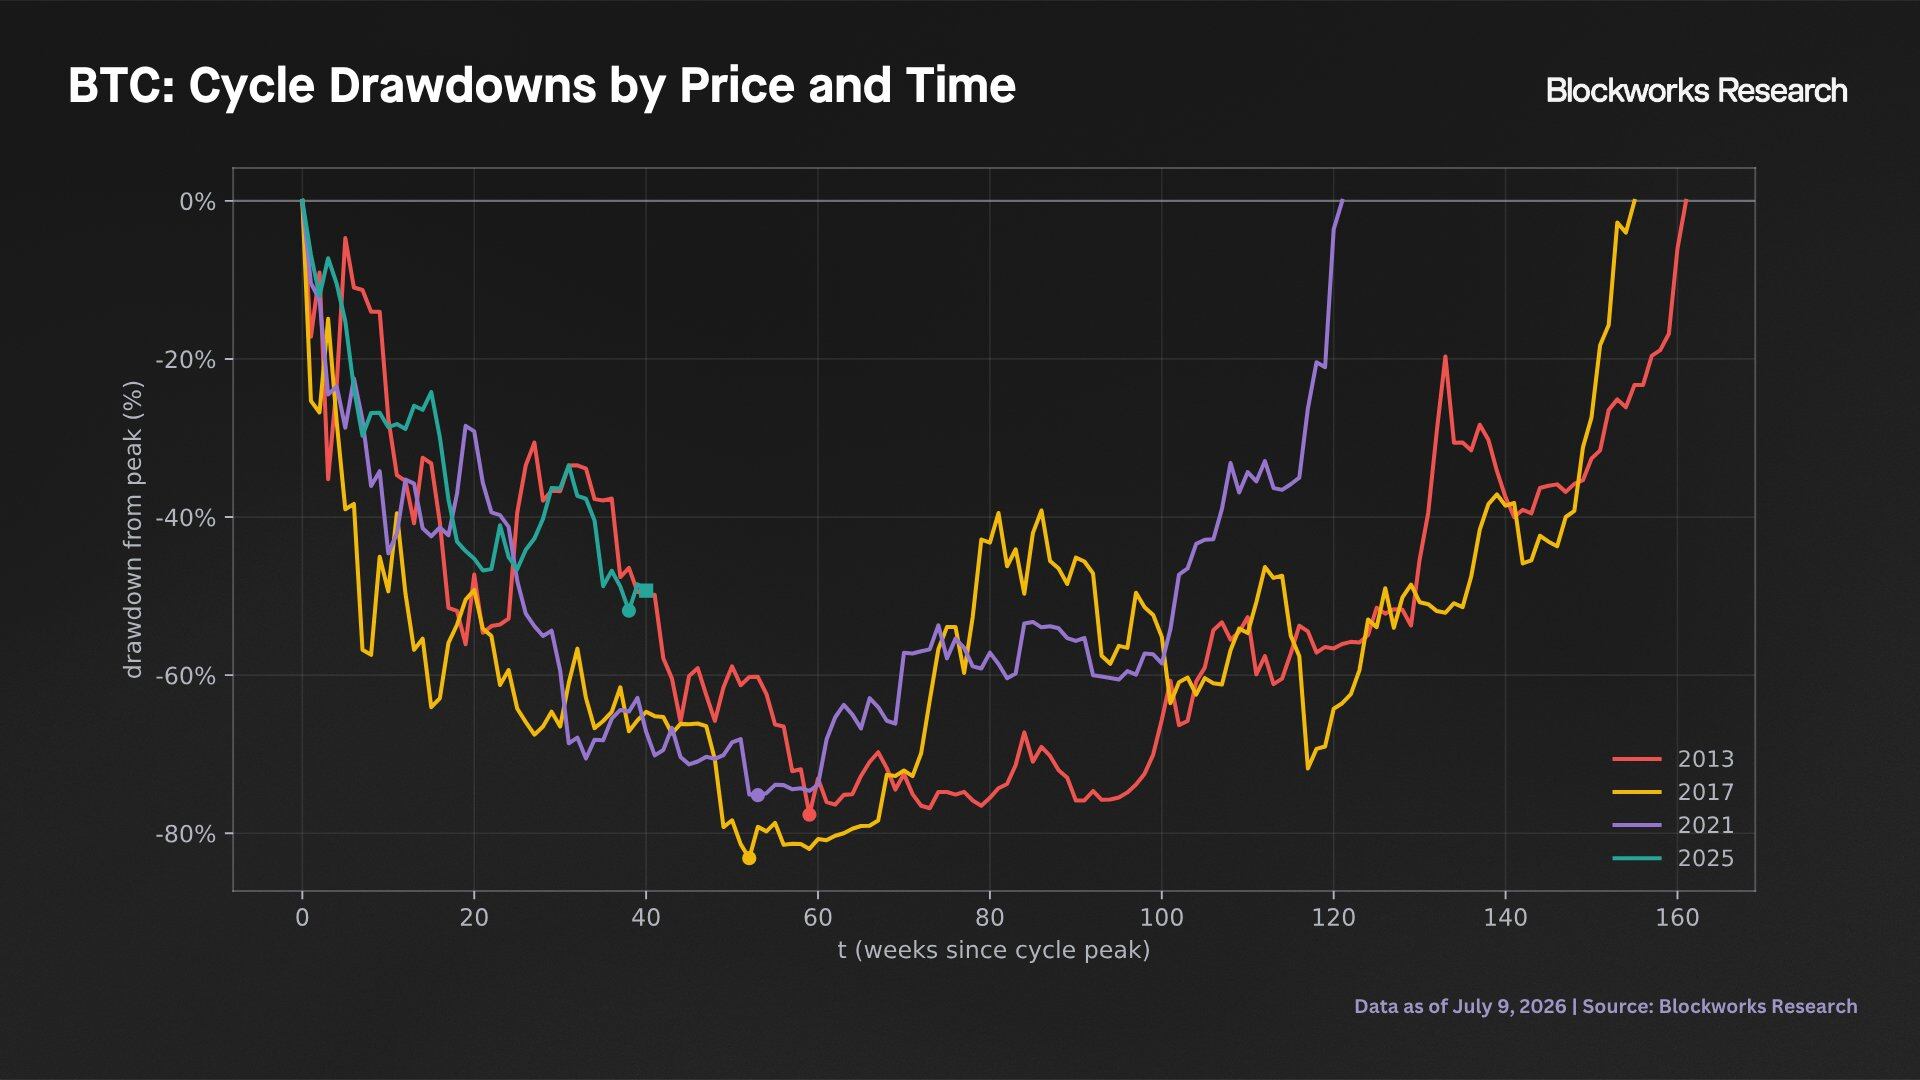
Bitcoin Bear Market Duration
In the cycles of 2013, 2017, and 2021, Bitcoin price lows typically occurred around week 60 after the all-time high. The current cycle is in week 40, with a drawdown of 50%, closely aligning with the trajectory of the previous three cycles. If the week-60 pattern holds, Bitcoin's low would form around the end of November 2026.
Although the RSI for the Nasdaq 100/Bitcoin and Gold/Bitcoin pairs have already shown extreme readings, the drawdown in this cycle remains consistent with historical drawdown paths.
The time dimension also compresses the intervals between cycles, with each cycle reaching new all-time highs in increasingly shorter timeframes. In other words, the time taken to reclaim the previous high is shorter than in the previous cycle. Assuming this trend continues, a new all-time high should occur within 120 weeks of the previous high, implying a new high before February 2028.
These two observations do not inherently contain any mechanism; they are merely empirical regularities observed over a few cycles. They serve as temporal anchor points, overlaying the conditional signals above, and help to bound Bitcoin's remaining downside risk. If the historical structure holds, Bitcoin is approximately 20 weeks away from its low, or may have already bottomed.
Future Trajectory of Bitcoin Price
Given the current situation, the following combination of scenarios, drawing on the background and historical outcomes outlined earlier, depicts a range of potential paths for Bitcoin over the next three years. This is not a prediction or assertion of likely outcomes, but an attempt to answer the question: if the current situation resolves in a manner similar to how analogous situations have resolved in the past, where might the price go?
Assuming diminishing marginal returns on both upside and downside, a discount to the realized price, and referencing historical drawdown paths in price and time, we have constructed possibilities for Bitcoin's price trajectory under these conditions. Each possibility is taken from Bitcoin's three-year performance following a specific signal occurrence and scaled with varying intensities from 0.33 to 0.80 to account for cyclical return compression. The bands in the chart mark the boundaries of historical distributions after applying reduced intensity, not the boundaries of possible market fluctuations.
The shaded areas represent the range of these possibilities.
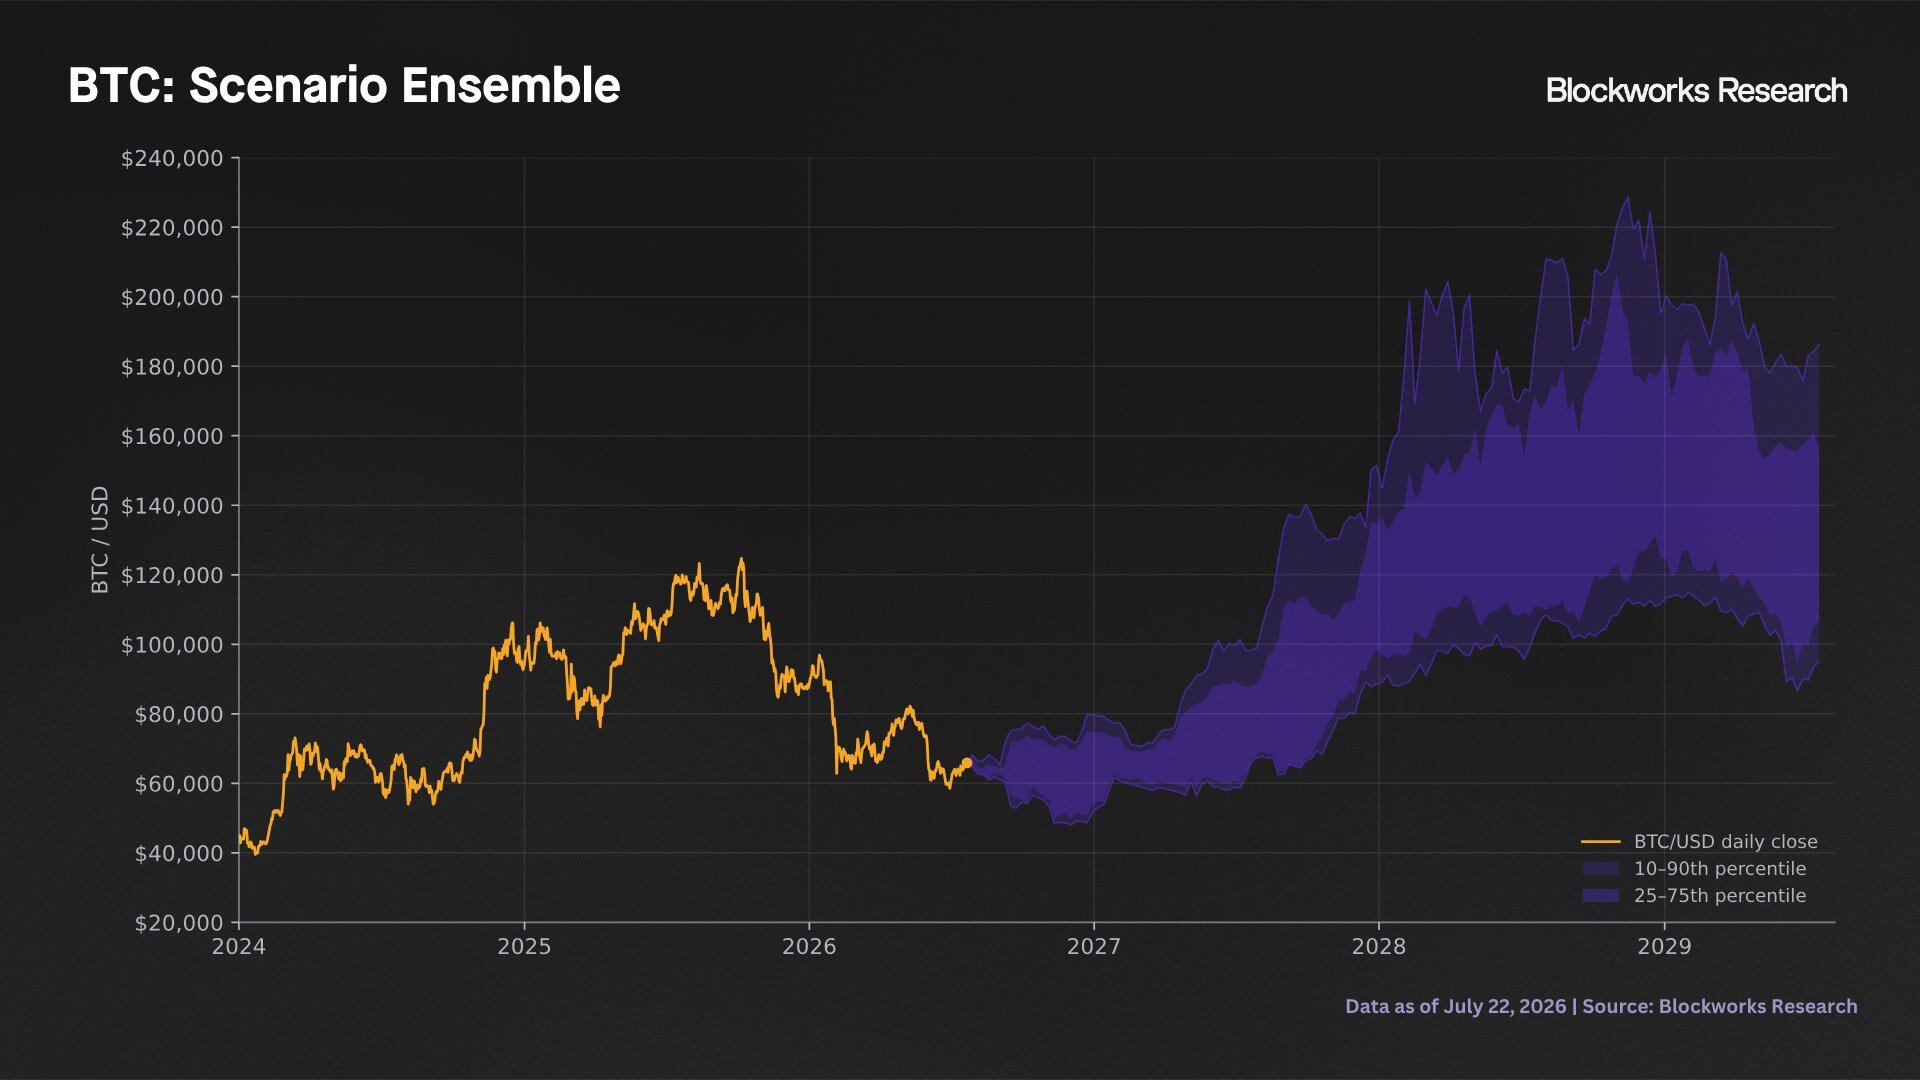
Bitcoin Future Price Trajectory Forecast
These shaded bands represent proportionally scaled recreations of historical paths following signal triggers. All these plausible results are satisfactory; they describe scenarios where history repeats itself, not all possible outcomes, and notably do not include scenarios where the signal fails.
While near-term outcomes towards the end of 2026 are expected to be varied, by 2027 and 2028, the distribution of returns shifts decisively towards a positively skewed and asymmetric upside. Given the current market environment and projected paths, the coming quarters may present a highly compelling opportunity for long-term investment in Bitcoin.
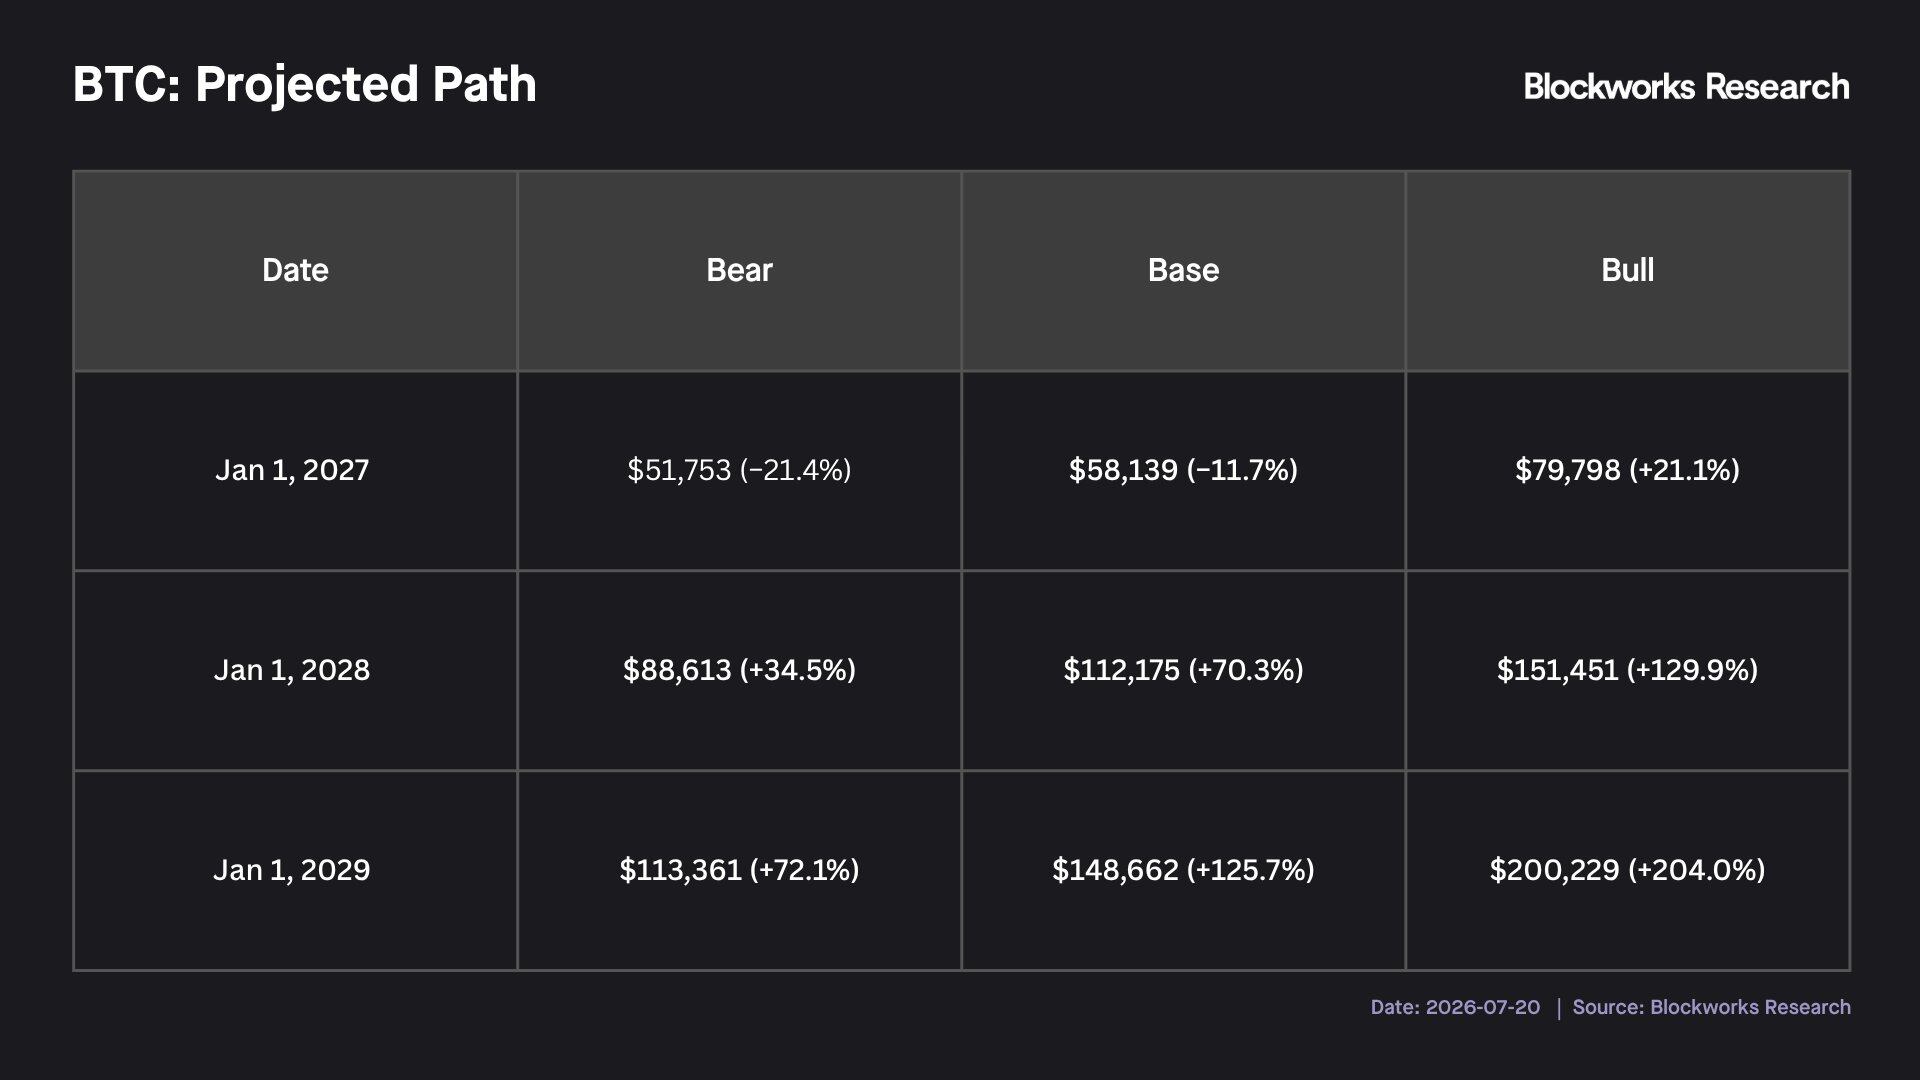
Bitcoin Price Forecast for the Next 3 Years
Risks and Limitations
Each indicator should be evaluated and weighed on its own merits. These indicators should not be interpreted as a mechanism or causation for Bitcoin cycle lows, but rather as manifestations that have historically coincided with, and exhibited characteristics of, long-term cyclical lows.
Furthermore, the indicators listed are not exhaustive of all metrics that could approximate long-term cyclical price lows. The analysis relies on a small sample size. The RSI moving average shows valid samples from four distinct cycles, with one cycle yet to be confirmed; the realized price study is based on four cycles, while the cycle symmetry analysis is based on the three completed cycles. With such a sample size, historical expected return distributions can describe historical trends, but a single cycle's deviation could significantly weaken all presented relationships.
Additionally, the signals presented should not be viewed as independent corroborations. The RSI indicators, proximity to the realized price, and cycle clock position are, to a large extent, different measures of the same underlying fact: Bitcoin has undergone a significant drawdown from its highs and a prolonged decline. In any deep, sustained drawdown, each indicator should trend towards extremes. Therefore, their simultaneous emergence is more akin to measuring the same observation in multiple ways rather than representing several independent and unique observations.
Structural changes may cause this cycle to ultimately diverge. The current cycle is the first to feature ETF holdings, significant corporate treasuries, and more complex derivative markets involving options and perpetual futures. The four-year cycle framework may ultimately prove to be merely a description based on four observations, rather than a persistent characteristic of the asset.
Finally, RSI signals are relative. Bitcoin outperforming the Nasdaq or Gold could mean both assets are rising, or that the two assets are declining at different rates. Even if the RSI signals are favorable for Bitcoin, its nominal price could still be dragged down if equity markets or the price of gold decline from their current highs. The signals presented here offer little predictive power for the near-term moves before November, only reflecting the asymmetry in price performance over the next 1-3 years.
Conclusion
Considering the indicators mentioned above, the conclusion we reach is that Bitcoin is likely at or near its cyclical low. This low could form before the end of the year, to be followed by a resumption of the uptrend.
Each signal is appearing near its historically rare extreme, and previously, each signal has preceded substantial gains for Bitcoin and outperformance against equities over the following years. If the low has not yet occurred, the period between now and that low likely represents a highly attractive zone for long-term re-accumulation of Bitcoin. These signals have remained dormant for the vast majority of history, but they have now flashed a "green light".