
Leverage Wiped Out, Buying Absent: Bitcoin Still Stuck Waiting for the "Final Drop"
- 核心观点:当前比特币市场处于熊市后期深度回调阶段,关键指标显示短期持有者大面积亏损、机构买盘退场,但历史上能催生持续性反弹的终极恐慌抛盘尚未出现,市场筑底仍不完整。
- 关键要素:
- AVIV指数Z值跌至-1.06,处于深度折价区间,表明币价相较周期均值已严重超卖,但低位未出现有效反弹。
- 超95%的短期持有者处于亏损状态,STH-MVRV指标显示新入投资者平均浮亏17%至19%,市场结构脆弱。
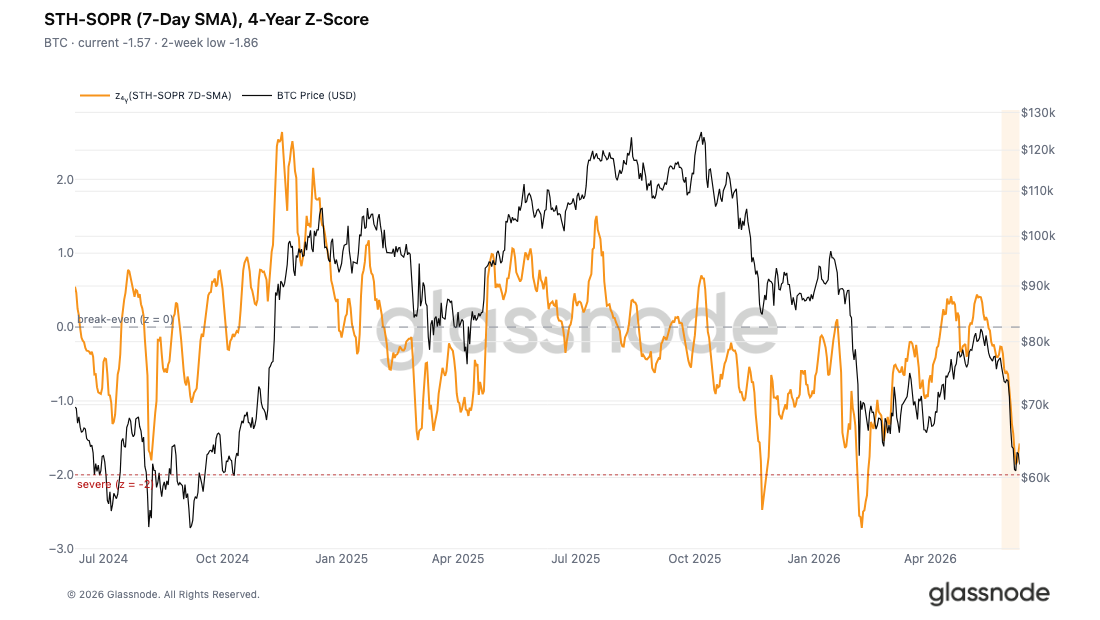
- STH-SOPR Z值最低触及-1.86,逼近-2的深度恐慌抛盘阈值,短期持有者止损行为加剧,但尚未达到历史筑底水平。
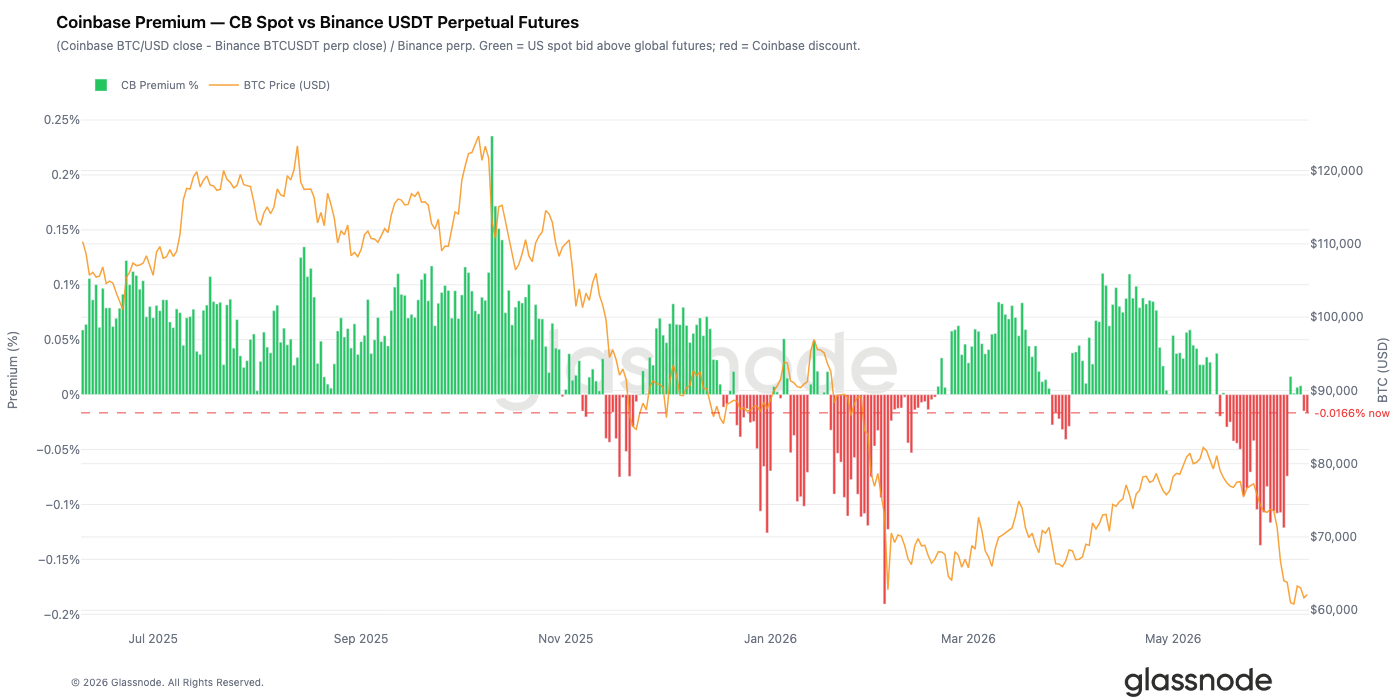
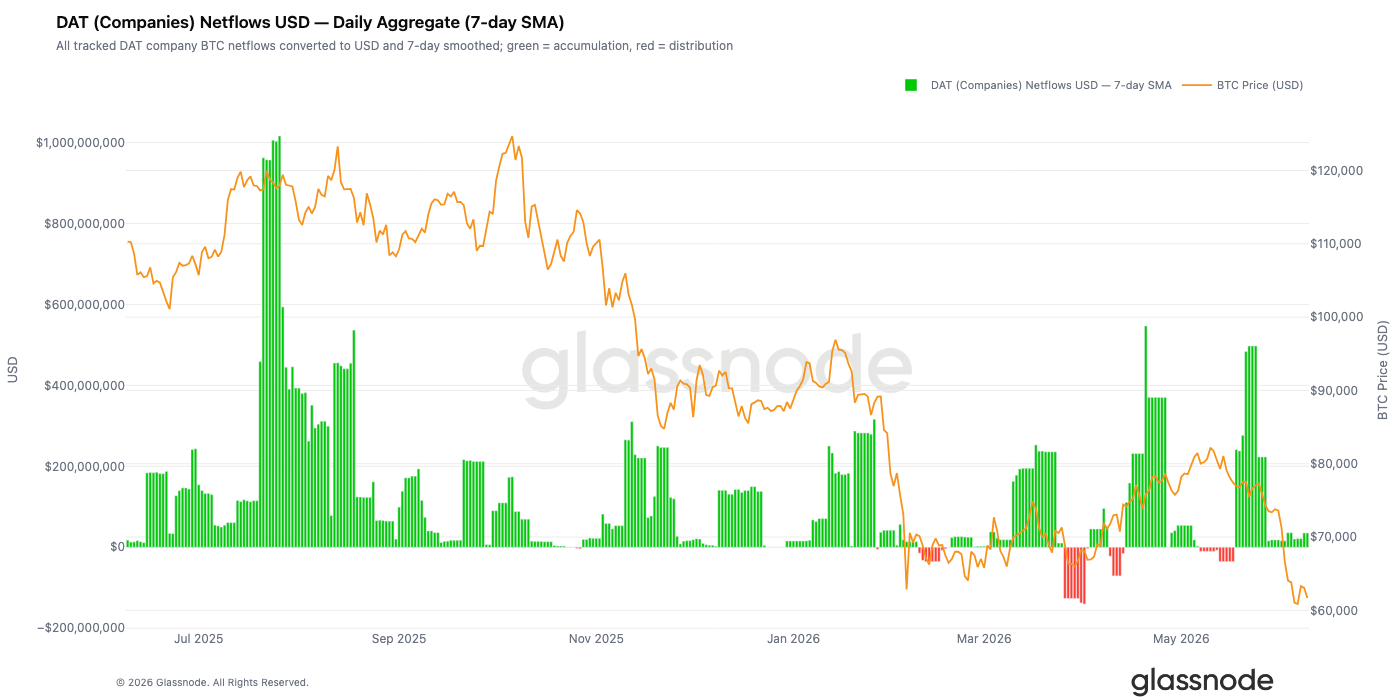
- 美国机构需求显著降温,Coinbase价差持续折价,企业财库比特币增持量从日均超5亿美元回落至接近零,核心买盘力量减弱。
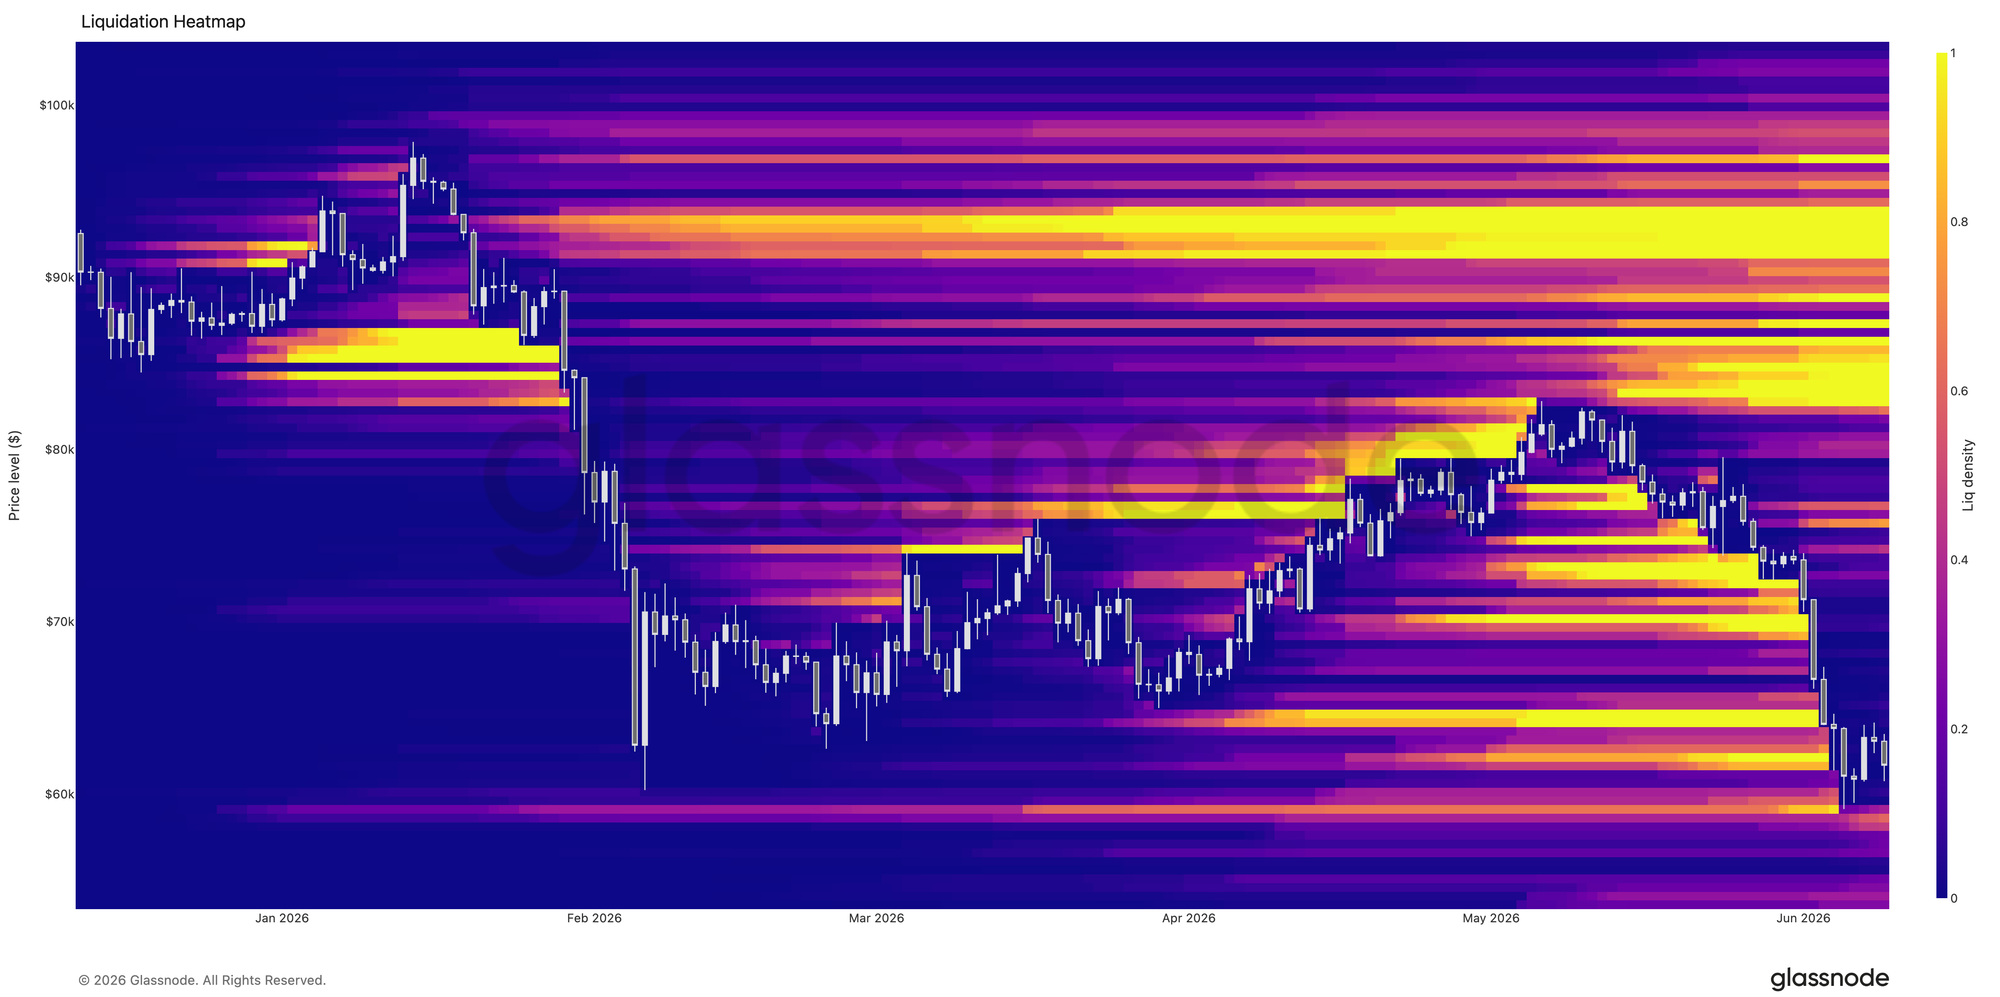
- 比特币跌破7万美元后触发大规模去杠杆,清算热力图显示64000至70000美元区间的多头头寸被集中出清。
- 隐含波动率大幅上行,波动率风险溢价维持高位,期权市场定价的未来不确定性远超近期实际波动风险。
- 全期限25Delta波动率偏斜指标飙升,市场集中布局下行保护,做市商最大负gamma敞口位于65000美元附近。
Original Authors: Chris Beamish, CryptoVizArt, Antoine Colpaert, Glassnode
Original Translation: Chopper, Foresight News
TL;DR:
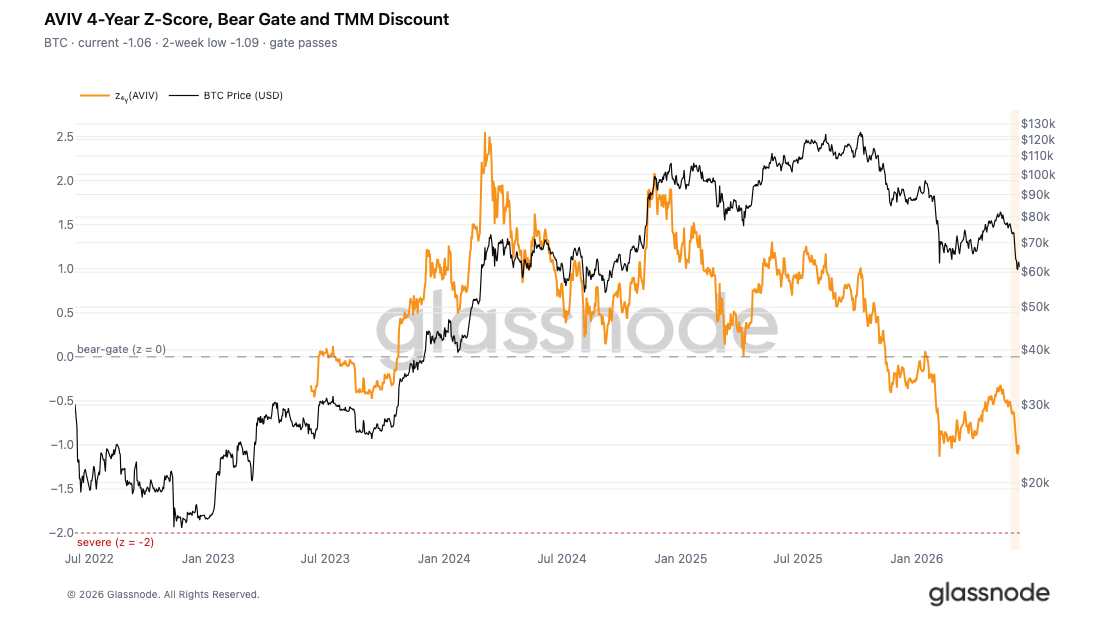
- The AVIV Z-Score fell to -1.09 before retreating to -1.06, indicating that the current price has entered a deeply oversold territory relative to the cycle's mean. The low price failed to trigger an effective rebound, and market panic continues to spread.
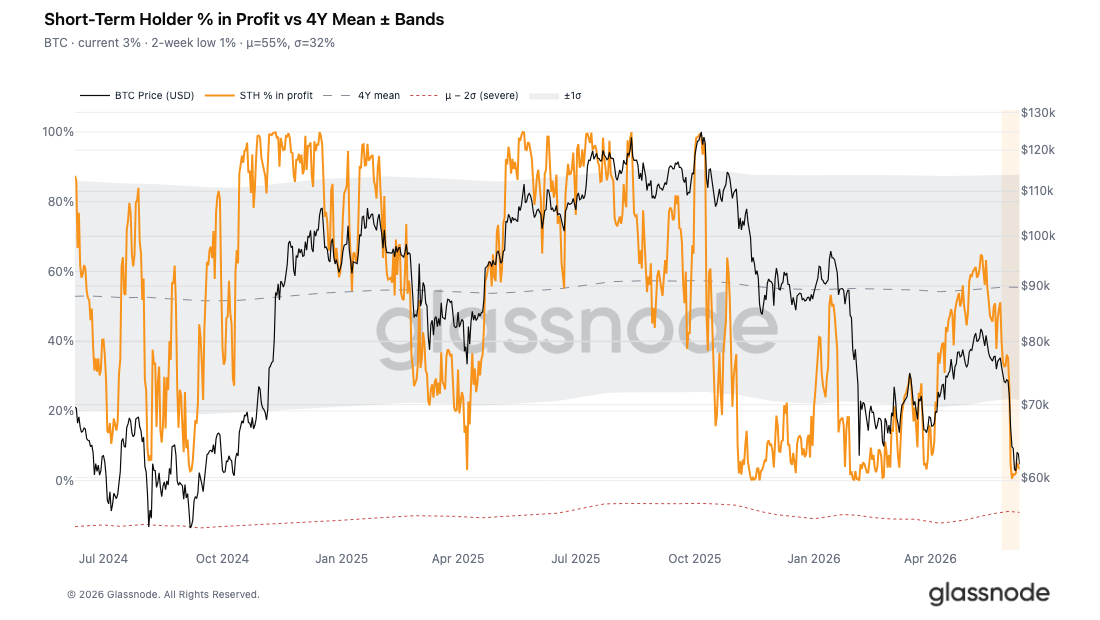
- Over 95% of short-term holders are in a loss position. The proportion of profitable supply held by short-term holders has only slightly recovered to 3.3%, far below the four-year average of 55%. The market fundamentals are fragile and highly susceptible to external shocks.
- The Short-Term Holder Spent Output Profit Ratio (STH-SOPR) Z-Score dipped to a low of -1.86, just 0.14 standard deviations away from the critical -2 threshold indicating deep panic selling. This suggests escalating stop-loss behavior in the market, but it has not yet reached historical levels of selling pressure that have preceded sustained rebounds.
- Institutional demand from the US has significantly cooled. During Bitcoin's decline to $60,000, the Coinbase Premium has remained in a persistent discount, indicating a lack of active institutional buying on the spot market.
- The pace of Bitcoin accumulation by corporate treasuries has slowed dramatically. Since June, daily net purchases have fallen from a peak of over $500 million to near zero, removing another major source of market support.
- After Bitcoin broke below a key support level, the market experienced a significant deleveraging event, with a concentrated liquidation of long-leveraged positions, clearing out excessive speculative positions.
- Implied volatility surged after Bitcoin broke its range. The volatility risk premium (VRP) has remained elevated, suggesting that the uncertainty priced into the options market far exceeds the risks implied by recent spot price movements.
- Volatility skew across all maturities spiked, indicating a sharp increase in demand for downside protection instruments, with traders paying higher premiums for put options.
- Market trading is predominantly defensive. The largest negative gamma exposure is concentrated near $65,000, a price level not far from the current spot price.
Macro Market Insights
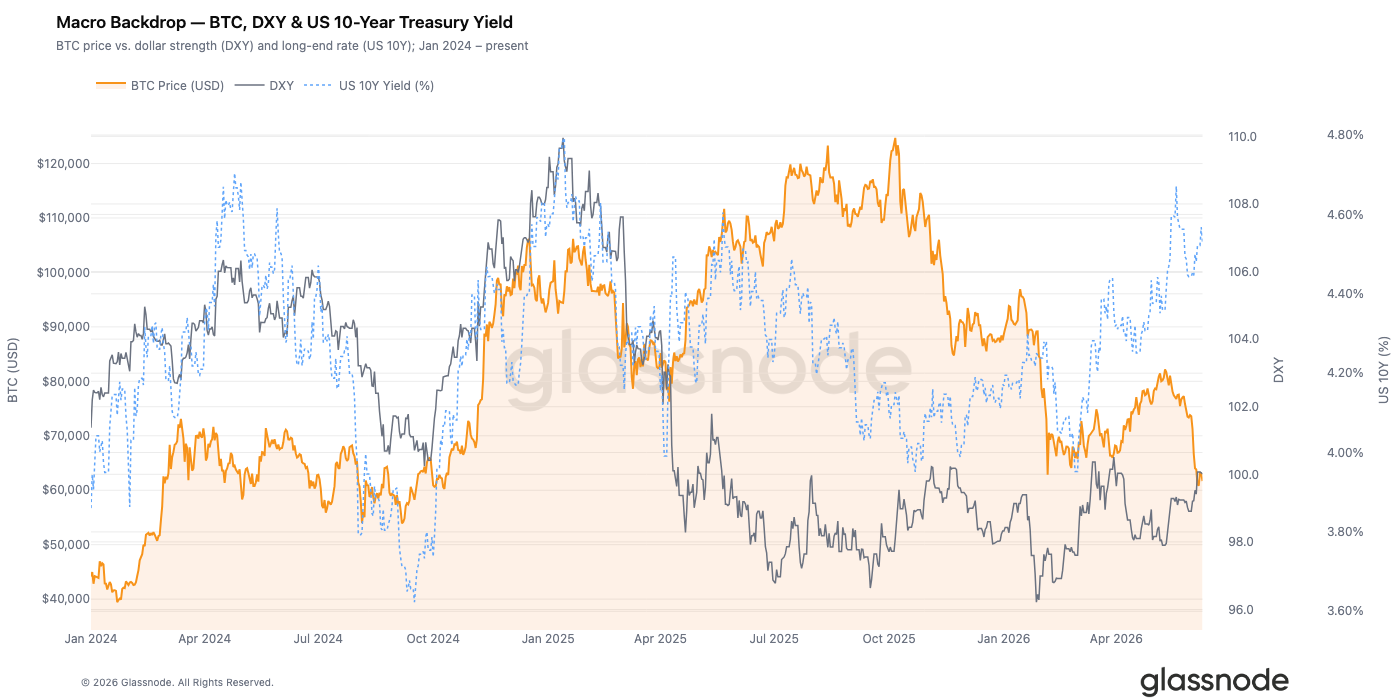
The US Dollar Index closed at 100.01, rising 0.8% for the week and 2.1% over the past thirty days. The ongoing strength of the US dollar implies a tightening of global liquidity over the past month. The US 10-year Treasury yield remained at 4.53%, while the 2-year yield was 4.14%, resulting in a 10-2 year spread of 0.39%. The shape of the yield curve suggests the US economy is in the late-cycle phase, with the Federal Reserve yet to implement substantial changes in monetary policy.
Due to these macroeconomic headwinds, Bitcoin fell 7.5% this week to $61,700. After a period of divergence, the negative correlation between 'a stronger dollar and weaker crypto assets' seen during 2022-2023 has re-emerged. Historically, the combination of the Dollar Index holding above 100 and the 10-year yield breaking above 4.5% typically compresses the speculative premium on risk assets.
For Bitcoin to see a sustained rebound, one of two conditions must be met: the Dollar Index needs to break below 99 effectively, or the 10-year Treasury yield needs to fall back near 4.2%. Currently, neither condition has been met.
On-Chain Data Analysis
Deeply Oversold Valuation
Our previous analysis suggested that the May rally was a bear market bounce. For the first time since January 2022, the short-term holder cost basis fell below the True Market Mean Price (TMMP), a signal indicating the market has entered a late-stage bear phase. This report continues by interpreting the subsequent pullback, including the price dip to $59,000 and the fragile sideways consolidation that followed.
We use the Active Investor Value Deviation (AVIV) metric to gauge how far the current price is below the cycle's mean. This metric compares the spot price to the True Market Mean Price (TMMP), which is the average cost basis of active investors (excluding miners). Its four-year Z-Score measures the deviation of the price from this baseline. A Z-Score of 0 is the dividing line between valuation premium and discount.
Currently, the AVIV ratio is 0.80, corresponding to a Z-Score of -1.06, with a low of -1.09 over the past two weeks. The current valuation is in a deeply discounted region within the historical range. The price's failure to stage a meaningful rebound at the cycle lows over the past week confirms the persistence of market panic.
New Entrants Are Fully Underwater
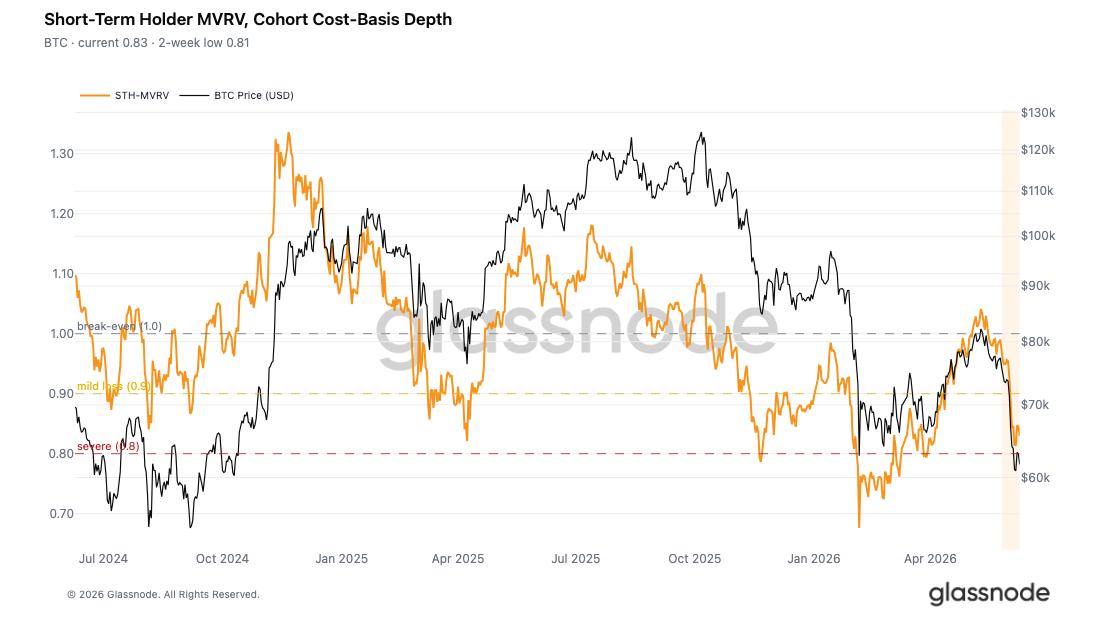
Combining the market-wide discounted state, we analyze the situation of recent capital inflows separately. The Short-Term Holder Market Value to Realized Value (STH-MVRV) ratio compares the spot price to the cost basis of short-term holders. A ratio below 1 indicates that this cohort is, on aggregate, in an unrealized loss position.
This metric recently hit a low of 0.81, before slightly recovering to 0.83. This implies that new investors are sitting on an average unrealized loss of 17% to 19%. It also confirms the analysis from our last report that the dense supply cluster formed between $78,000 and $82,000 during the May rally is now widely underwater.
A brief stabilization of price at low levels is a common pattern in downtrends. After the most heavily underwater investors complete their initial round of passive selling, the remaining market participants enter a 'wait-and-see' mode. Whether this consolidation phase ultimately builds a valid bottom or acts as a continuation pattern depends on whether new buying demand emerges at these price levels.
95% of Short-Term Holders Are at a Loss
To further assess the stress on short-term holders, we examine the percentage of profitable short-term supply. This metric measures the proportion of short-term holders' supply in profit relative to their total supply. It helps gauge the breadth of losses, differentiating it from metrics that solely measure the depth of the loss.
This metric recently bottomed at just 0.6%, before recovering slightly to 3.3%. This is significantly below the four-year average of 55%. In real terms, over 95% of short-term holders are currently at a loss. Historically, this level of distress represents a significant capitulation zone, where widespread stress on new investors creates a fragile market structure highly susceptible to any negative external factor.
The near-universal nature of the losses, coupled with a lack of significant recovery in related metrics, strongly suggests that the current sideways price action is merely a phase of exhausted selling pressure, not a completed market bottoming process.
Market Approaching Panic Selling Threshold
Beyond unrealized loss data, the actual selling behavior of investors further confirms the severity of the current market conditions. We use the Z-Score of the 7-day Simple Moving Average of the Short-Term Holder Spent Output Profit Ratio (STH-SOPR), normalized against its four-year cycle mean, to gauge the intensity of realized losses by new investors in this cycle.
The current Z-Score for this metric is -1.57, with a two-week low of -1.86. This is just 0.14 standard deviations away from the historical threshold of -2, which has previously marked deep panic selling events.
Currently, the pace of loss-taking by short-term holders is accelerating and becoming more frequent. This aligns with the previous report's data showing a single-day total realized loss of $1.35 billion, and the deep unrealized losses indicated by the STH-MVRV mentioned earlier. However, the ultimate panic-selling event typically required to catalyze a medium-term rebound has not yet materialized.
The market is in an awkward intermediate state: the scale of realized losses is sufficient to confirm a deep bear market, but it has not yet reached the standard for thoroughly flushing out selling pressure and building a solid foundation for a bottom.
Off-Chain Market Insights
Coinbase Premium Turns to Persistent Discount
The Coinbase Premium metric measures the price difference between the spot price on Coinbase and the perpetual futures price on Binance. It serves as a significant indicator of US institutional demand. A premium on Coinbase suggests that institutions are actively buying spot Bitcoin, pushing the platform's price higher than the offshore derivatives market.
In recent weeks, the market dynamic has completely reversed, and this premium has remained in a persistent discount. During Bitcoin's decline toward $60,000, buying demand on the US spot market has broadly cooled. The 'buy-the-dip' behavior typically observed during previous corrections has not materialized this time. Institutions are generally adopting a wait-and-see approach, removing another important source of market support.
Corporate Treasury Demand Cools
Between April and May, corporate treasuries were a core source of market support, consistently accumulating Bitcoin, with daily net purchases exceeding $500 million on multiple occasions. However, this demand has weakened markedly since June.
As Bitcoin fell from above $75,000 back to $60,000, the net buying volume from corporate treasuries shrank significantly, with daily accumulation dropping to a fraction of previous levels. While treasuries remain net buyers overall, the reduced pace of accumulation suggests this cohort's risk appetite is turning cautious. In a market environment of overall low sentiment, marginal buying demand has decreased further.
Broad Deleveraging Below $70,000
Liquidation heatmap data shows a concentration of large leveraged long positions in the $64,000 to $70,000 range. Last week's rapid downturn triggered a cascade of long position liquidations within this range, contributing to a brief push of the price below $60,000 before it found some support.
Liquidity for long positions in the current near-term range has been largely exhausted, and the market has undergone a significant deleveraging event. Compared to the data from a week ago, the current leveraged positioning structure is healthier. The large volume of speculative leverage that accumulated within the recent trading range has been largely cleared from the market.
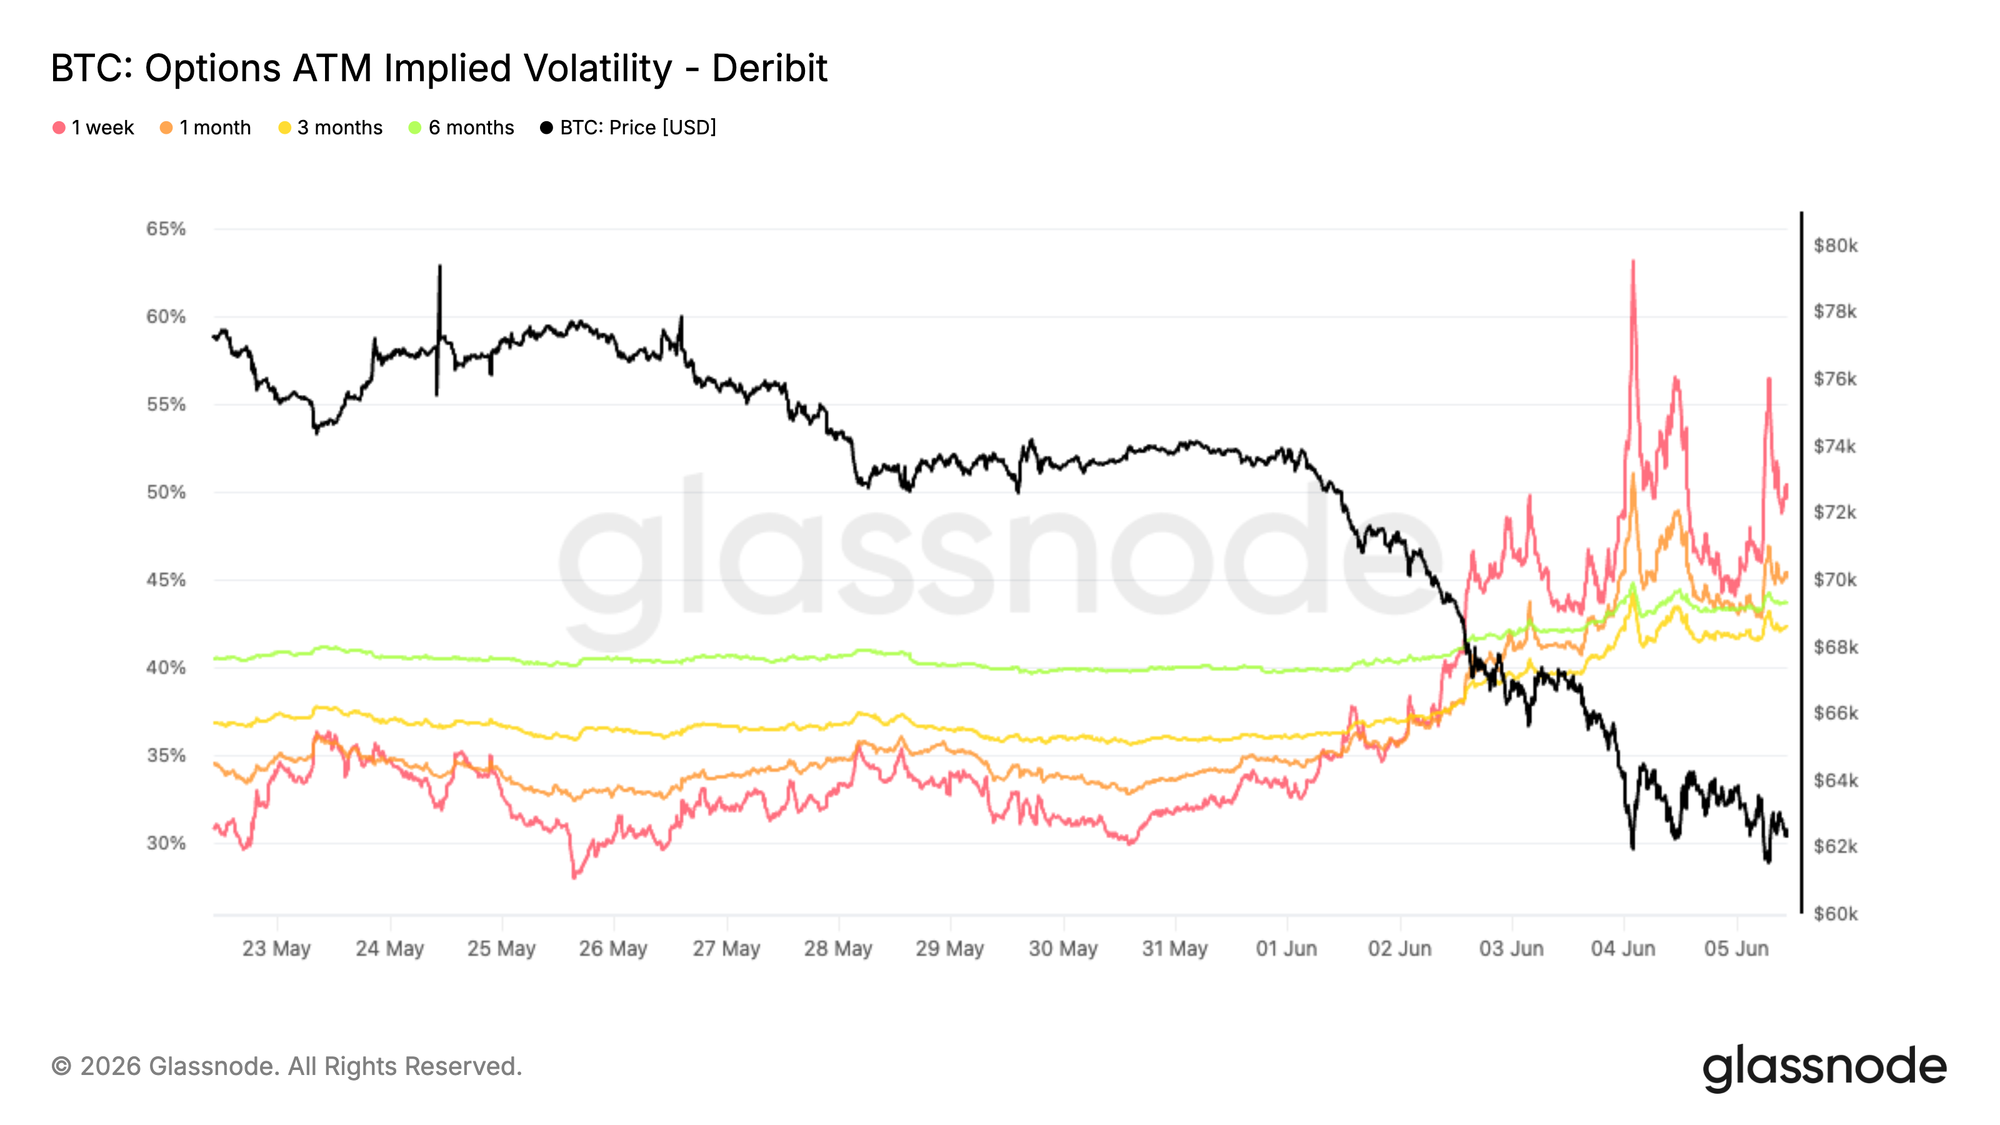
Implied Volatility Surges Higher
After Bitcoin broke its multi-month consolidation range, the entire volatility surface was re-priced. Demand for options instruments rose across the board as the spot price approached February's lows.
The reaction in short-term volatility was most dramatic. Implied volatility for one-week at-the-money options briefly surged above 60% before retreating to around 50%. One-month implied volatility rose from approximately 34% to 45%. Longer-dated tenors also moved higher, with six-month implied volatility rising from around 40% to 44%.
This volatility spike represents a comprehensive reassessment of future uncertainty by the market, not merely a short-term emotional disturbance. Although volatility has retraced from its peak, demand for options hedging instruments remains robust. Even with a tentative stabilization in the spot price, traders are willing to pay a higher cost for risk protection. This downturn has fundamentally reset market expectations for volatility, with hedging costs rising across all maturities and risk aversion remaining elevated.
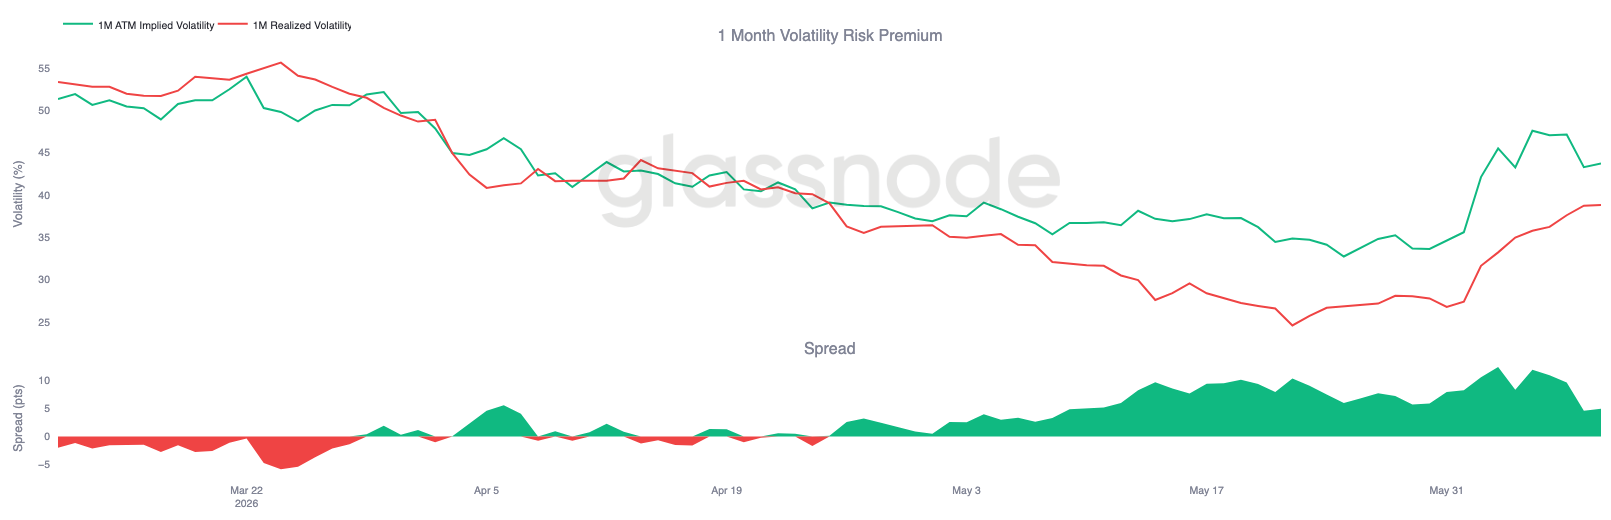
Volatility Risk Premium Remains Elevated
Comparing the surge in implied volatility against realized volatility reveals that the future variance priced into the options market still exceeds the actual near-term fluctuations in the spot market.
One-month implied volatility increased from around 35% to 44%. During this downturn, realized volatility also rose from 27% to 39%. Both metrics moved higher in tandem, but the rise in implied volatility was more aggressive, keeping the Volatility Risk Premium (VRP) positive.
After the price broke below its key support, the market rapidly repriced risk, causing the volatility spread (implied minus realized) to widen to as much as 10 volatility points. Although this spread has narrowed somewhat, option prices remain above the level justified by actual market volatility. This suggests a widespread expectation of continued sharp price swings.
The future uncertainty priced into the options market continues to outweigh the risks implied by recent actual price movements, keeping the volatility risk premium persistently high.
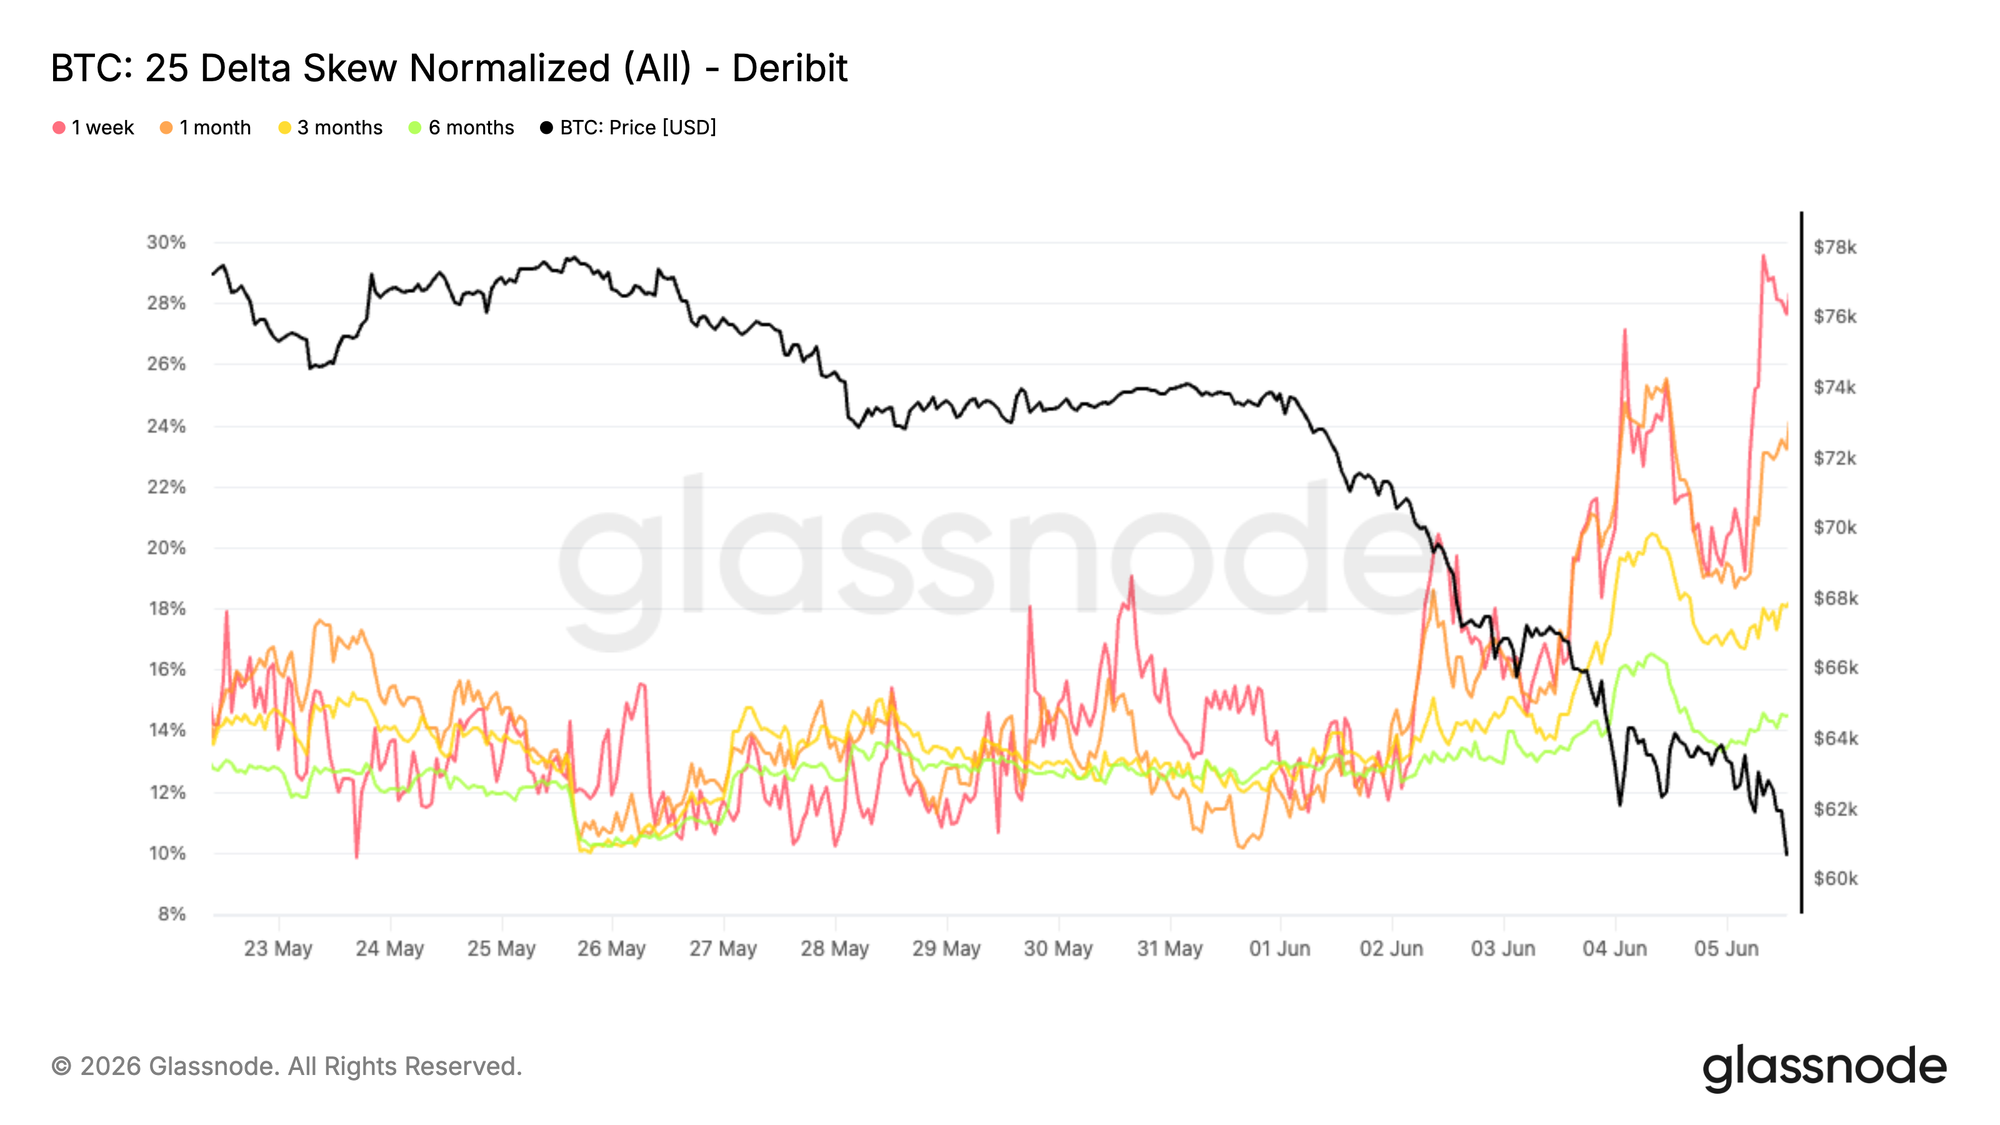
25-Delta Volatility Skew Spikes Higher
While overall volatility premiums rose, the volatility skew metric clearly revealed the directional bias of capital flows. As Bitcoin broke support and probed February's lows, traders concentrated their purchases on downside protection instruments.
Volatility skew is calculated as put option volatility minus call option volatility. A positive value means puts are more expensive than equivalent calls. This downturn caused skew to rise across all tenors: one-month skew jumped from around 11% to 24%, while three-month and six-month skews climbed to 18% and 14%, respectively.
The short-term tenor reacted most intensely, with one-week skew briefly approaching 30%. During the decline, market demand for short-term downside hedges surged. If the rise in implied volatility signaled broad market risk alertness, the volatility skew points decisively in one direction – capital is being allocated predominantly toward downside hedging.
As market conditions continue to weaken, the need for downside protection has significantly increased, driving up the premium traders pay for put options.
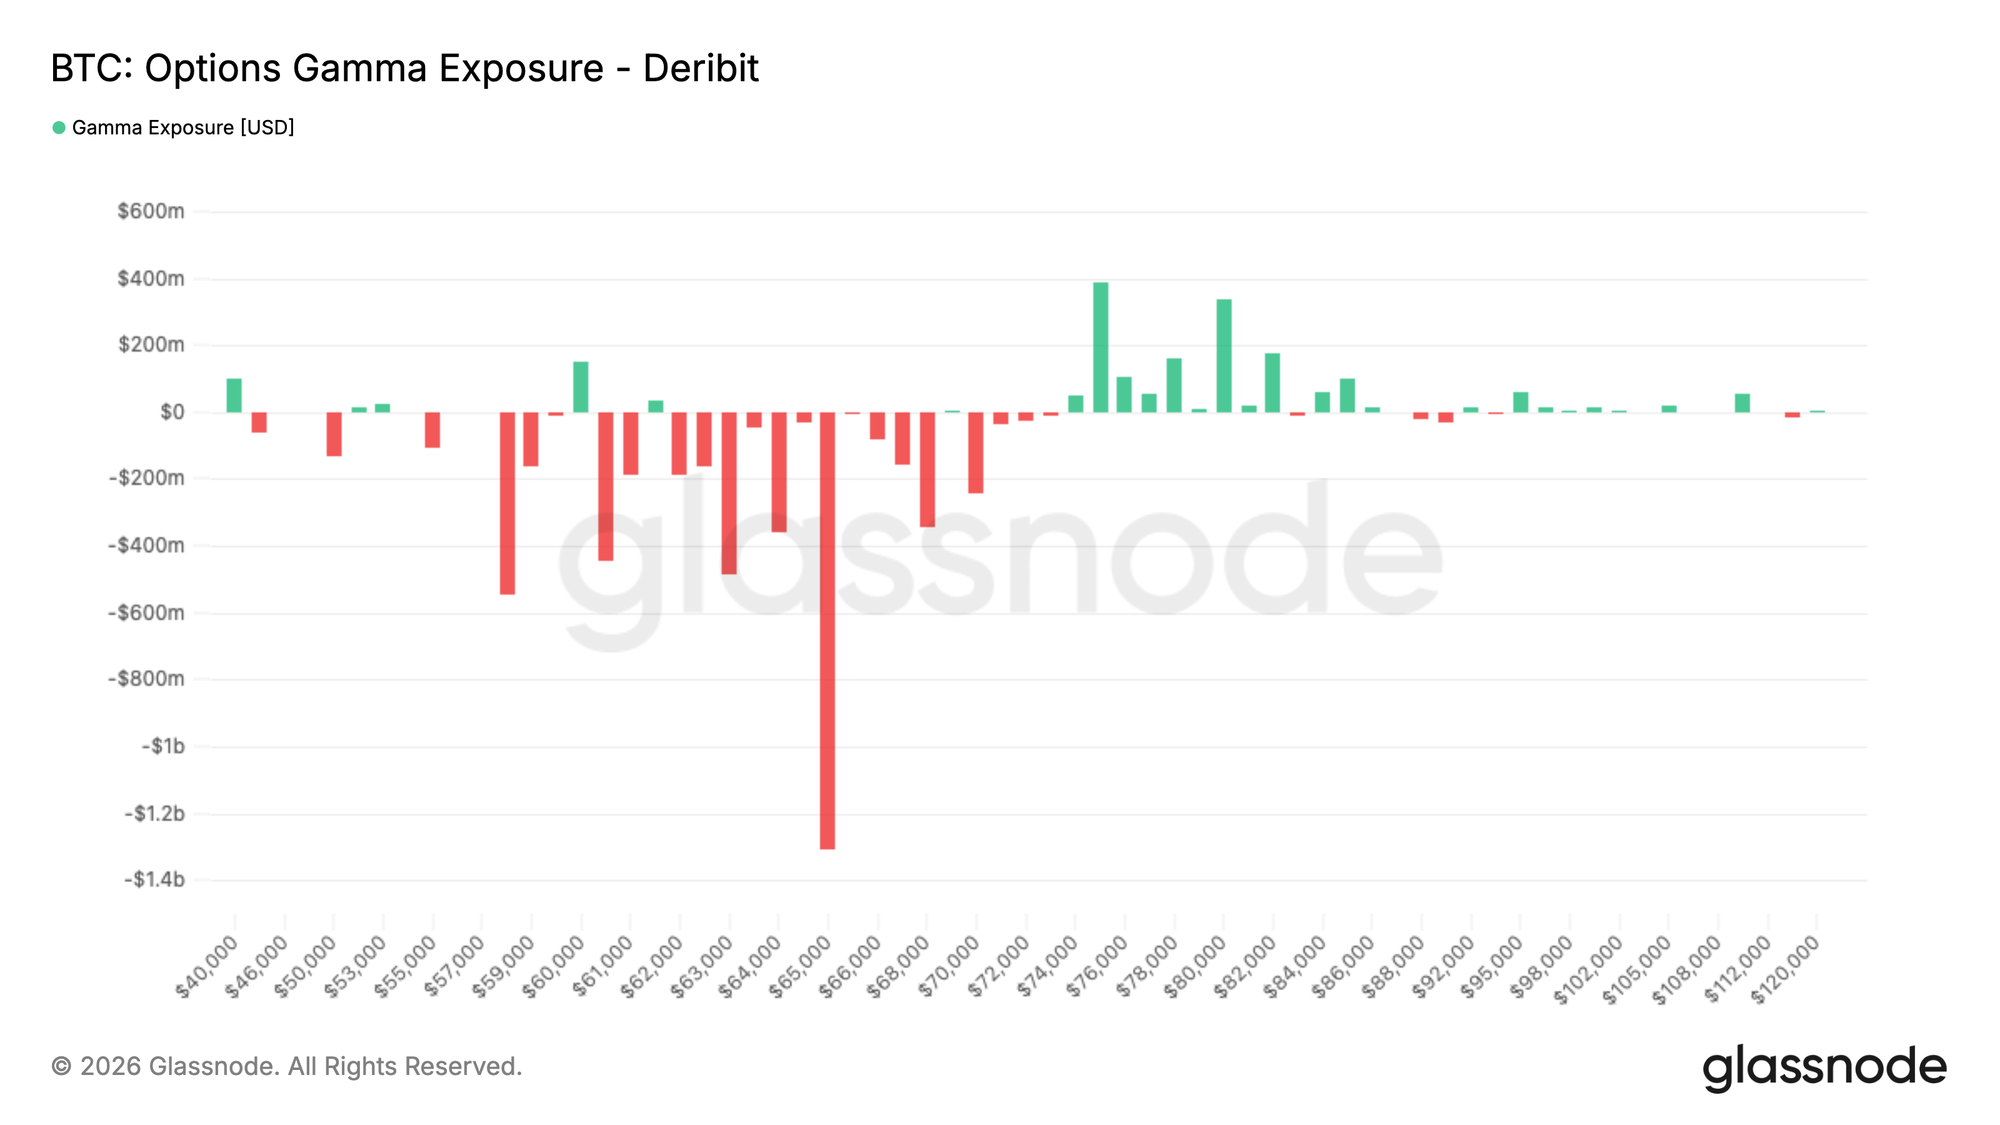
Significant Gamma Exposure Near $65,000
Beyond option prices, gamma exposure helps identify the strike prices where options market makers' hedging behavior has the most significant impact on price action.
The current market trading style is broadly defensive. Over the past seven days, put option volume accounted for 32.4% of total option volume; in the last 24 hours, this ratio has further increased to 35.9%. Even after a significant decline, market trading continues to emphasize purchasing downside protection.
This trading behavior is directly reflected in the gamma exposure profile. Currently, the largest negative gamma exposure is concentrated around $65,000, with significant negative gamma also distributed across the $59,000 to $70,000 range. With Bitcoin's current price around $62,000, the spot price sits just below the zone of maximum short-dated negative gamma. Positive gamma exposure is primarily located much higher, in the $76,000 to $82,000 range.
Defensive trading dominates the positioning of market makers. The market's largest negative gamma zone is located at $65,000, a level very close to the current spot price.
Summary
The current market displays classic characteristics of a late-stage bear market correction: recently entered investors are deeply underwater, realized losses remain high, and multiple core sources of buying demand are weakening.
The decline of Bitcoin toward $60,000 triggered a significant deleveraging event, clearing out speculative positions from the market. Leverage levels have normalized, but the spot market has consistently failed to attract new, effective buying demand.
The options market maintains a defensive posture, with elevated implied volatility, strong demand for downside hedges, and key dealer gamma exposure tightly clustered near the current spot price. Combined with a decline in institutional participation and a slowdown in corporate treasury accumulation, this clearly indicates a persistent low risk appetite across the market.
Synthesizing all the data, the market is gradually moving into a phase of deep panic selling. While market leverage has been largely flushed and valuation metrics have fallen to historically deep discounted zones, the incremental buying demand historically required to build a solid foundation for a bottom has yet to emerge.


