
Gate Institutional Weekly: BTC Short Squeeze Slows Down, Aave Funding Rates Return to Rationality
- Core Viewpoint: Last week, the market shifted from hedging against geopolitical conflicts to trading economic soft landing and rate cut expectations. BTC broke through $82,000 amid sustained ETF inflows. On-chain TradFi trading was dominated by macro assets like gold, but funds have begun to flow back to leading DEXs and compliant stablecoins, indicating an improvement in risk appetite but with structural caution.
- Key Factors:
- BTC ETFs saw net inflows of $631.6 million for the week, with IBIT dominating at $596.3 million; ETH ETFs saw net inflows of $70.3 million, turning positive from negative, driven by ETHA.
- In the TradFi perpetual contract trading structure, precious metals still account for over 60%, but the number of equity-based CEX assets has increased by 25.9% since the end of April, indicating that funds are starting to pay attention to US stock indices alongside the macro trading narrative.
- On-chain funds flowed back to leading DEXs like Uniswap and PancakeSwap; stablecoin trading favored compliant and cross-chain settlement assets. Circle obtained the MiCA authorization in France and integrated USDC into Injective.
- Aave is still digesting the shock from the rsETH incident, leading to a contraction in lending scale. However, the new public chain MegaETH has absorbed some of the new loan demand. Aave is shifting its growth focus towards euro stablecoins and new chain markets.
- The BTC derivatives market exhibited a short squeeze structure characterized by "negative funding rates + high-level consolidation." OI declined after a spike and did not rise in tandem with the price, suggesting the upward momentum was primarily driven by short covering rather than new leveraged buying.
- BTC options trading volume surged and concentrated during the breakout phase, then cooled down. Implied volatility rose, then fell and stabilized after the breakout. The market has entered a high-level consolidation observation period, with short-term directional pricing not yet fully developed.
- In May, Gate's institutional spot trading volume increased by 14.54% month-over-month, and futures volume increased by 18.10% month-over-month. CrossEx saw its trading volume and asset base hit new highs for three consecutive weeks, indicating continued growth in cross-exchange arbitrage demand.
Executive Summary
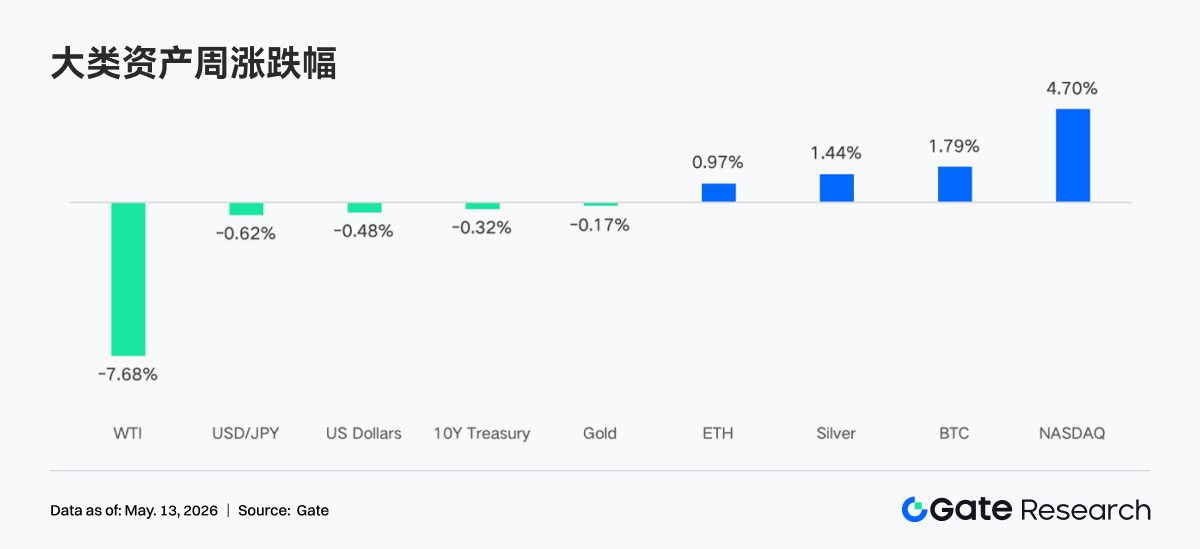
• Last week, the market shifted from "war risk aversion" to "soft landing + rate cut expectation" trading. The Middle East ceasefire proposal sent positive signals, and strong earnings from AI and technology companies drove the Nasdaq to a weekly gain of 4.70%. BTC broke through $82,000, fueled by sustained ETF inflows.
• BTC ETFs saw net inflows of $632 million for the week, with IBIT continuing to dominate institutional capital; ETH ETFs turned positive from negative, with ETHA being the primary source of growth, indicating a notable improvement in institutional allocation sentiment.
• On-chain TradFi trading was dominated by macro assets like gold and crude oil, while the proportion of stock and ETF-related trading continued to recover; CEX TradFi asset numbers continued to expand, with the most significant growth in the stock category.
• On-chain capital flowed back to leading DEXs and mature liquidity venues, with Uniswap and PancakeSwap being the core platforms; the stablecoin market favored USD-pegged assets with stronger compliance, settlement, and cross-chain capabilities.
• Aave is still digesting the impact of the rsETH incident, with the lending market remaining subdued; new venues like MegaETH and Plasma began to absorb incremental capital, with Solana LSTs being the first to benefit from the recovery in risk appetite.
• The derivatives market continued its "negative funding rate + high-level consolidation" structure; the BTC short squeeze was partially released; options volume and implied volatility expanded during the breakout phase before cooling down again.
• In May, Gate's institutional spot volume grew 14.54% MoM, and futures grew 18.10% MoM; CrossEx hit new highs in trading volume and asset base for three consecutive weeks; the Amsterdam edition of Gate Institutional Circle is in its preparation phase.
1. Market Focus
The US proposed a substantive ceasefire plan, containing 14 clauses covering the suspension of Iran's nuclear enrichment activities, gradual lifting of sanctions, and removal of restrictions related to the Strait of Hormuz. Sources indicated this was the closest the two sides had come to an agreement since the conflict began. The market reacted positively to this news. Combined with strong earnings reports across various sectors, particularly from technology and AI companies, the Nasdaq surged 4.70% for the week, hitting recent highs. Meanwhile, although geopolitical tensions provided support for gold and silver, a sharp drop in crude oil prices (WTI fell 7.68% for the week) due to easing supply disruption concerns cooled inflation expectations, limiting gold's upside. In the crypto space, Bitcoin steadily broke through the $82,000 mark, supported by sustained spot ETF inflows and improving market liquidity. In the forex market, the US Dollar Index weakened due to a dovish tone from the Fed, providing support for a minor rebound in the Japanese Yen.
Despite the impact of the oil crisis, the latest labor market data continues to show improvement. Non-farm payrolls grew for two consecutive months in March and April, hitting a near one-year high, bringing the average monthly private sector job growth to nearly 90,000 so far this year. Meanwhile, the unemployment rate has fallen from its 2025 peak, with the latest data for April showing a rate of 4.3%, unchanged from the previous year. Overall, the market has shifted from the "war panic" seen earlier in the week to optimistic pricing for an "economic soft landing" and "room for Fed rate cuts."
2. Liquidity Analysis
2.1 BTC ETF Scale Continues to Expand
Last week, BTC ETFs exhibited a pattern of "strong inflows early, outflows late," with net inflows recorded for the first three trading days, followed by net outflows in the last two days. Total weekly net inflows for BTC ETFs were $631.6 million, a significant increase from the previous week, indicating a generally positive market sentiment. ETH ETFs saw total weekly net inflows of $70.3 million, a marked improvement from the previous week and a shift from negative to positive.
• Overall AUM: As of May 8th, the total net asset value of BTC ETFs was approximately $1067.7 billion, with cumulative historical net inflows exceeding $59.4 billion; ETH ETFs had a total net asset value of approximately $13.6 billion, with cumulative historical net inflows of about $12.1 billion, and ETF net assets accounted for roughly 4.94% of Ethereum's total market cap. The scale of BTC ETFs continues to expand. IBIT's AUM alone has reached approximately $66.9 billion, accounting for about 66% of the entire BTC ETF market, surpassing the size of most traditional commodity ETFs.
• Institutional Movements: There was clear divergence in capital flows this week. IBIT led with net inflows of $596.3 million for the full week, solidifying its dominant position in institutional portfolios. ARKB ranked second with $53.1 million, indicating some institutions still have appetite for high-Beta strategy products. In contrast, FBTC saw only $52.2 million in net inflows for the week, with significant outflows on Thursday and Friday totaling approximately $226.6 million, reflecting a more cautious stance by institutions towards Fidelity's product. GBTC continued its structural outflows, with net outflows of $62.3 million for the week. On the ETH ETF front, ETHA led with net inflows of $100.1 million, while FETH was dragged down by a single-day outflow of $62.3 million on Thursday, resulting in net outflows of $32.2 million for the week, showing a clear divergence in the performance of the two major ETH products.
2.2 TradFi Liquidity
• TradFi Perp DEX: In the past week, the trading structure of TradFi Perp DEXs remained absolutely dominated by commodities, maintaining a share of over 60%. This indicates that macro assets like gold and crude oil continue to drive on-chain TradFi trading demand. Against the backdrop of persistent geopolitical risks and safe-haven sentiment, capital is clearly biased towards commodity assets with higher volatility and more direct narratives. Meanwhile, the share of Indices/ETFs and Stocks sectors continued to recover steadily, suggesting some capital is re-engaging with trading opportunities related to US stock indices and ETFs. The share of traditional macro assets like FX and Bonds remained low. Overall, the current trading preference on TradFi DEXs remains highly concentrated on the "macro trading" theme, and on-chain risk appetite has not yet significantly shifted towards low-volatility assets.
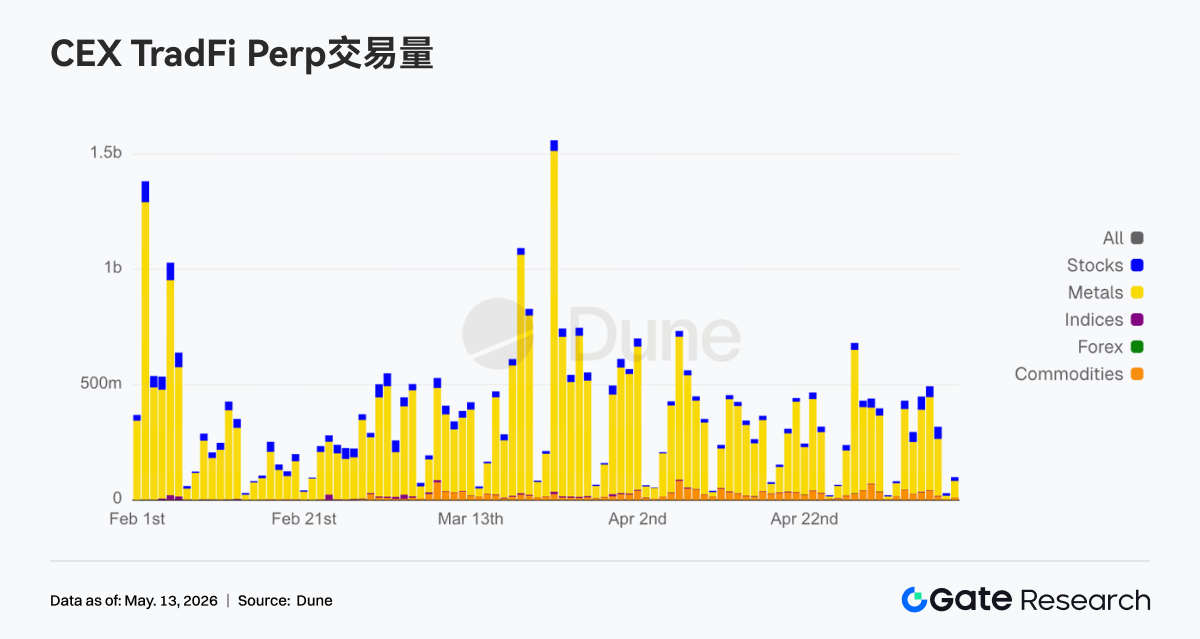
• TradFi Perp CEX: Over the past week, CEX TradFi perpetual contract trading volumes remained high and volatile, with metals like gold continuing to dominate. The precious metals sector still contributed the vast majority of trading volume, reflecting sustained strong market participation in safe-haven and macro trading assets. Meanwhile, trading volume in the stock sector remained stable, indicating continued capital interest in volatility opportunities related to US stock indices and tech stocks. Commodities saw a periodic volume surge driven by oil price fluctuations. Overall, the current CEX TradFi trading structure remains centered on gold, with macro events and safe-haven demand continuing to dominate market risk appetite.
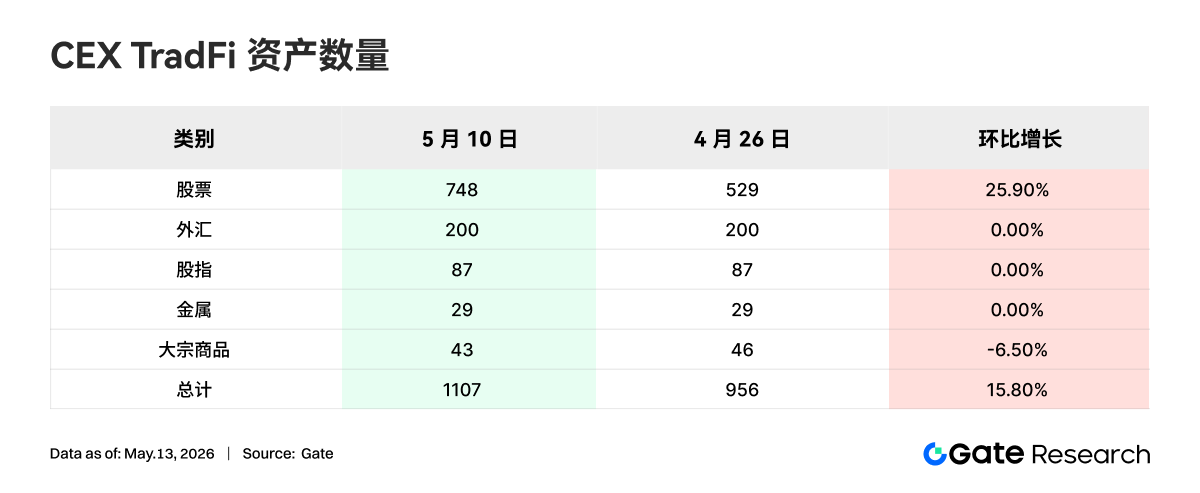
• CEX TradFi Asset Count: The number of CEX TradFi asset categories continued to expand over the past week. The total count of TradFi assets (only counting TradFi and CFD sectors, excluding perpetuals) across three major CEXs increased from 956 to 1,107, a growth of 15.80% compared to the end of April. The stock category saw the most significant increase, growing from 594 to 748 stocks, up 25.90% from the end of April; Gate's stock TradFi category increased by 104 from the end of April, a growth rate of 38.95%.
• TradFi Order Book Depth: We analyzed the order book depth (Delta) of XAUT, the TradFi asset with the highest trading volume. Over the past week, XAUT's depth structure exhibited a clear characteristic of "price rising, sell-side thickening." Between May 4th and 5th, the order book Delta recorded positive values exceeding $1 million at times, indicating a significant increase in proactive buying pressure. However, prices fell back to around $4,500 during this period, suggesting strong support at lower levels. Starting from May 6th, as the gold price rapidly surged above $4,700, the order book Delta turned consistently negative, with multiple instances of liquidity outflows exceeding $1.5 million per hour. This indicates a significant increase in sell orders at higher levels, with some capital beginning to take profits or hedge. Despite this, the XAUT price maintained a high-level consolidation, indicating that market demand for gold as a safe-haven asset remains robust. The depth structure has now gradually transitioned from the earlier "active buying driving price up" phase to a "high-level selling pressure vs. capital support" tug-of-war. In the short term, focus should be on whether liquidity support near $4,650 can be maintained.
3. On-Chain Data Insights
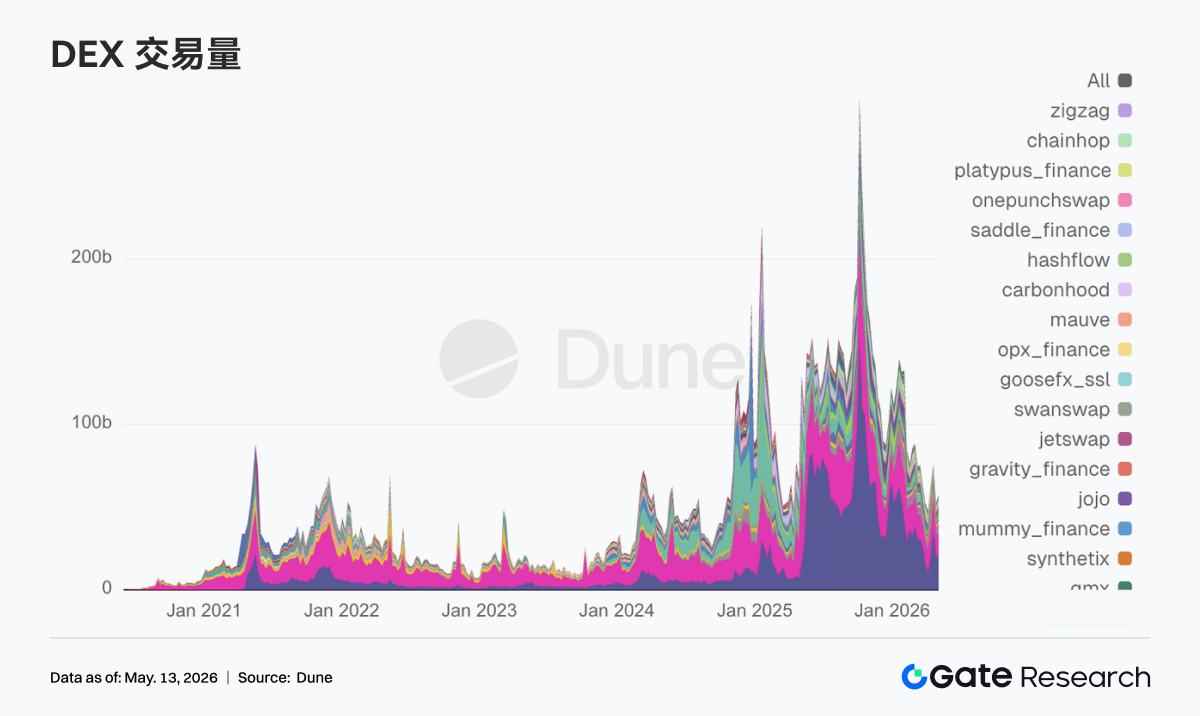
3.1 Capital Flows Back to Leading DEXs, Trading Focus Shifts to Platforms with Deepest Liquidity
The first week of May saw a strong "return to home base" characteristic in DEX activity. PancakeSwap topped the charts, but incremental capital gave higher weighting to trading venues with deeper liquidity like Uniswap and Aerodrome. Activity on the Solana side hasn't fizzled out, with Meteora and Raydium still showing activity, but trading wasn't solely propped up by a single Meme narrative like in previous weeks. After Bitcoin reclaimed its key psychological level, market risk appetite was re-ignited, and DEX volumes switched back to a more active state. Notably, Grayscale removed Aerodrome and added Ethena in its quarterly DeFi fund rebalance this week, while retaining Uniswap as its top holding. This suggests institutional capital still prioritizes mature liquidity protocols before selecting newer narrative directions.
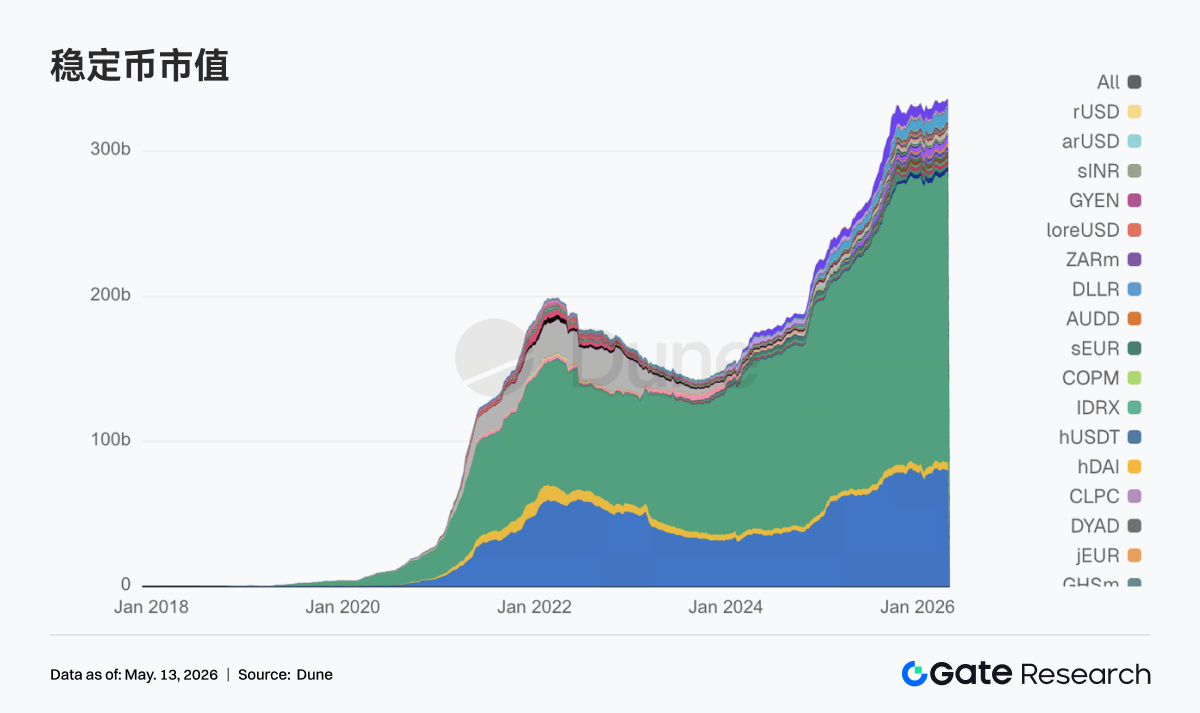
3.2 Market Attention Returns to Settleable, Compliant, Cross-Chain Stablecoins
Besides the top two stablecoins USDT and USDC, payment-oriented, compliant stablecoins that can directly enter DeFi collateral and liquidation processes took more prominent positions this week, while the popularity of yield-oriented and more experimental varieties cooled. This change aligns with the policy landscape. Reuters reported that the Senate reached a key compromise on stablecoin rewards and yield provisions, prompting the market to quickly begin reassessing which stablecoins best fit the next regulatory framework. Notably, Circle was actively engaged in bridging the gap between reality, regulation, and ecosystem building this week: obtaining MiCA-related authorization in France on May 4th, submitting comments on the GENIUS rule the next day, and connecting USDC and CCTP to Injective on May 7th, steadily advancing along the main lines of compliant distribution and cross-chain settlement.
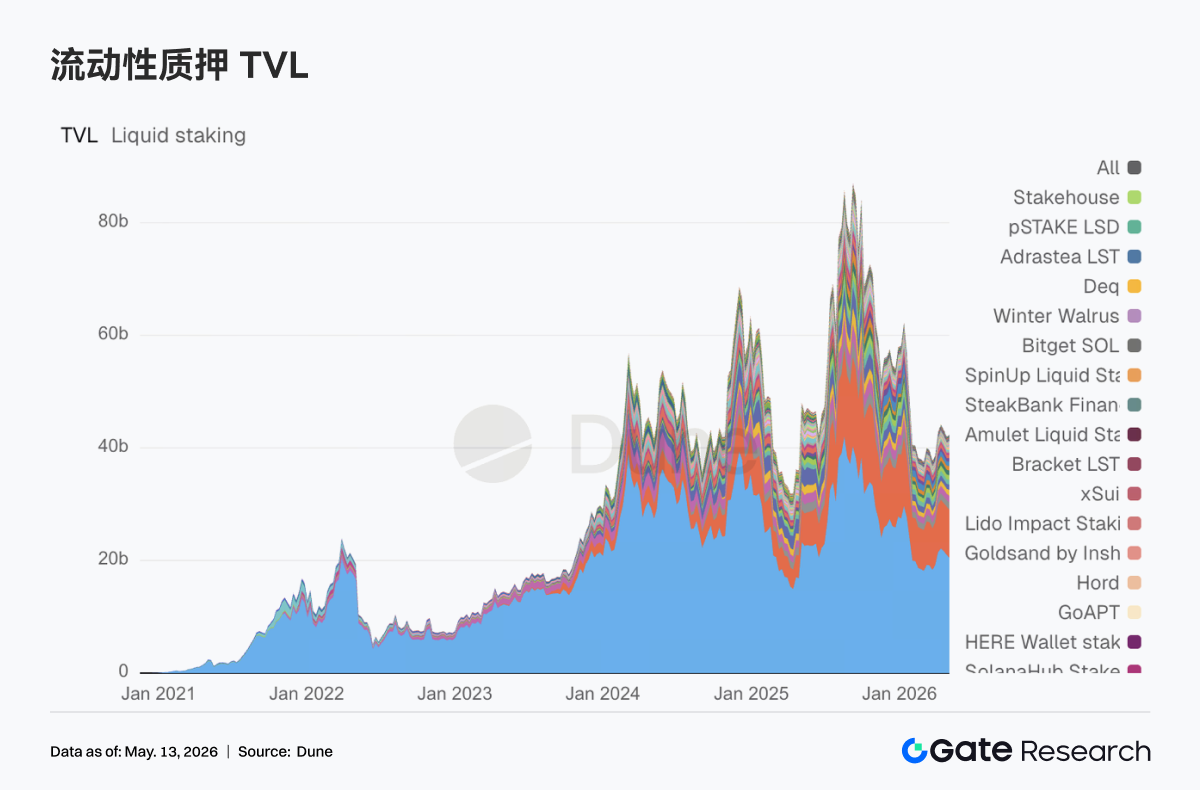
3.3 ETH LST Leaders Stable, Solana Side Absorbs Risk-On Shift First
Leading protocols on the ETH side haven't yet shown a clear one-sided strong recovery. Lido itself appears somewhat restrained, while Rocket Pool and StakeWise are relatively steady. In contrast, LSTs on the Solana side were quicker to absorb the improving market risk appetite. Assets from Sanctum and Jupiter Staked SOL saw more active absorption, with capital willing to reprice high-elasticity staking assets. Meanwhile, Lido obtained the Web3SOC certification this week, continuing to advance its main lines of institutional due diligence, governance transparency, and security frameworks, further solidifying its slow-variable advantage in institutional capital.
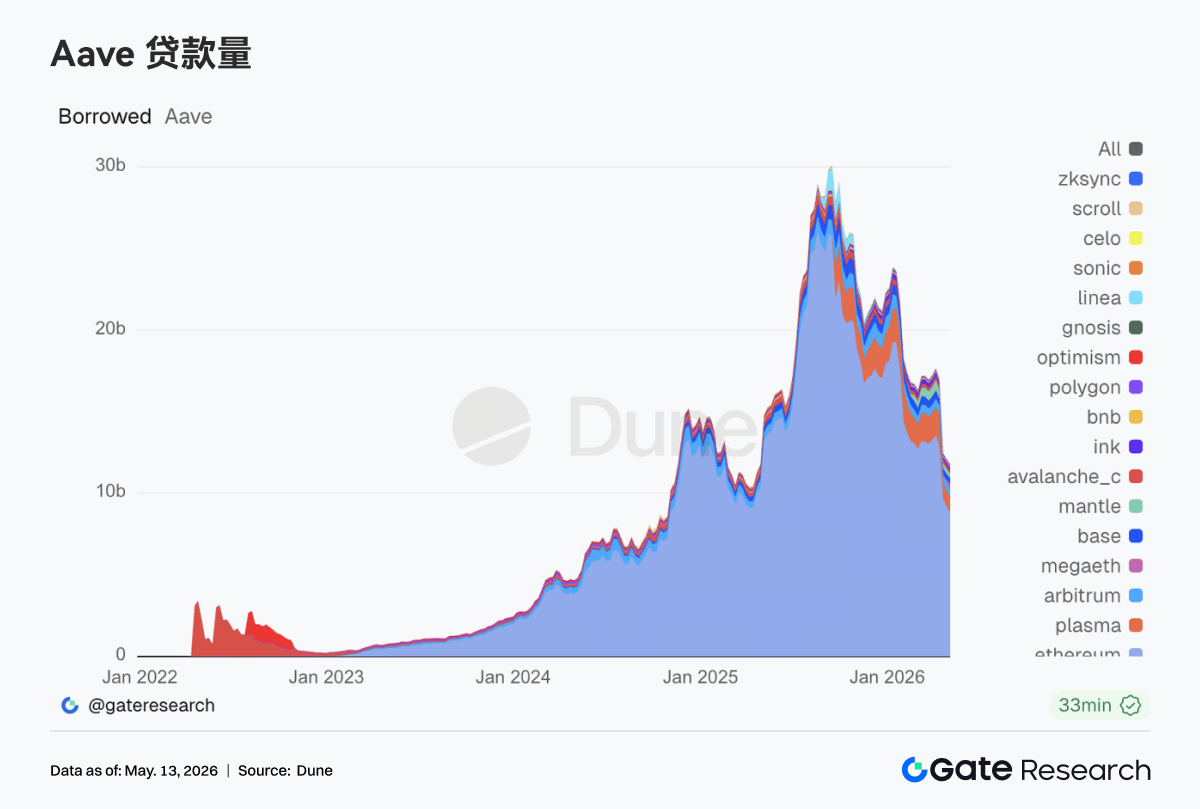
3.4 Aave Still Digesting rsETH Aftermath, MegaETH Absorbs New Lending Demand
Aave's lending data this week still bore strong traces of post-incident repair. Lending volumes on the Ethereum main market contracted further, and other previously dominant markets like Arbitrum, Base, and Ink were also weak. The multi-chain recovery seen a few weeks prior did not return. Conversely, Plasma continued its strength, and the lending market on the new L1 MegaETH showed a particularly notable increase. Capital was shifting from traditional main markets to newer venues and markets with greater incentive potential. Aave Labs, in its monthly update at the beginning of the month, directly stated that the rsETH incident had interrupted the early growth trajectory of Aave V4. Subsequently, on May 5th, the Aave Labs risk team pushed forward cap increases for EURC on Ethereum and USDm on MegaETH. Aave is pivoting its new growth focus towards stablecoins with clearer regulatory attributes and lending markets on new chains that can form tighter economic loops.
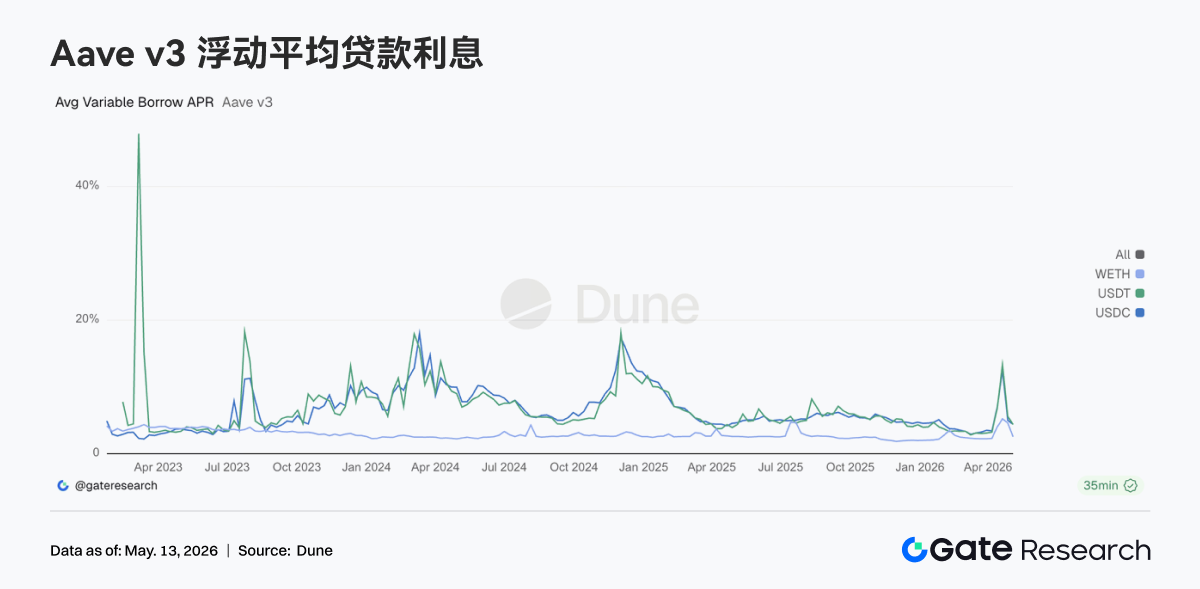
3.5 Aave Core Assets Retreat from Stress, WETH Leverage Subsides Most
Compared to the incident-driven rate spikes of the prior two weeks, Aave's lending rates cooled significantly this week. The average borrowing costs for USDC and USDT returned to normal ranges, while the drop on the WETH side was even faster. Viewed alongside lending volumes, market demand has shifted from "scrambling for liquidity" back to "selectively borrowing liquidity." This also explains why EURC and USDm were prioritized for supply cap increases: demand for stablecoin loans persists, but it is now more oriented towards structured arbitrage, regional currency needs, and incentive-based trading on new chains.
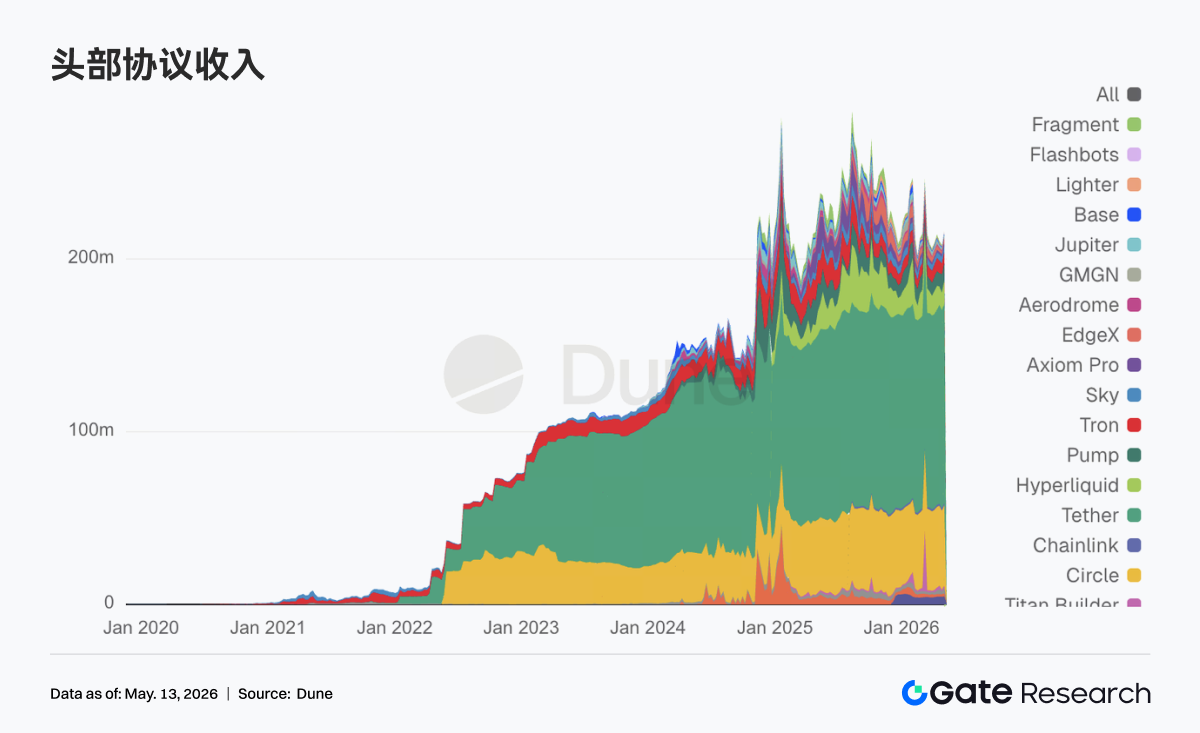
3.6 Protocol Revenue Returns to Structure with Stablecoins as Base, Derivatives and Lending for Elasticity
Tether and Circle's stablecoin issuance ends continue to contribute the most stable cash flow. This week, elasticity primarily returned to on-chain derivatives and lending infrastructure. Hyperliquid saw high volumes, and Aave's revenue elasticity was significantly stronger than the previous week, indicating that trading and liquidation demand hasn't been extinguished by the risk events in late April. Hyperliquid began moving into Bitcoin outcome markets on May 5th, and Hyperliquid Strategies disclosed expanding HYPE reserves and advancing validator partnerships. The market is pricing this as a signal of Hyperliquid's evolution from a perpetuals exchange towards a full-fledged financial stack. On the other hand, the simultaneous occurrence of rising Aave revenue and contracting lending volumes points to the risk premium and capital repricing that followed the incident shock.
4. Derivatives Tracking
4.1 BTC Funding Rate Deeply Negative with Rising OI, Short Squeeze Structure Intensifies
From May 4th to May 10th, the BTC price continued its upward trend and maintained high-level consolidation, rising from around $79K to above $82K. Although it pulled back to near $80K around May 7th, it subsequently recovered. Regarding funding rates, most of the week remained in negative territory, with particularly deep negative values around May 5th and 6th. This indicates that bearish sentiment hadn't fully subsided during the price increase, and a divergence structure of "price strengthening but funding rate negative" persisted in the market.
Unlike the previous phase, OI surged to over $29B on May 5th before quickly retreating and subsequently consolidating in the $26B to $27B range. The combination of negative funding rates and a spike-and-retreat in OI suggests that the previously crowded short positions were partially unwound during the price increase, with some leveraged positions being either passively or actively closed. After May 7th, the BTC price maintained a high-level recovery, but OI failed to return to its previous highs, indicating limited willingness for new leveraged long positions chasing the uptrend. The market transitioned from a "short accumulation + price not declining" squeeze accumulation phase to a "post-squeeze high-level rotation" state.
Overall, the current derivatives structure remains slightly bullish, but the momentum from the short squeeze has been partially digested compared to the period around May 5th. If the price continues to break above $82K and OI rises concurrently, it could re-establish a resonance of leveraged chasing and short covering. However, if the price consolidates at high levels while OI continues to decline, it would suggest that the upward momentum is primarily driven by the covering of previous short positions, requiring spot buying or new long leverage to sustain further upside.


