
Bitcoin on-chain indicators are turning positive—are we finally emerging from the bear market?
- Core Viewpoint: CryptoQuant’s Bull-Bear Market Cycle Indicator and Bull Score Index have both recently turned positive in sync, signaling early signs of recovery in Bitcoin’s on-chain data. However, a similar signal in 2022 briefly flipped before leading to deeper declines, reminding the market to be wary of potential “false reversals.”
- Key Elements:
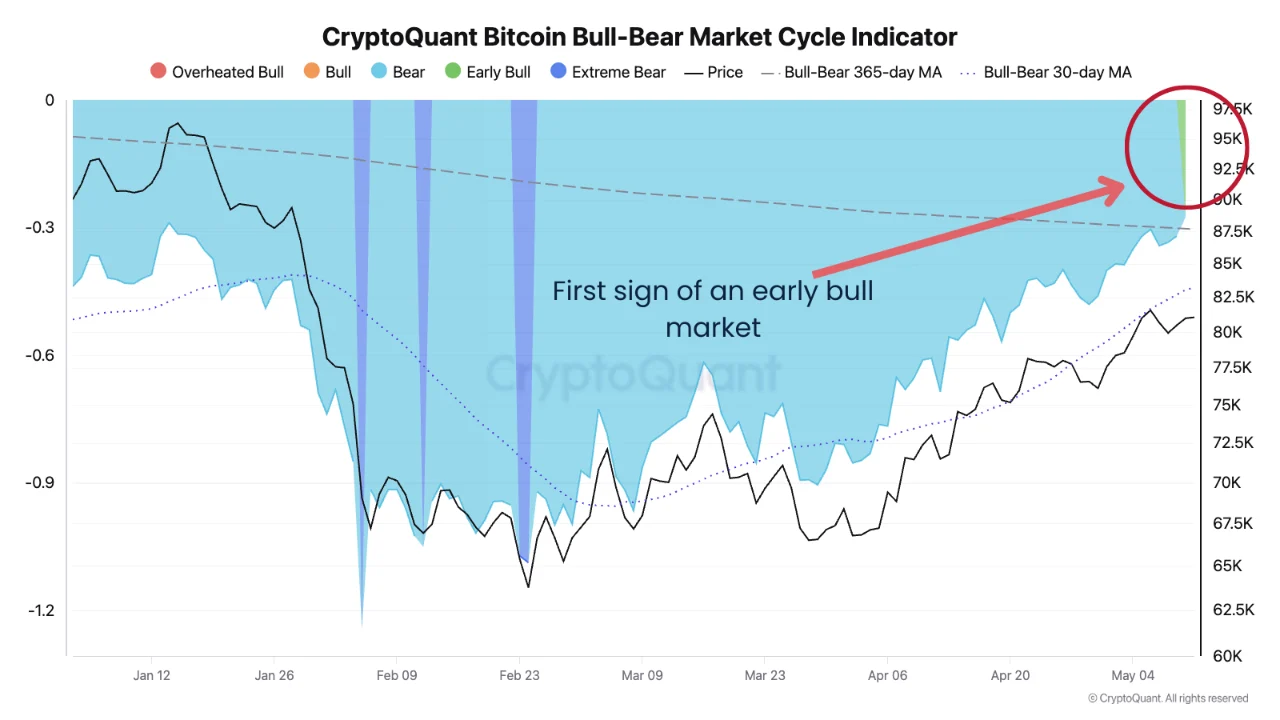
- CryptoQuant’s Bull-Bear Market Cycle Indicator has turned positive for the first time since October 2025, with Bitcoin’s price rebounding over 35% from its February low of around $60,000 to $81,000.
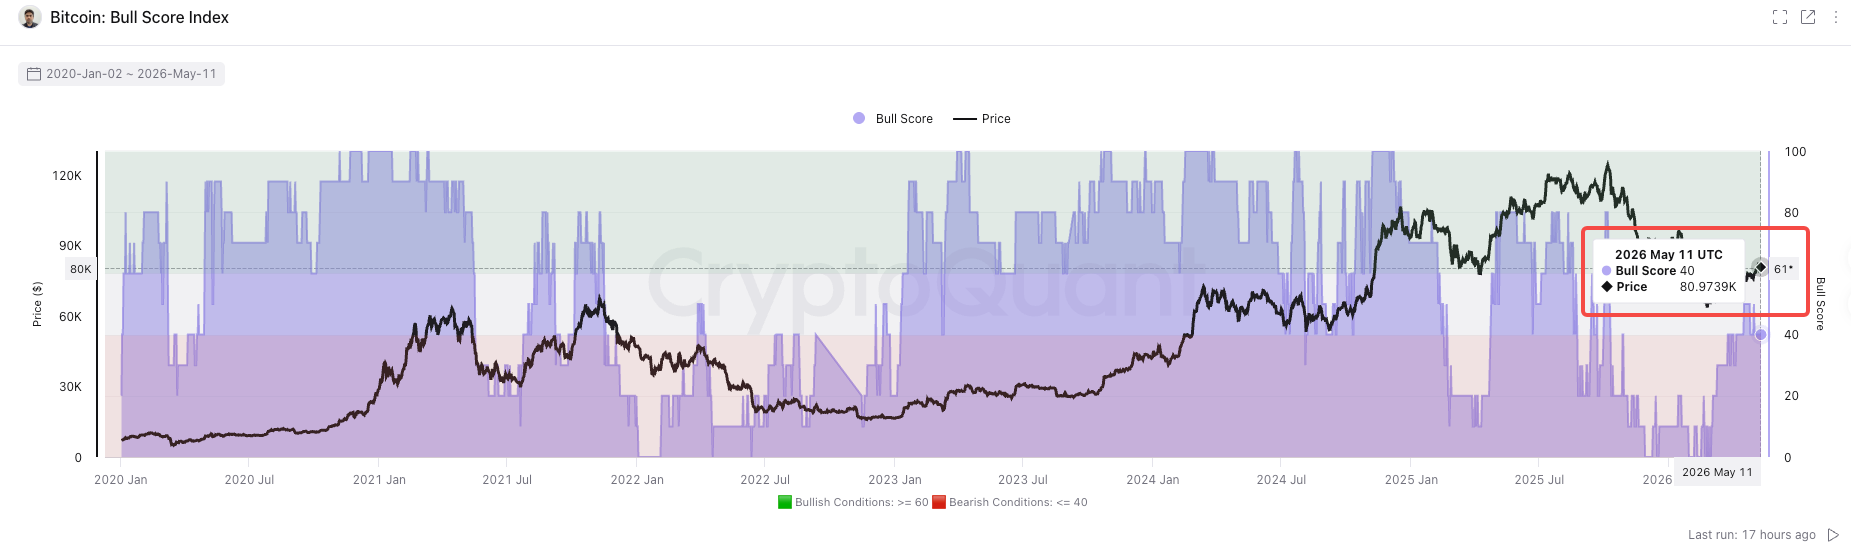
- Another core indicator, the Bull Score Index, rose to the neutral 50 level in late April for the first time since the downturn—yet in March 2022, this index only stayed above 50 for a week before plunging further.
- The bottom recovery in this bear market cycle has taken about 3 months, faster than the 12-month recovery in 2022. However, with a roughly 55% drop from peak to trough, the sustainability of this recovery remains debated.
- Compared to 2022, this cycle exhibits structural differences: spot Bitcoin ETFs serve as institutional demand anchors, with net inflows of $2.44 billion in April; the number of whale addresses increased by 142; and the RHODL ratio is at its third-highest historical level.
- According to Stonex’s head of research, based on the halving cycle projection, this cycle’s durable bottom may not appear until Q4 2026, with a potential decline of about 60% corresponding to a price of roughly $50,000.
Original Author: Claude, TechFlow
TechFlow Introduction: CryptoQuant's Bull-Bear Market Cycle Indicator has turned positive for the first time since October 2025. Concurrently, another core indicator, the Bull Score Index, rose to the neutral zone of 50 in late April. Bitcoin has posted gains for three consecutive months, rebounding from a cycle low of approximately $60,000 in February to above $81,000. However, the precedent of 2022 serves as a cautionary tale for the market: a similar signal was invalidated just one week later, leading to further price declines.
Bitcoin on-chain data is releasing a long-awaited positive signal.
According to data from the CryptoQuant platform, its Bull-Bear Market Cycle Indicator has recently moved back into positive territory. This is the first time since October 2025 that the P&L Index has crossed below its 365-day moving average.
This indicator determines whether Bitcoin is in a bull or bear cycle by measuring the distance between the P&L Index and its 365-day moving average. The P&L Index itself integrates three core on-chain metrics: the MVRV Ratio, NUPL, and the Long/Short-Term Holder SOPR. It serves as CryptoQuant's unified valuation tool for assessing whether Bitcoin is overvalued or undervalued.
As of press time, Bitcoin is trading around $81,000, a rebound of over 35% from its cycle low of approximately $60,000 in early February.
Source: CryptoQuant, analysis by MorenoDV_
From Deep Bear to First Positive Turn: On-Chain Recovery Took 7 Months
Reviewing the on-chain trajectory of this bear market: After Bitcoin's sharp decline from its all-time high of $126,000 in October 2025, the Bull-Bear Cycle Indicator quickly plunged into negative territory. According to a Cryptonomist report in February this year, the indicator fell to around -1.2 in early February, comparable to the lows seen during the March 2020 COVID-19 crash. A contemporaneous report from CryptBull confirmed that the indicator reading had reached its lowest level since the bottom of the 2022 FTX collapse.
The recovery from the deep bear market bottom in February to the recent positive turn has taken approximately three months. This pace is faster than the 2022 cycle, where the indicator remained in negative territory for about 12 months. However, considering the roughly 55% decline from peak to trough in this cycle (from $126,000 to less than $60,000), the sustainability of this recovery remains a subject of debate.
Bull Score Index Simultaneously Rises to Neutral: Multiple Indicators Converge
The Bull-Bear Cycle Indicator's shift to positive is not an isolated event.
According to a CoinDesk report from April 23, CryptoQuant's other core indicator, the Bull Score Index, simultaneously rose to a neutral reading of 50. This is the first time the index has done so since Bitcoin began its decline from the $126,000 high.
The Bull Score Index aggregates ten on-chain indicators, covering dimensions such as blockchain activity, investor profitability, and liquidity. A reading below 40 typically indicates a structural bear market, while a reading above 60 points to a strong, sustainable uptrend.
CryptoQuant Head of Research Julio Moreno commented on this, stating that it is the first time the Bull Score Index has entered the neutral zone in this bear market. However, he also noted the precedent from March 2022, when the index briefly rose to 50 but only maintained that level for about a week before prices continued their significant decline.
The improvement at the price level is equally evident. Bitcoin posted gains of approximately 2% in March and 12% in April, and has risen roughly 6% so far in May, recording positive returns for three consecutive months.
The Cautionary Tale of the 2022 'False Signal': History May Not Repeat, but the Market Remembers
The market's biggest concern regarding the current positive signals stems from the historical lessons of 2022.
In March of that year, the Bull Score Index briefly entered the neutral zone of 50, after which Bitcoin fell from around $47,000 all the way down to $16,000. The Bull-Bear Cycle Indicator also temporarily turned positive in 2022 but ultimately continued its deep decline following the successive collapses of Luna/UST and FTX.
However, this cycle exhibits structural differences from 2022. Since its launch in January 2024, the spot Bitcoin ETF has become a significant anchor for institutional demand. According to a report by SpotedCrypto, net inflows into spot Bitcoin ETFs reached $2.44 billion in April, the strongest month since October 2025. Glassnode data shows that the number of whale addresses holding over 1,000 Bitcoin has increased by 142 over the past six months. Furthermore, Glassnode's RHODL Ratio currently stands at 4.5, the third-highest reading in Bitcoin's history. The two previous instances of similarly high levels occurred at the cycle bottoms of 2015 and 2022, both of which were followed by sustained bull markets.
StoneX Global Head of Research Matt Weller provides a more cautious frame of reference in his Q2 outlook.
Based on Bitcoin's four-year halving cycle projections, the durable bottom of the current cycle may not occur until around Q4 2026. If historical patterns hold, the decline from peak to trough would be approximately 60%, corresponding to a price of around $50,000.
For traders, the true implication of the current signals might be this:
The most panicked phase may be over, but it is still too early to declare the start of a new bull market. Bitcoin needs to break through and hold above the resistance of its 200-day moving average near $82,000 to provide a more convincing technical confirmation of a trend reversal.


