
Crypto Market Macro Report: Bitcoin Returns to $80,000 Amid US-Iran Geopolitical Reversal and Fed Leadership Change
- Core Thesis: In May 2026, the crypto market is at a complex juncture where three primary themes intersect: geopolitics (US-Iran conflict), monetary policy (Fed leadership change), and deepening institutionalization (ETF accumulation against the trend). Despite persistent macro headwinds, the lock-up behavior of institutions and long-term holders, combined with the halving cycle pattern, suggests this is more likely a deep correction within a bull market rather than the start of a bear market.
- Key Factors:
- Geopolitical Turmoil: The dramatic suspension of the US "Freedom Plan" escort operation, but the risk of a de facto blockade of the Strait of Hormuz has not dissipated. Surging oil prices have already pushed Goldman Sachs' core PCE inflation forecast to 2.6%, creating a "stagflationary" macro environment that dually suppresses Bitcoin's safe-haven attributes and risk asset valuations.
- Fed Policy Crossroads: Kevin Warsh replacing Jerome Powell as Chair, with his "mixed hawkish-dovish" stance and internal divisions increasing policy uncertainty. The Beige Book shows rising energy costs across the board eroding corporate profits, making the path to rate cuts more tortuous and posing medium-term headwinds for the liquidity-sensitive crypto market.
- Clear Institutional Accumulation Signal: During the price retracement to the $76,000-$81,000 range, spot BTC ETFs saw a single-day net inflow of up to $630 million. As of early May, total ETF net assets reached $103.785 billion, representing 6.66% of Bitcoin's total market cap, indicating steady institutional position-building during weakness.
- Profound Supply-Demand Shift: Since ETF approval, over 580,000 BTC (roughly three years' worth of mining supply) have been absorbed. Combined with the rising supply held by long-term holders, this dual lock-up dynamic has contracted the actual circulating supply, providing implicit price support.
- Halving Cycle Pattern Validated: The current period (May 2026) falls within the 12-18 month price discovery window following the April 2024 halving. Historical patterns suggest this phase is typically one of "shakeout and accumulation" rather than a cycle peak. However, its validity under the new institutional environment remains uncertain.
1. Geopolitical Game: The "Freedom Plan" Reversal in the Strait of Hormuz and the Resurgence of Inflation
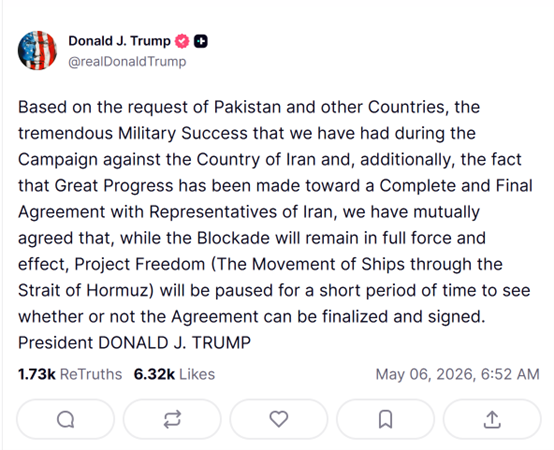
On May 4, 2026, US President Donald Trump grandly announced on Truth Social that the United States would officially launch the "Freedom Plan" escort operation for merchant ships in the Strait of Hormuz at noon Middle Eastern time that day, deploying missile destroyers, over 100 land and sea-based aircraft, multi-domain unmanned platforms, and 15,000 active-duty service members. The US side characterized it as a "defensive humanitarian operation," aiming to bypass the 60-day authorization limit for presidential military actions under the US War Powers Act. However, just one day later, Trump issued another statement, announcing that due to "significant progress in the comprehensive US-Iran agreement," he had decided to suspend the implementation of the "Freedom Plan," but emphasized that the naval blockade against Iran "will continue to be implemented fully and effectively." This dramatic reversal caught global markets off guard, causing crude oil prices to fluctuate wildly following the announcement.
Iran's attitude was far tougher than the US description. Ali Akbar Velayati, a foreign policy advisor to Iran's Supreme Leader, explicitly stated that the Strait of Hormuz has been closed and will not reopen unless "the national will of the Islamic Republic of Iran decides." He added that all vessels planning to transit the strait must submit an application via official email and receive a passage permit from Iran before proceeding. The Chairman of the Iranian Parliament's National Security Commission warned that any foreign armed forces, especially the US military, approaching or entering the Strait of Hormuz would be attacked. On key issues such as the nature of the ceasefire, the right of passage through the strait, and whether the "Freedom Plan" is truly suspended, the positions of the US and Iran are starkly opposed, indicating that the market's pricing of geopolitical risk is far from a point where relaxation is warranted.
The direct consequences of this geopolitical game have already become evident in global inflation data. Driven by the dual shocks of escalating US-Iran military conflict and the UAE's announcement on May 1 to withdraw from the OPEC+ alliance, international oil prices continued to rise from late April to early May, pushing energy prices significantly higher. Goldman Sachs subsequently raised its year-end core PCE inflation forecast from 2.5% to 2.6% and its overall PCE forecast from 3.1% to 3.4%. More concerning is that this inflation is not driven by overheating demand but by supply-side shocks (oil prices) combined with tariff effects. This complicates the Federal Reserve's monetary policy response mechanism—it cannot easily raise rates (fearing increased downward economic pressure) nor initiate rate cuts (risking de-anchored inflation expectations). For Bitcoin, this "stagflationary" macro environment has historically exerted downward pressure from two sides: its safe-haven status has yet to gain broad consensus, while expectations of liquidity contraction persistently weigh on risk asset valuations.
2. On the Eve of the Fed Chair Transition: Beige Book Warnings and the Crossroads of Policy Independence
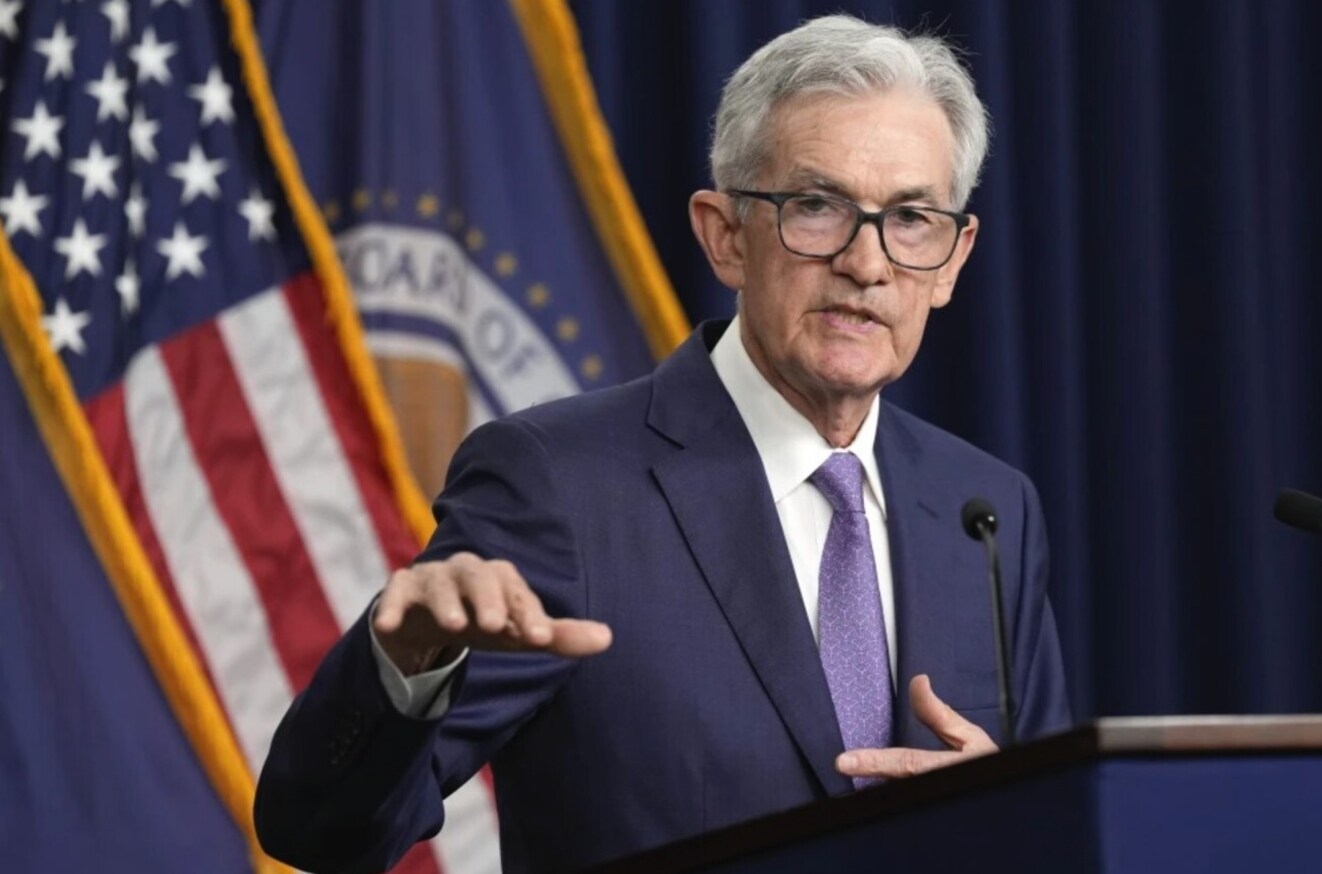
In mid-May 2026, the Federal Reserve is about to witness its most controversial chair transition in modern history: Kevin Warsh will officially succeed Jerome Powell as Chair of the Federal Reserve. Breaking a 75-year tradition, Powell will remain as a Fed Governor after stepping down as Chair. This arrangement is widely interpreted by the market as a political compromise representing an "incomplete decoupling" between the White House and the Fed. Warsh's policy stance exhibits a nuanced "hawkish-dovish mix": he leans hawkish on inflation management and balance sheet management, emphasizing monetary policy discipline and framework restructuring, having publicly criticized the Fed's ultra-loose policies over the past 20 years as "severely偏离其使命." However, he leans dovish regarding the long-term interest rate path, acknowledging the natural disinflationary impact of technological progress and supporting rate cuts when data allows. This mixed stance leaves the market deeply divided over the direction of monetary policy in the "Warsh era," making it a key source of uncertainty for the macro pricing of the crypto market in May.
The Fed's April 30 FOMC meeting was the last chaired by Powell. As widely expected, the federal funds rate was held steady at 3.50% to 3.75%. The post-meeting statement and Powell's press conference conveyed a complex set of signals. On one hand, the impact of rising energy prices on inflation "has begun to show and may expand further in the near term," with Powell explicitly stating that "no officials currently support a rate hike, but some favor reducing the accommodative tone of the FOMC statement." On the other hand, Powell emphasized he would not become a "shadow chair" after stepping down, attempting to allay market concerns about damage to the Fed's policy independence. However, just days after the meeting, internal Fed divisions surfaced: Trump-nominated Governor Stephen Milan dissented in favor of a rate cut, while "hawkish veterans" like Cleveland Fed President Beth Hammack and Minneapolis Fed President Neel Kashkari also dissented (though in favor of holding rates steady). The intensity of this internal discord casts a deep shadow of uncertainty over Warsh's first FOMC meeting.
The Fed's Beige Book, released on April 16, provides valuable grassroots insight into the true state of the US economy. It reported that eight of the twelve Federal Reserve districts experienced slight to modest expansion, two saw essentially flat economic activity, and two reported slight to modest declines. The most notable inflation-related finding was that "energy and fuel costs increased substantially across all 12 districts," with businesses broadly reporting that input cost increases outpaced selling price increases, squeezing profit margins. Firms' decisions regarding hiring, pricing, and capital investment have become more complex, with "wait-and-see" becoming the most common business strategy. For crypto assets, the core signal from the Beige Book is that while the US economy is not in recession, its growth momentum is being eroded by energy inflation. This suggests the Fed's path for rate cuts will be more tortuous than previously expected, creating a persistently headwind macro backdrop for the crypto market, which is highly sensitive to liquidity conditions.
3. Deepening Institutionalization: ETFs Bucking the Trend with Inflows and Miner Balance Sheet Optimization
Amidst a significant pullback in Bitcoin's price from its highs, contrarian institutional buying has emerged as the most noteworthy structural signal in the crypto market in May 2026. According to SoSoValue data, on May 1 (EST), US spot Bitcoin ETFs recorded a single-day net inflow of $630 million, led by BlackRock's IBIT with $284 million, followed by Fidelity's FBTC with $213 million. On May 4, spot ETFs recorded another $532 million in net inflows. This capital flow shows a significant divergence from BTC's price trend: the price oscillated within the $76,000 to $81,000 range, yet ETFs continued to see net inflows, suggesting institutions were steadily building positions during price weakness, rather than retail investors chasing momentum. As of early May, the total net asset value of US spot BTC ETFs reached $103.785 billion, accounting for approximately 6.66% of BTC's total market cap. The steadily increasing proportion of institutional holdings is fundamentally changing Bitcoin's price discovery mechanism—transitioning from a retail-dominated, highly volatile speculative asset towards an institutional allocation asset.
From a broader perspective, the deepening institutionalization process is reshaping Bitcoin's supply-demand balance. Since the approval of US spot Bitcoin ETFs in January 2024, the ETF channel has accumulated over 580,000 BTC, equivalent to roughly three years of Bitcoin network issuance. Concurrently, the supply held by long-term holders has been rising steadily since mid-February 2026, indicating that long-term investors' willingness to hold has increased, not decreased, during the price correction. This "institutional + long-term holder" dual lock-up dynamic means that the actual circulating supply of Bitcoin is continuously contracting, providing implicit price support amidst macro headwinds.
4. Bitcoin Returns to $80,000: Halving Cycle Patterns and the Bullish-Bearish Dialectic at the Current Node
At this juncture in early May 2026, Bitcoin is staging a key comeback from a deep correction, returning strongly to the $80,000 level. After dipping to lows near $60,000 in early February, BTC staged a powerful rally in early May, recapturing the $80,000 mark, representing a rebound of over 33% from the correction's low point. While this "return to $80,000" is still approximately 46% below the all-time high set in October 2025, the current correction exhibits distinctly different structural characteristics compared to the brutal bear markets of 2018 and 2022, which saw panicked retail selling and massive miner shutdowns. Key signals include: consistent net ETF inflows, rising long-term holder supply, and leading mining firms optimizing their balance sheets rather than cutting production or exiting. Collectively, these signals point towards the assessment that the current situation is more likely a "deep correction within a bull market" rather than the start of a "bull market has ended" bear phase.
From the perspective of halving cycle patterns, Bitcoin completed its fourth halving in April 2024 (block reward falling from 6.25 BTC to 3.125 BTC). Historical data indicates that the 12 to 18 months following a halving are typically the most intense period of price discovery. BTC broke its previous all-time high about 12 months after the 2012 halving; the major bull run began about 17 months after the 2016 halving; and the cycle peak was set about 12 months after the 2020 halving. Using this historical analogy, the 12-18 month window following the April 2025 halving corresponds to April 2026 to October 2026—the exact period we are entering. This suggests the current price correction could very well be part of a "shakeout and accumulation" phase after the halving, rather than a cyclical top reversal. Of course, whether this historical pattern holds in the new environment of deepening institutionalization remains highly uncertain.
Technically, the core trading range for Bitcoin after its "return to $80,000" is between $76,000 and $83,000. The $80,000 level itself is a significant psychological threshold and short-term support. The $83,000 level corresponds to the 200-day simple moving average, a critical "bull-bear boundary" contested by both sides. If BTC achieves a decisive daily close above this level, the upside target would point towards the $89,000 to $94,000 range. On the downside, $76,000 is the low tested multiple times in April 2026; a breach below this level could see the technical downside target shift to the $70,000 to $65,000 zone. Looking at momentum indicators, the RSI-7 has risen to 71.27, nearing overbought territory and suggesting short-term technical correction pressure. However, the MACD formed a bullish golden cross in mid-April, providing some momentum support for a medium-term upward move. Combining these technical signals, the most reasonable assessment for the current node is that BTC is in a "confirmation phase following the return to $80,000." Range-bound trading may persist for another 2-4 weeks until clear macro catalysts emerge.
5. Outlook: Three-Scenario Analysis and Key Observation Points
Synthesizing the three main drivers—geopolitics, Fed policy path, and institutional fund flows—the crypto market from May to July 2026 could evolve along the following three scenarios.
Scenario One (approx. 35% probability): Geopolitical Easing + Dovish Fed Signals, BTC Challenges $89,000 - $94,000. If the US and Iran reach a substantive framework agreement within the negotiation window following the suspension of the "Freedom Plan," leading to the normalization of transits through the Strait of Hormuz and falling oil prices and cooling inflation expectations, and if Warsh delivers dovish signals in his first public speech after taking office on May 15, the concurrent improvement in both drivers could trigger a "double boost" effect on the macro front: a significant recovery in risk appetite and accelerated ETF inflows. BTC could break through the $83,000 level (200-day MA) within 2-4 weeks and mount a challenge towards the $89,000 - $94,000 range. Key observation points for this scenario include: Warsh's inaugural speech around May 15, the April US non-farm payrolls report on May 8, and phased announcements from US-Iran negotiations.
Scenario Two (approx. 45% probability): Geopolitical Stalemate + Fed Maintains Wait-and-See, BTC Consolidates in $70,000 - $85,000 Range. This is the neutral scenario most fully priced into the current market. The US and Iran fail to reach a comprehensive agreement during the 4-week ceasefire period but also avoid a new large-scale military conflict, keeping the Strait of Hormuz in a "semi-blockaded" state. Chair Warsh adopts a "data-dependent" stance after taking office. In this scenario, BTC is most likely to remain in a wide-range consolidation pattern. ETF fund flows will be the most direct driver of short-term price action: if weekly net inflows stay above $300 million, prices will likely gravitate towards the upper bound; if a weekly net outflow occurs, prices will test the lower bound support. Range trading would be the most suitable strategy for most investors in this scenario.
Scenario Three (approx. 20% probability): Geopolitical Conflict Escalation + Out-of-Control Inflation, BTC Retraces to $65,000 - $70,000 Range. If the ceasefire agreement collapses entirely, Iran announces a full blockade of the Strait of Hormuz, oil prices surge past $120 per barrel, forcing Goldman Sachs to revise its year-end PCE forecast higher, and hawkish Fed officials publicly discuss the possibility of raising rates to combat inflation if necessary. This macro "perfect storm" would simultaneously hit liquidity expectations and risk appetite, potentially causing BTC to break below the psychological $70,000 level. While the probability is relatively low, if it occurs, leveraged positions in the crypto market would face systemic liquidation pressure. In this scenario, cash and short-term Treasuries represent the optimal holdings, and Bitcoin positions should only be considered after confirming a macro inflection point.
6. Conclusion: Identifying Structural Signals Amidst the Macro Fog
The crypto market in May 2026 finds itself at a historic intersection of three main drivers: geopolitics, monetary policy, and the institutionalization process. The dramatic reversal of the "Freedom Plan," the policy uncertainty surrounding the Fed chair transition, the validation period of the post-halving cycle pattern for Bitcoin, and the structural shift of persistent contra-trend accumulation through ETFs collectively form an extremely complex and rich macro landscape. For investors, navigating this phase requires distinguishing "noise" from "signals": the back-and-forth of geopolitical events and the hawkish-dovish debates among Fed officials are essentially short-term noise. While they impact prices within days or weeks, they cannot alter the medium-term trend direction pointed to by the structural signals of deepening institutionalization and the post-halving supply contraction.
Macro headwinds are often the best friend of long-term allocators. The macro pressures Bitcoin faced in May 2026—rising oil prices, the Fed's uncertain hawkish-dovish stance, and ongoing geopolitical conflict—are actually milder compared to the darkest moments of the "liquidity crisis" in March 2020 or the "FTX collapse + aggressive Fed rate hikes" of 2022. Meanwhile, the continued rise in institutional holdings, the expanding lineup of ETF products, and the fact that leading mining firms can still optimize capital structures during the downturn all quietly tell a larger narrative: Bitcoin is gradually evolving from a fringe speculative asset into a permanent member of the global asset allocation landscape. This process is fraught with volatility, but its direction is clear. We recommend focusing on three key variables: First, Warsh's inaugural speech around May 15 will determine the repricing direction for rate cut expectations. Second, substantial progress in US-Iran ceasefire talks during the 4-week window will dictate the evolutionary path of oil prices and inflation expectations. Third, if US spot BTC ETFs record net inflows exceeding $500 million for two consecutive weeks, it would be the clearest signal of accelerating institutional accumulation. The macro fog will eventually clear, and investors who maintain discipline and identify structural signals amidst the haze will be the most composed winners of the next market cycle.


