
Gate Institutional Weekly: BTC ETF Continues to See Net Inflows, Aave Lending Balance Plummets 26.7%
- 核心观点:上周加密市场呈现“谨慎乐观”格局,BTC 因地缘风险缓和及降息预期升温上涨至7.7万美元上方;链上资金向高流动性与结算型资产集中,但对复杂风险路径(如rsETH事件)的重新定价导致资金出现结构性迁移。
- 关键要素:
- BTC ETF 周净流入5.85亿美元,BlackRock的IBIT占比超八成;总资产净值突破1026.4亿美元,市场信心修复。
- 稳定币资金回流结算型资产,USDT供应量升至近2000亿美元,而收益型稳定币USDe单周净流出近20亿美元。
- rsETH事件后链上风险偏好下降,Aave 借贷余额单周暴跌26.7%,资金加速流向Spark等竞争协议,核心稳定币借款利率大幅上升。
- 衍生品市场呈现“负资金费率+高位震荡”的典型背离结构,BTC空头持续拥挤,但现货与机构买盘提供支撑,隐含波动率回升。
- 机构交易热度回升,现货交易周环比增长20.09%,CrossEx交易量与资金规模创新高(周环比分别增长79%与816%)。
Summary
• Last week, the crypto market showed a pattern of "cautious optimism," with geopolitical risks in the Middle East marginally easing and expectations for a Fed rate cut this year heating up. BTC rose from $68,000 to over $77,000, and BTC ETFs continued their net inflow trend.
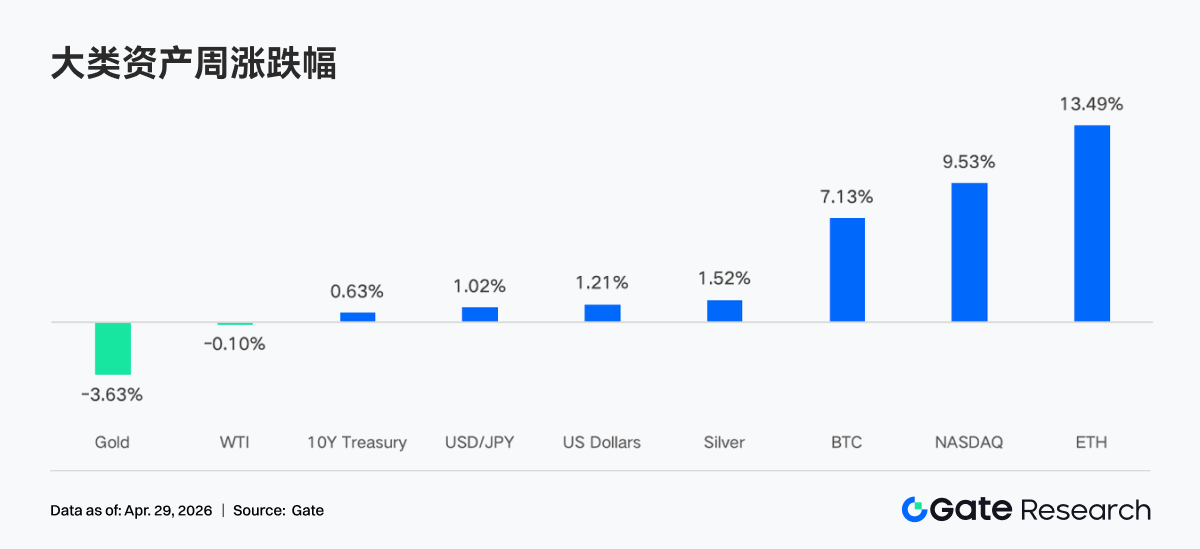
• TradFi trading activity has cooled slightly from the March risk-off peak, but gold remains the core trading asset, while the proportion of stocks and commodities has rebounded.
• On-chain capital continues to concentrate in high-liquidity and high-turnover scenarios. PancakeSwap’s weekly trading volume approached $36 billion, while the Solana ecosystem exhibited characteristics of "small-ticket, high-frequency transactions."
• Stablecoin funds are clearly flowing back into settlement-based dollar assets. USDT supply rose to nearly $200 billion, while the yield-bearing stablecoin USDe saw net outflows of nearly $2 billion in a single week.
• Following the rsETH incident, on-chain risk appetite has notably declined. Aave’s lending balance plummeted by 26.7% in one week, borrowing rates for core stablecoins surged, and capital accelerated its flow towards competing protocols like Spark.
• The derivatives market displays a classic divergence structure of "negative funding rates + high-level volatility." BTC perpetual shorts remain crowded, but spot and institutional buying continue to provide support. Meanwhile, implied volatility and options trading volume have both rebounded.
• On the institutional and platform side, spot trading volume increased by 20.09% WoW, with 30+ new business opportunities added. CrossEx trading volume and funds under management hit new highs, up 79% and 816% respectively, as institutions accelerate cross-exchange arbitrage and hedging. The Trading System 3.0 architecture is advancing, infrastructure continues to improve, and institutional capital onboarding is speeding up.
1. Market Focus
Last week, the overall sentiment in the crypto market was characterized as "cautious optimism." Key drivers included a marginal easing of geopolitical tensions in the Middle East, heightened expectations for a Fed rate cut, and sustained institutional buying which effectively offset profit-taking pressure from short-term holders. During this period, BTC rose from around $68,000 to over $77,000, a gain of approximately 12%.
Trump extended the ceasefire agreement with Iran, suggesting a diplomatic approach to resolve the conflict. However, negotiations for a longer-term peace deal are currently deadlocked. The Strait of Hormuz, a conduit for about one-fifth of the global oil supply, remains closed, pushing oil prices back up to $95 per barrel. In recent weeks, the market has largely priced in the tail risks of the Middle East situation. BTC and ETH have continued to rise, with ETH showing greater resilience due to ecosystem expectations, and stock markets have also recovered from the March sell-off. Bond yields remain stable ahead of the FOMC meeting, with the 10-year Treasury yield around 4.30%. The US Dollar Index is hovering near 98, entering a consolidation phase after retreating from above 100. Gold is under pressure due to the dollar and interest rates. Meanwhile, expectations for a Bank of England rate hike are rising, with GBP rebounding to around 1.36. A 25 basis point hike before year-end could weaken key structural support for the USD.
While the FOMC meeting this week is highly likely to keep rates unchanged, the market will focus on changes in the statement's language regarding inflation, the impact of the war, and the balance of risks, as well as whether there are signals for an adjustment to the long-term neutral rate of 3.1%. Market expectations for the Fed's rate cut path this year have notably increased. The probability of a 25 basis point cut before December has risen to 39%, up from 23% previously. This change is partly influenced by the DOJ dropping its investigation into Powell, further clearing the way for Warsh to succeed as Fed Chair, and also reflects market expectations that if oil prices return to normal ranges, the Fed will have more room for easing in the second half of the year.
2. Liquidity Analysis
2.1 BTC ETF Net Asset Value Exceeds $102.64 Billion
Last week, BTC ETFs continued the net inflow trend that began on April 14th, recording net inflows on 4 trading days over the week, with a total weekly net inflow of $585 million. ETH ETFs saw a total weekly net inflow of $87.3 million, slowing down from the previous week's pace, but overall market sentiment remains optimistic, with institutional investors showing strong long-term holding conviction.
Top Products by BTC ETF Net Flow:
1. IBIT (BlackRock) Weekly Net Inflow: $476.6M
2. ARKB (ARK 21Shares) Weekly Net Inflow: $59.6M
Top Products by ETH ETF Net Flow:
1. ETHA (BlackRock) Weekly Net Inflow: $61.9M
2. ETHB (Bitwise) Weekly Net Inflow: $47.8M
Capital flows show a clear concentration effect among top players. BlackRock's IBIT dominated with a $476 million weekly net inflow, accounting for over 80% of the total BTC ETF inflows for the week. Similarly, ETHA led the ETH ETF market with $61.9 million in inflows. Concurrently, Grayscale's GBTC and ETHE continue to face persistent capital outflows, indicating that the structural shift of investors from higher-fee legacy products to lower-fee new products is not yet complete.
As of April 24th, the total net asset value of US spot BTC ETFs exceeded $102.64 billion, representing approximately 6.5% of Bitcoin's total market cap. The total net asset value of ETH ETFs is approximately $13.79 billion, accounting for about 4% of Ethereum's total market cap. In terms of capital flow trends, the year-to-date net flow for BTC ETFs has turned positive to approximately $1.85 billion, indicating market confidence is recovering. However, whether it can break through the historical cumulative net inflow high will depend on the outcome of the tug-of-war between bulls and bears around the $80,000 mark.
2.2 TradFi Liquidity
• TradFi Perp DEX: Trading volume in the past week continued to decline slightly from previous weeks, with the latest total weekly turnover falling to around $10 billion. This indicates that the high trading activity driven by risk aversion earlier is gradually cooling down, following the marginal easing of the Middle East situation and the recovery of market risk appetite. From an asset structure perspective, commodities still dominate, with gold-related asset trading remaining the market core and accounting for the majority of trading volume. However, compared to the peak in March, the share of commodities has narrowed somewhat, while the share of equity assets like indices, ETFs, and stocks has slightly rebounded. This suggests that capital is starting to gradually shift from single safe-haven trades to a broader range of risk assets.
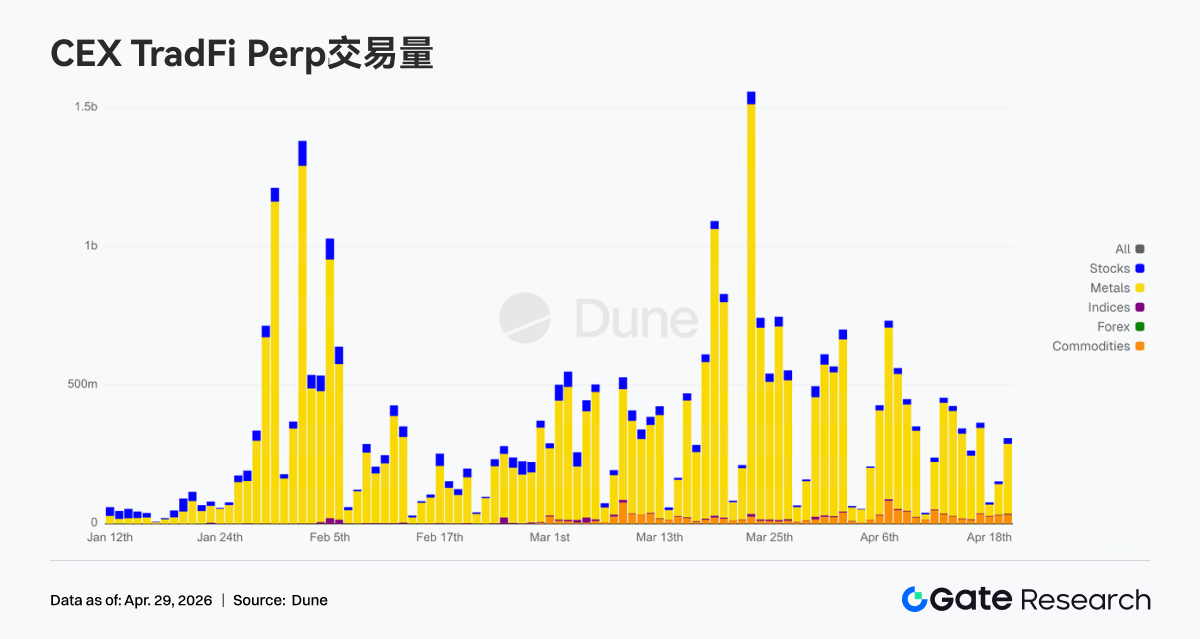
• TradFi Perp CEX:Since April 20th, overall market trading activity has retreated from its March peak but remains in a relatively active range. Looking at the transaction structure, precious metals like gold still dominate. However, compared to the peak of over $1.5 billion in a single day in mid-to-late March, recent overall volume has notably contracted, mostly fluctuating between $300 million and $500 million per day. This reflects a market sentiment shift from extreme risk aversion to a phase of digestion amidst volatility. Meanwhile, the proportion of stocks and commodities has increased slightly, indicating that capital is diversifying from single gold trades to a broader range of TradFi assets, with some users beginning to re-allocate to equities and cyclical assets.
• CEX TradFi Asset Classes:In the past week, the number of TradFi asset classes on CEXs continued to expand. The total number of TradFi asset classes (only counting TradFi and CFD sectors, excluding perpetual contracts) on three major CEXs increased from 955 to 956, a 0.1% week-over-week increase. Among them, the growth in stock classes was the most significant, rising from 590 to 594. Last week, only Gate added 4 new stock TradFi products among mainstream exchanges, driving a 0.7% overall week-over-week increase.
• TradFi Order Book Depth:We selected XAUT, the TradFi asset with the highest trading volume, to analyze its order book depth (Delta). Between April 20th and 22nd, market depth Delta showed several large negative values, approaching -$600,000 around the 21st. Concurrently, the XAUT price also quickly fell from around $4.78K to below $4.70K, indicating a periodic cooling of gold-related risk aversion. However, after the 22nd, the order book structure clearly turned bullish. Positive Delta values continued to expand, with unilateral bid depth frequently maintained in the $300,000 to $800,000 range. Around the 23rd, bid depth even peaked near $1 million, suggesting a significant increase in underlying support capital. Overall, XAUT is currently in a phase of "weak price but improved liquidity absorption." This indicates that while allocation demand for gold-related assets persists amidst the unresolved Middle East situation and rising rate cut expectations, short-term chasing momentum is significantly weaker than during the previous risk-off peak.
3. On-Chain Data Insights
3.1 Transaction Flow Returns to Spot and High-Turnover Scenarios, Liquidity Further Concentrates on Top Protocols
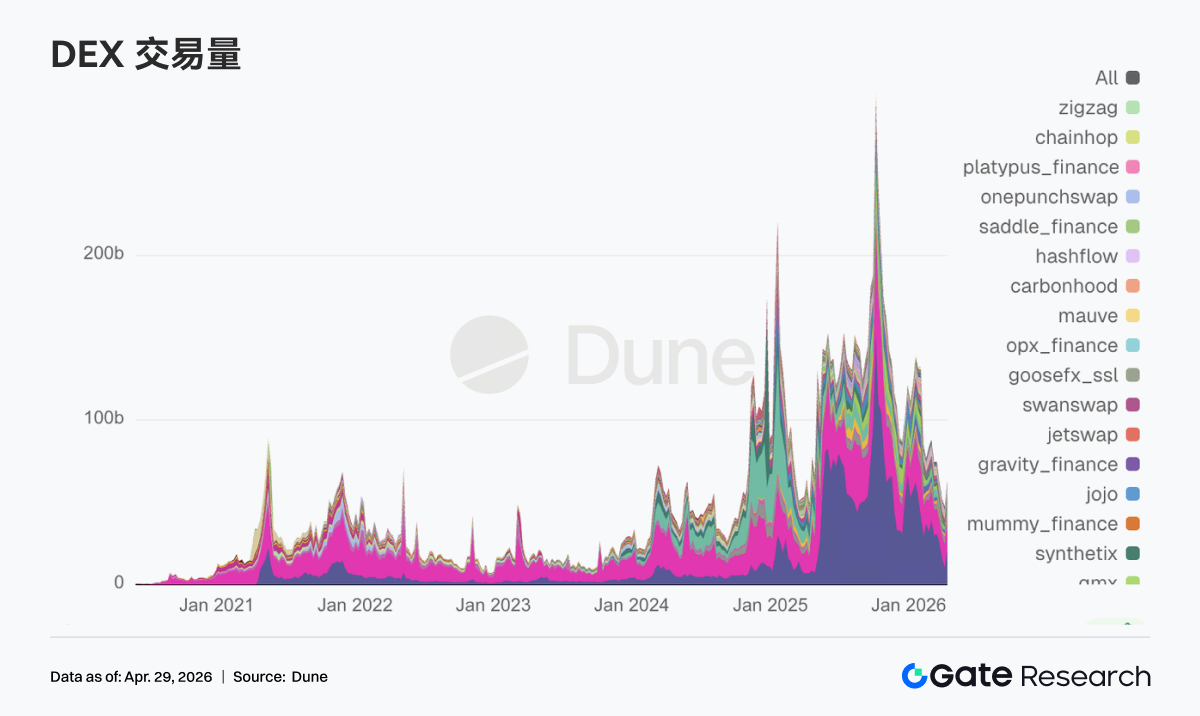
This week, PancakeSwap's trading volume reached nearly $36 billion, significantly higher than Uniswap's $18.3 billion. Aerodrome, Curve, and Fluid were in the $2.5-$3.5 billion range. On the Solana side, Raydium and Meteora saw about $1 billion in volume but over 100 million transactions, showing a pattern of small-ticket, high-frequency trades. Trading volume remains at high levels, and on-chain transaction demand hasn't contracted significantly. However, as capital moves from credit-based DeFi to low-fee, high-turnover spot trading scenarios, liquidity is further concentrating on top pools.
3.2 Stablecoin Capital Concentrates on Settlement-Based Dollar Assets, USDe Sees Nearly $2 Billion Weekly Net Outflow
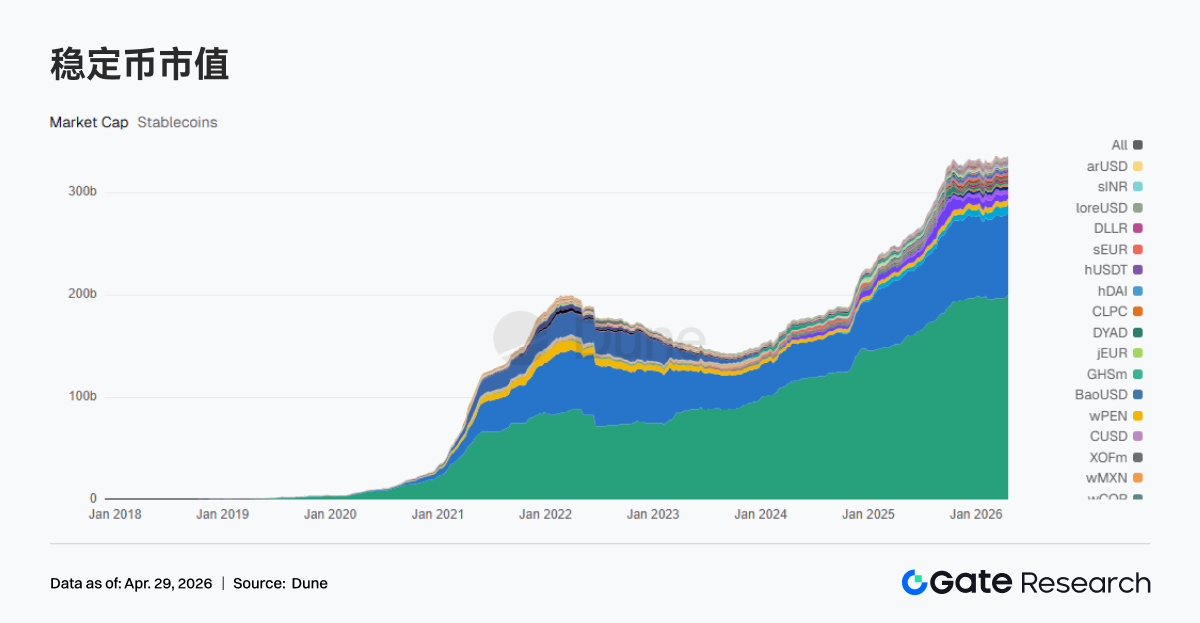
Over the past week, USDT supply rose to $199.959 billion (+$2.418 billion WoW); USDC was $80.391 billion (-$184 million WoW); UShDS was $8.136 billion (+$340 million WoW); USDe was $4.410 billion (-$1.997 billion WoW); PYUSD was $2.750 billion (-$677 million WoW). This week, stablecoin capital overall concentrated on directly settleable, quickly deployable dollar assets. Yield-bearing and synthetic stablecoins saw significant net outflows, with USDe experiencing nearly $2 billion in net outflows. Top stablecoins are all reinforcing their settlement layer and compliant asset priorities. For instance, Circle and OSL launched 1:1 USD/USDC conversion and unified margin system, while Tether froze $344 million in USDT in cooperation with law enforcement.
3.3 LST Risks Begin Pricing Complex Pathways, Minor Declines in Top Protocols
Leading ETH and Solana LST protocols like Lido, Rocket Pool, Jito, and Jupiter Staked SOL saw minor outflows ranging from 2% to 5% over the past week. Following the rsETH incident, the market hasn't negated staking yields but is repricing the risks associated with cross-chain and re-staking pathways. The size of top LST protocols decreased slightly, while high-complexity, yield-enhancing pathways experienced more significant pullbacks. Lido, a leading LST protocol, recently proposed using up to 2,500 stETH for a bailout, further illustrating the broad impact of systemic risks and the need for collaborative efforts across related DeFi protocols.
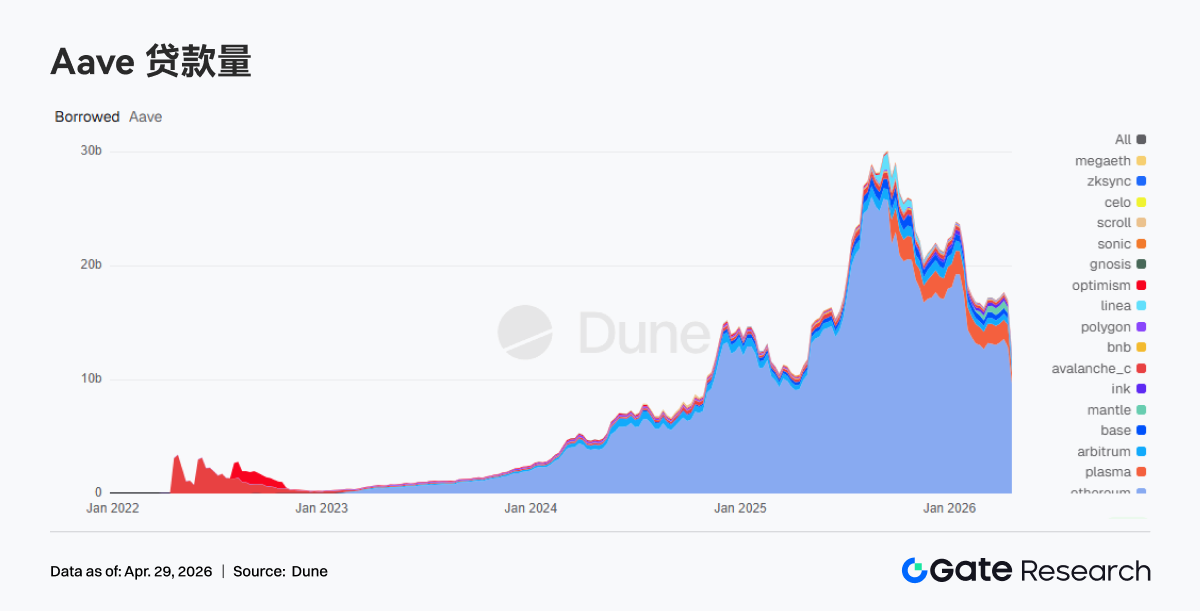
3.4 Aave Lending Balance Plummets, Capital Flees to Competitors
Aave's total lending balance dropped from $17.027 billion the previous week to $12.481 billion, a decrease of $4.546 billion or -26.7% WoW. On Ethereum Mainnet, it fell from $12.880 billion to $9.671 billion, and on Plasma from $1.930 billion to $942 million. The lending balance showed a step-like decline, characteristic of a risk event triggering capital withdrawal. After the rsETH event, Aave froze rsETH/wrsETH across multiple chains and restricted new WETH borrowing, further accelerating position contractions. Most of this capital didn't leave the chain but migrated to Aave's competitor, Spark.
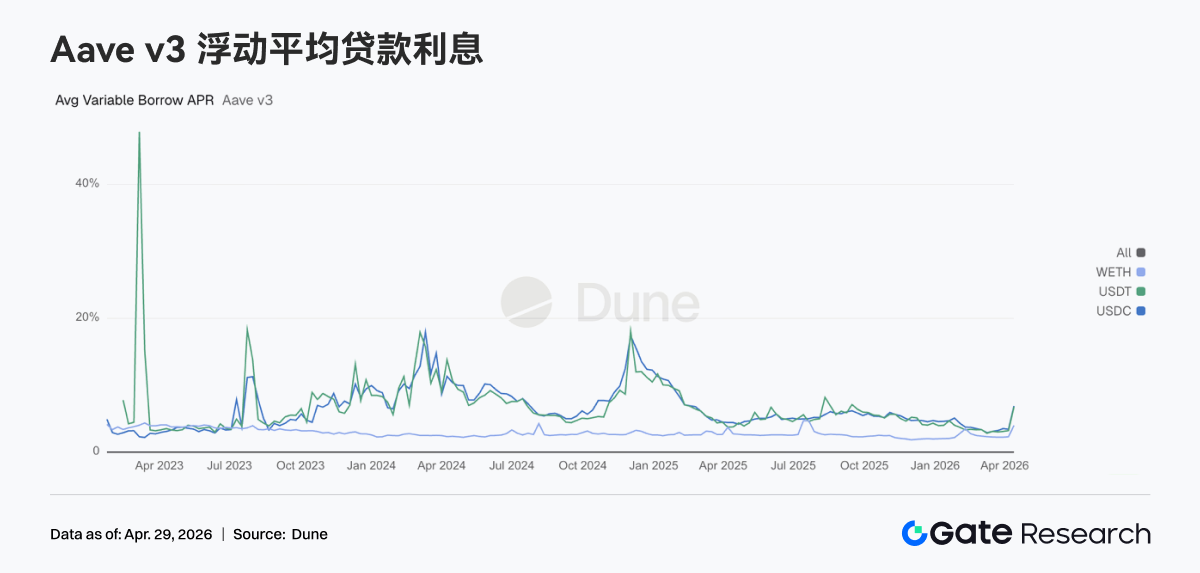
3.5 Liquidity Stress Intensifies, Aave Core Asset Borrowing Rates Surge
Over the past week on Aave Ethereum V3, the average borrowing rate for USDC rose to 12.50%, up from 6.91%; for USDT, it rose to 13.30%, up from 6.76%; and for WETH, it rose to 5.21%, up from 4.00%. The rate increases reflect a contraction in stablecoin liquidity. Due to the ongoing risk contagion from the rsETH security incident, utilization rates for core assets like USDC in the Ethereum Core market approached 100%. Some liquidity became unavailable for withdrawal, keeping borrowing rates elevated. Market demand for withdrawable dollar liquidity has significantly increased, and the chain is entering a phase of liquidity repair. However, with the gradual progress of joint bailout efforts, asset rates are expected to return to normal ranges in the coming weeks.
3.6 Revenue Flows Back to Settlement and Volatility Linkages, Lending Protocols Benefit
Revenues for Tether and Circle were largely flat; Hyperliquid and Pump saw single-week declines of over 10%; Aave, amidst interest rate volatility, saw its weekly revenue grow over 40% to nearly $2.9 million. Stablecoin issuance and settlement remain the most stable source of cash flow. Revenue from trading protocols is starting to diverge, while lending protocols capture more revenue during volatility and position restructuring. The rise in Aave's revenue alongside a decline in lending scale also reflects position shortening and faster capital turnover.
4. Derivatives Tracking
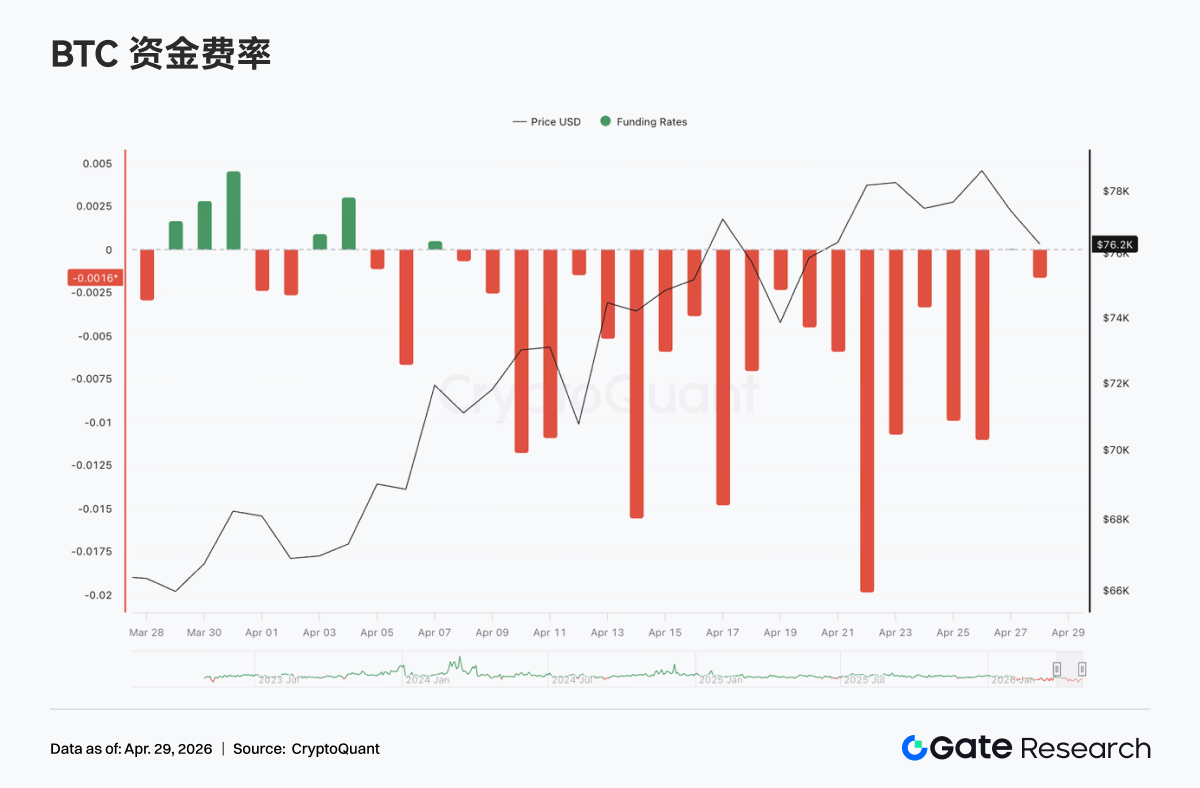
4.1 BTC Funding Rate Deeply Negative Coupled with Rising OI, Short Squeeze Structure Continues to Strengthen
Over the past week, the BTC perpetual funding rate remained mostly in negative territory, with multiple instances of extreme negative values (approaching -0.02%) in mid-to-late April, indicating continued dominance of short-side sentiment and high short crowding. Correspondingly, the BTC price has been oscillating upwards since early April, surging to around $78K around April 20th. This presents a classic divergence structure of "deeply negative funding rates but prices holding at high levels," suggesting shorts are under upward price pressure while continuously paying funding fees.
Meanwhile, Open Interest (OI) showed an overall upward trend, steadily climbing from ~$21B to above $25B. Although there were periodic pullbacks, the overall baseline clearly shifted higher. The combination of persistently negative funding rates and rising OI implies that as prices oscillated higher, new positions added to the market were predominantly shorts, forming a classic divergence of "shorts adding positions + price not falling."
Around April 17th and 22nd, OI saw rapid spikes, corresponding to price surges and high-level volatility, while funding rates remained deeply negative. This indicates that shorts did not effectively stop out during the price increase; instead, they continued adding positions. This combination of "negative funding rate + OI expansion + price strengthening" typically means short squeeze momentum is accumulating. A further price breakout from the range could trigger accelerated moves driven by short covering. However, high OI coupled with high divergence structure also means elevated market leverage. If the price turns weak, the deleveraging process could equally amplify volatility.
4.2 Options Volume Exhibits Phased Expansion, Monthly Contracts Dominate Structure
BTC options market volume showed a phased expansion characteristic, with notable peaks around April 17th and 23rd, where daily volumes were significantly higher than the weekly average. Structurally, monthly options remain dominant, consistently holding a larger share than weekly and daily options. This indicates market participants continue to favor


