
Two key battles are being fought simultaneously, as BTC and HYPE approach a critical directional decision.
- Core View: This week, the crypto market is at a critical juncture of high-level consolidation. Whether HYPE can break through the previous high of $45.76 will determine the continuation of the daily V-wave structure; Bitcoin is facing a key watershed test at $79,500-$80,600. A breakout or a pullback here will dictate the direction of the next directional move.
- Key Factors:
- HYPE has rebounded from Endpoint 32 ($38.88) and needs to effectively break $43.17 and firmly hold above the previous high of $45.76 to continue the daily V-wave uptrend. If the rebound fails to make a new high, it could signal a trend reversal and initiate a daily adjustment.
- Bitcoin's D-wave rebound has lasted approximately 80 trading days, reaching the upper trendline of the ascending channel and the dual resistance zone of $79,500-$80,600. This area is a core watershed within the daily adjustment structure, making a direct breakout difficult.
- On the 4-hour timeframe, Bitcoin's price has completed a full 7-segment structure. The spread trading model has triggered a top warning, and the momentum quantification model shows a bearish divergence signal, indicating a high probability of a pullback after hitting resistance.
- In terms of trading strategy, the medium-term stance should shift to being flat and waiting. For short-term trading, use 30% of capital to trade the spread based on support and resistance levels. For Bitcoin, consider shorting upon encountering resistance in the $79,500-$80,600 area, or shorting on a break below the $76,000 support level.
- Last week, short-term HYPE long positions yielded a 3.25% gain. Previously, a medium-term Bitcoin short position was closed at $75,500, accumulating a total profit of approximately 15.17%.
This week, the crypto market continues its high-level consolidation pattern, with increasing divergence between bulls and bears, and a directional move seems imminent. After HYPE found support and rebounded at pivot 32 ($38.88), whether it can break through $43.17 and challenge the previous high of $45.76 will be key to sustaining the daily wave V structure. Meanwhile, BTC, having completed its D-wave rebound, faces a critical test at the core watershed zone of $79,500 to $80,600: A breakout signals a shift; resistance means a pullback. Once the direction is clear, the market could exhibit a relatively pronounced trending move.
While opportunities exist in the current market, risks are also present. Avoid chasing highs and selling lows. Only by relying on clear structural analysis and strict discipline can one capture opportunities and steadily navigate the volatile environment.
Core Views for This Week's Trading:
- In-depth analysis of HYPE's hourly structure (detailed in Part 1)
- HYPE weekly forecast and short-term trading strategy (detailed in Part 2)
- BTC multi-timeframe structure analysis (detailed in Part 3)
- BTC weekly forecast and medium/short-term trading strategy (detailed in Part 4)
Last Week's Strategy & Core Views: Market Verification:
- HYPE Short-term Trade Result: Last week, an HYPE short-long trade (1x leverage) yielded a profit of approximately 3.25% (see Table 1 for details).
- BTC Medium-term Trade Result Verification: Last week, the BTC medium-term strategy executed a planned position closure. After the price held above the Bull/Bear Ribbon, we closed all medium-term short positions (opened near $89,000, 1x leverage) around $75,500. This trade ultimately realized a profit of approximately 15.17%.
- BTC Weekly Forecast Verification: In last week's article, we stated the market would maintain a wide range consolidation between $73,500 and $79,000. Current market action has validated this forecast.
1. HYPE: In-depth Analysis of Hourly Structure
HYPE_4H Candlestick Chart
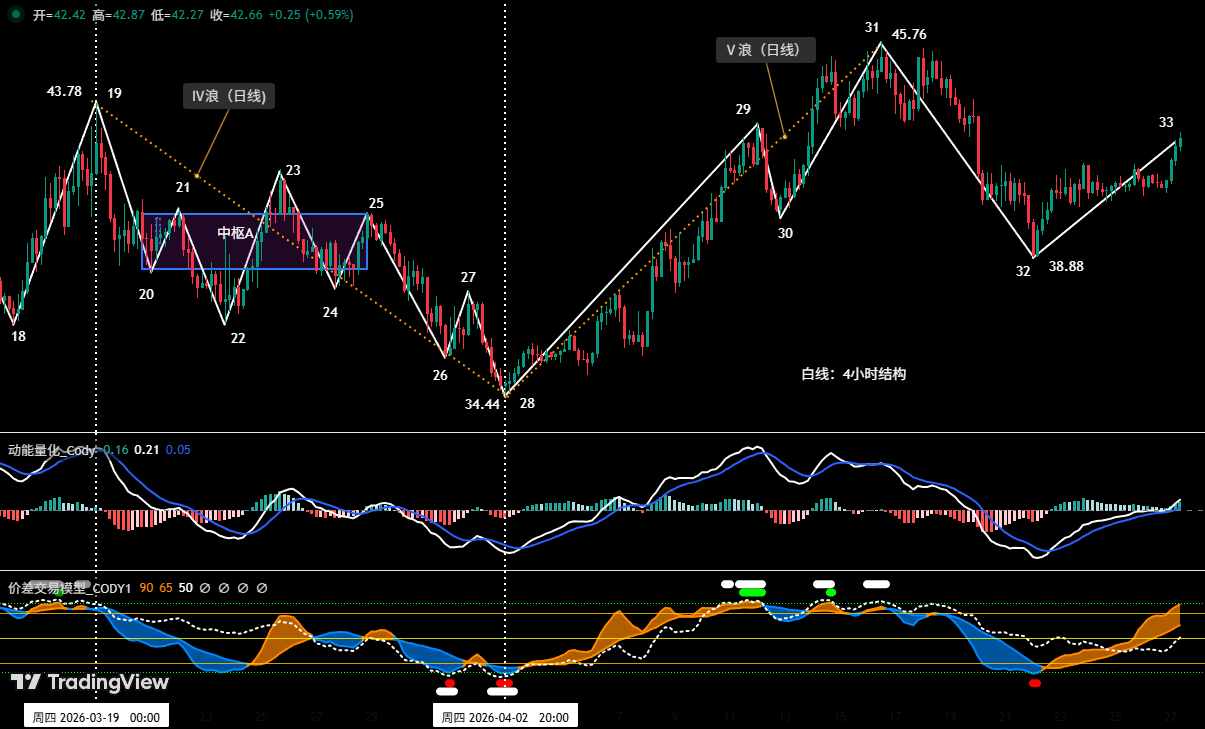
Figure 1
1. As shown in Figure 1, the daily Wave V uptrend starting from the April 2 low of $34.44 can be further broken down into a five-segment upward structure on the 4-hour timeframe: 28-29, 29-30, 30-31, 31-32, 32-33. The market is currently operating within the 32-33 upward segment.
2. The 4-hour chart shows a key development in price action last week: Pivot 32 ($38.88) broke down quickly past Pivot 30 ($40.17). Subsequently, the market found buying support near the strong support zone around $38.50, pushing the price back above $40.17. The focus now shifts to the sustainability of this rebound:
- If the price can continue rising, sequentially breaking through $43.10 and the previous high of $45.76, the daily Wave V uptrend initiated from the April 2 low will be confirmed to continue.
- If the current rebound lacks strength and fails to make a new high, it could form a classic reversal structure – "pullback breaks the prior low, rebound fails to make a new high". If this pattern is confirmed, it would suggest the daily uptrend starting from January 21 is likely exhausted, potentially ushering in a daily-level correction phase.
2. HYPE: This Week's Forecast and Short-term Strategy
1. HYPE Weekly Price Forecast:
Core view for HYPE this week: Focus on the momentum and height of the rebound starting from Pivot 32 ($38.88).
If the rebound is strong, with the price effectively breaking and holding above the previous high of $45.76 (Pivot 31), it indicates ample buying power, extending the daily Wave V uptrend and potentially opening new upside room, with the next resistance around $50.
If the rebound is weak and the price fails to surpass the $45.76 high, be wary of a "rebound fails to make new high" technical pattern. This could signify that the momentum of the daily uptrend started from the January 21 low is waning, potentially making $45.76 the peak of this rally, and leading to a daily-level correction or consolidation.
2. HYPE Short-term Trading Strategy for This Week:
- Based on the forecast of an overall uptrend, short-term operations should follow the principle of "Trade with the trend, buy on dips."
- Using signals from our proprietary quantitative models, utilize the 30-min/60-min chart as the operating timeframe, allocating 30% of capital to capture long entry opportunities.
- Entry Strategy: If HYPE's price can effectively break and hold above $43.17 this week, combined with buy signals triggered by our two models, consider entering long with position size below 30%. Strictly adhere to stop-loss discipline.
3. Bitcoin: Multi-Timeframe Structure Analysis
1. BTC Daily Structure Analysis: (Based on price action after the February 6, 2026 low)
Bitcoin_Daily Candlestick Chart:
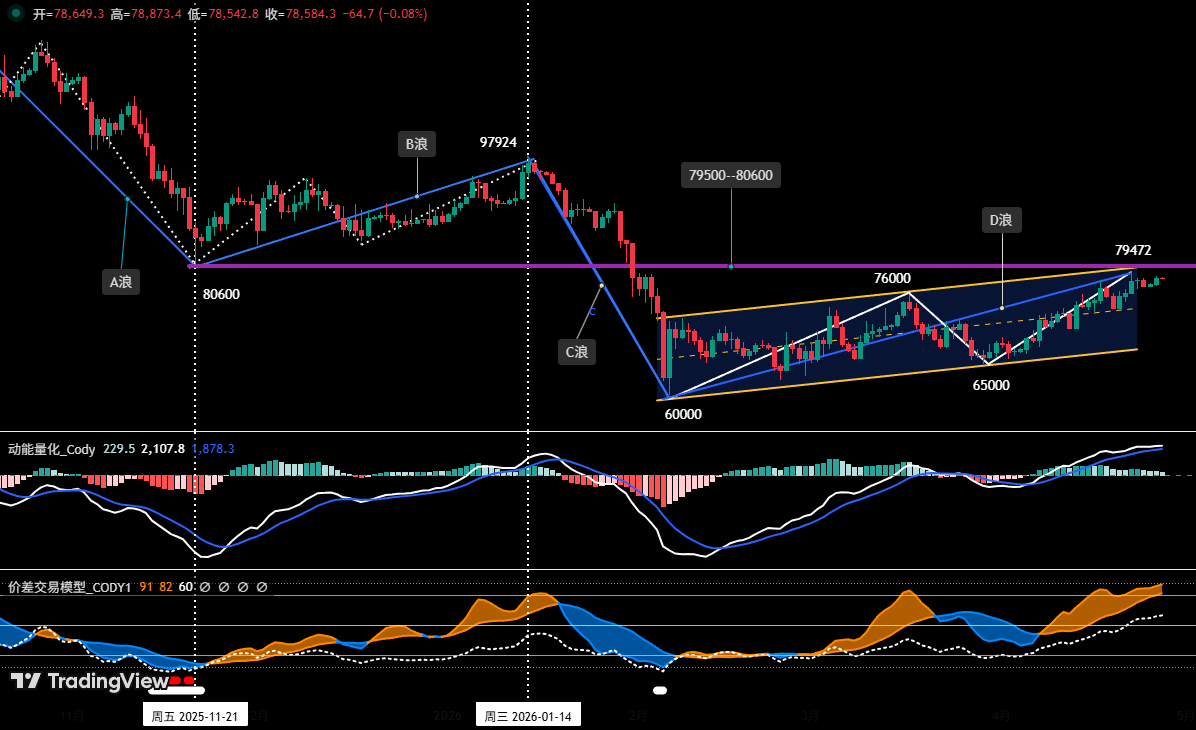
Figure 2
Looking at the daily structure, the correction from the October 2025 high of $126,200 down to the February 6 low of $60,000 has formed a clear A-B-C three-wave structure. Notably, $80,600 was not only a significant low on November 21, 2025, but also the launch point for the subsequent B-wave rally, giving it major technical significance. Therefore, the current price is facing resistance from the $79,500 to $80,600 zone, which acts as the core "watershed" for the market.
Wave D (Rebound Wave): Based on daily structure analysis, the bounce from the February 6 low of $60,000 can be tentatively defined as Wave D (Rebound Wave). This rebound has been running for approximately 80 trading days and reached a new rally high of $79,472 on April 22.
As shown in Figure 2, this Wave D rally has consistently moved within a clear ascending channel: Its lower trendline connects the lows of February 6 and March 29, while the upper trendline is drawn parallel to the lower trendline through the high of March 17. The price is currently near the upper trendline.
Summary: The current price faces dual resistance from the channel's upper trendline and the $79,500-$80,600 resistance zone, suggesting a direct breakout will be difficult. Special attention should be paid to whether the $79,500-$80,600 zone can be effectively broken. This will determine whether the rally from the February 6 low is a technical correction or a trend reversal, and consequently, whether $60,000 is confirmed as the final low of this daily correction.
2. BTC Hourly Structure In-depth Analysis: (Using 4-hour timeframe)
Bitcoin_4H Candlestick Chart
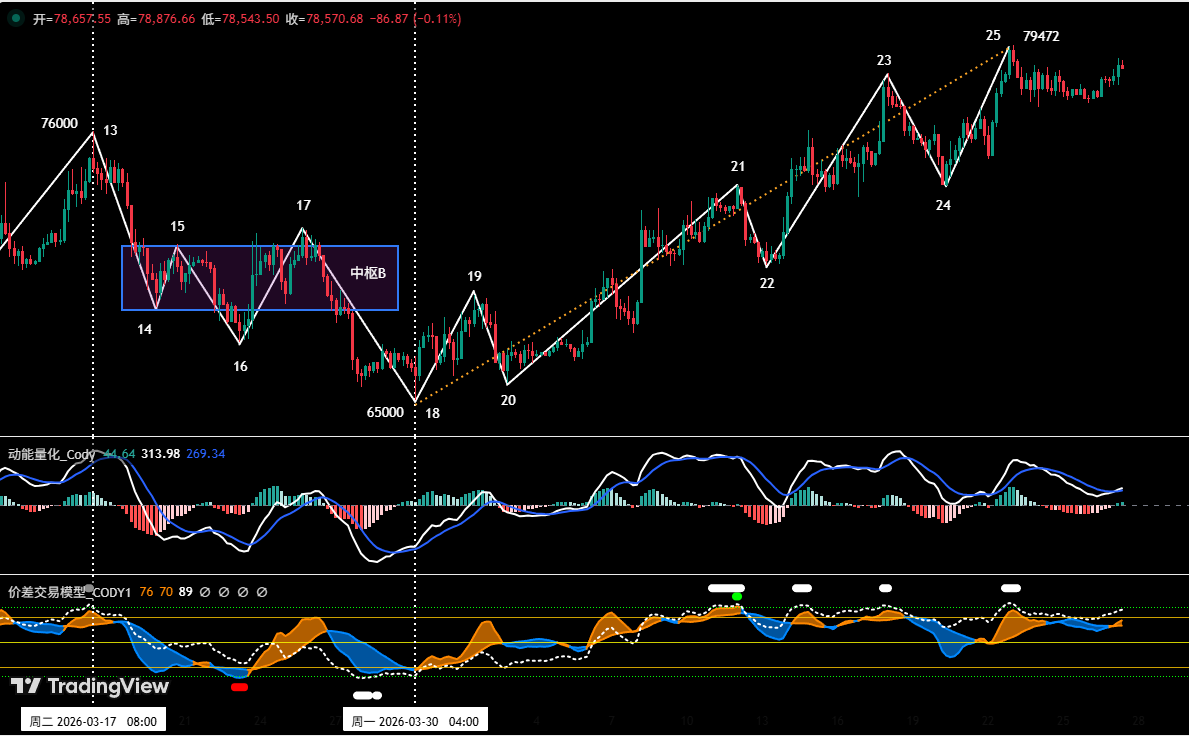
Figure 3
Based on the price action following the March 30 low of $65,000. As shown in Figure 3, BTC has been oscillating upwards since the $65,000 low. From Pivot 18 to Pivot 25, a total of 7 segments have formed: 18-19, 19-20, 20-21, 21-22, 22-23, 23-24, 24-25.
Figure 3 indicates: Firstly, the structure from Pivot 18 to Pivot 25 is relatively complete (7 segments executed). Secondly, from our proprietary Spread Trading Model, Pivot 25 has triggered a top warning signal (white dot). Thirdly, from the Momentum Quant Model, comparing the upward momentum of adjacent segments 22-23 and 24-25, the model has issued a bearish divergence signal.
Summary: Based on the hourly structure and the three points above, BTC is more likely to face resistance here and undergo a pullback.
4. Bitcoin: This Week's Forecast and Trading Strategy
1. BTC Weekly Price Forecast:
Core View for This Week: Focus on the outcome of testing the key resistance zone of $79,500~$80,600.
- If the price breaks upwards, wait for a confirmed hold above before seeking entries;
- If the price faces resistance and pulls back, the first support level is around $76,000. If this level is broken effectively, the market could begin a daily-level correction.
2. Key Resistance Levels:
• First Resistance Zone: $79,500~$81,000 (Near the November 2025 low)
• Second Resistance Zone: $83,500~$84,500 (Previous dense trading zone for bulls/bears)
3. Key Support Levels:
• First Support: ~$76,000 (Previous rally high)
• Second Support: ~$73,500 (Previous key support)
• Third Support Zone: $69,500~$70,500 (Previous key support zone)
4. Weekly Trading Strategy (Excluding sudden news impacts)
①. Medium-term Strategy:
Bitcoin _ Daily Candlestick Chart: (Position Monitoring Model)
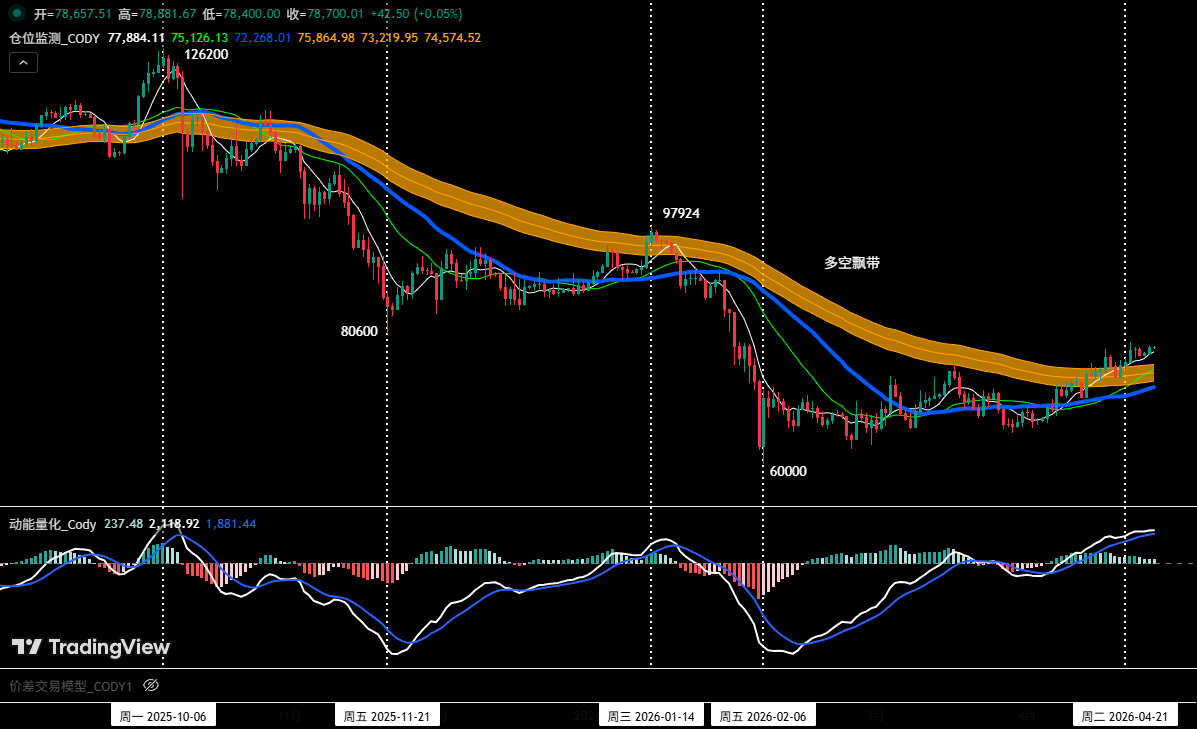
Figure 4
Position Monitoring Model: As shown in Figure 4, the current price has held above the Bull/Bear Ribbon. According to our strategy rules, we will pause new medium-term positioning this week and remain in cash, awaiting a clearer direction.
②. Short-term Strategy: Utilize 30% of capital, set stop-losses, and seek "spread" trading opportunities based on support and resistance levels. (Using 30-min/60-min timeframe).
③. Based on the assessment that the market is in high-level consolidation with weakening upward momentum, short-term operations will continue to follow the principle of "Trade the trend short." To dynamically respond to complex market developments, we will strictly follow signals from our proprietary trading model and prepare two specific action plans, A/B.
• Plan A: Short on Resistance, Sell Rallies.
• Entry: Trigger a short entry signal as the price rallies into the $79,500~$80,600 zone and combines with the model's top signal. Establish a 30% short position.
• Risk Management: Initial stop-loss set above $81,000.
• Exit: Gradually close positions for profit as the price declines near key support levels, combined with model signals.
• Plan B: Trend Breakout Short.
• Entry: If the price continues to correct and effectively breaks below the support near $76,000, combine with the model's top signal to establish a 30% short position.
• Risk Management: Initial stop-loss set above $77,500.
• Exit: Gradually close positions for profit as the price drops towards support levels, combined with model signals.
5. HYPE: Trade Review
1. Short-term Trade Review: (See Table 1)
Strictly following the operational plan and signals from our proprietary Spread Trading Model and Momentum Quant Model, one short-term long trade was executed last week, yielding a profit of 3.25%.
2. HYPE Short-term Trade Summary: (Leverage*1)

Table 1
3. Short-term Trade Review: (See Figure 5)
Entry Strategy: Firstly, the preceding price action had completed a full 5-wave corrective structure. Secondly, the Spread Trading Model had issued a strong bottom warning signal (red dots, white dots). Thirdly, the Momentum Quant Model triggered a bullish divergence signal. Consequently, a 30% long position was established at $39.91.
Exit Strategy: The price faced resistance near $42, and simultaneously, the Momentum Quant Model triggered a bearish divergence signal. Therefore, all positions were closed near $41.21.
Summary: This trade successfully yielded a profit of approximately 3.25%.
HYPE_60M Candlestick Chart: (Momentum Quant Model + Spread Trading Model)
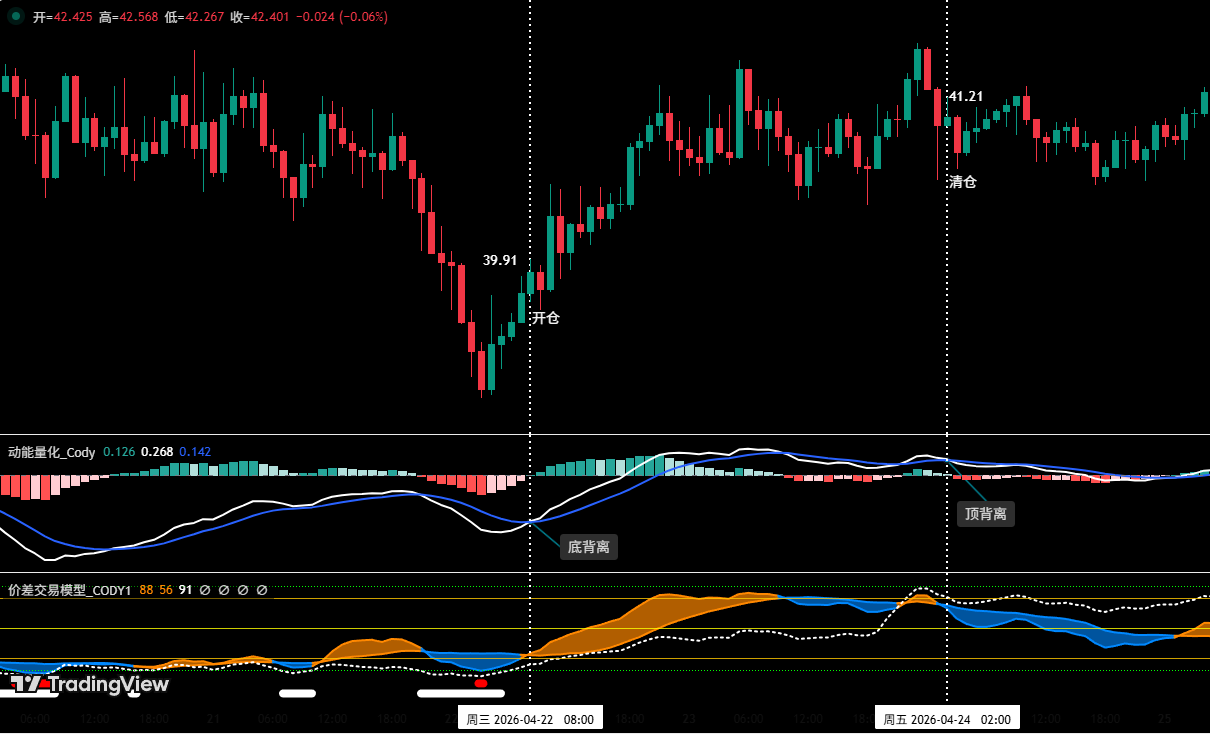
Figure 5 (Short-term Trade Illustration)
6. Special Reminders
- Upon Entry: Immediately set the initial stop-loss.
- When Profit Reaches 1%: Move stop-loss to entry cost price (breakeven) to protect capital.
- When Profit Reaches 2%: Move stop-loss to the 1% profit level.
- Continuous Tracking: For every subsequent 1% increase in profit, move the stop-loss up by 1% to dynamically protect and lock in gains.
Financial markets are highly dynamic; all analysis and trading strategies require continuous adjustment. The views, analysis models, and strategies mentioned in this article are solely based on personal technical analysis and are intended as personal trading logs only. They do not constitute any investment advice or operational basis. Market risk is significant; invest carefully. Do not make decisions solely based on this content.


