
$55,000-$79,000: Bitcoin's 'Survival in the Cracks' Range
- Core View: The Bitcoin market is currently in a structurally defensive state, with prices suppressed within a key cost range. There is a lack of active buying demand for breakthroughs, making it highly likely to maintain a range-bound consolidation pattern in the short term.
- Key Factors:
- Prices are squeezed between the real market mean of approximately $79,200 and the realized price of around $55,000. The $60,000-$72,000 range is currently the main support and accumulation zone.
- Significant trapped positions exist in the upper regions of $82,000-$97,000 and $100,000-$117,000, forming notable resistance for rebounds.
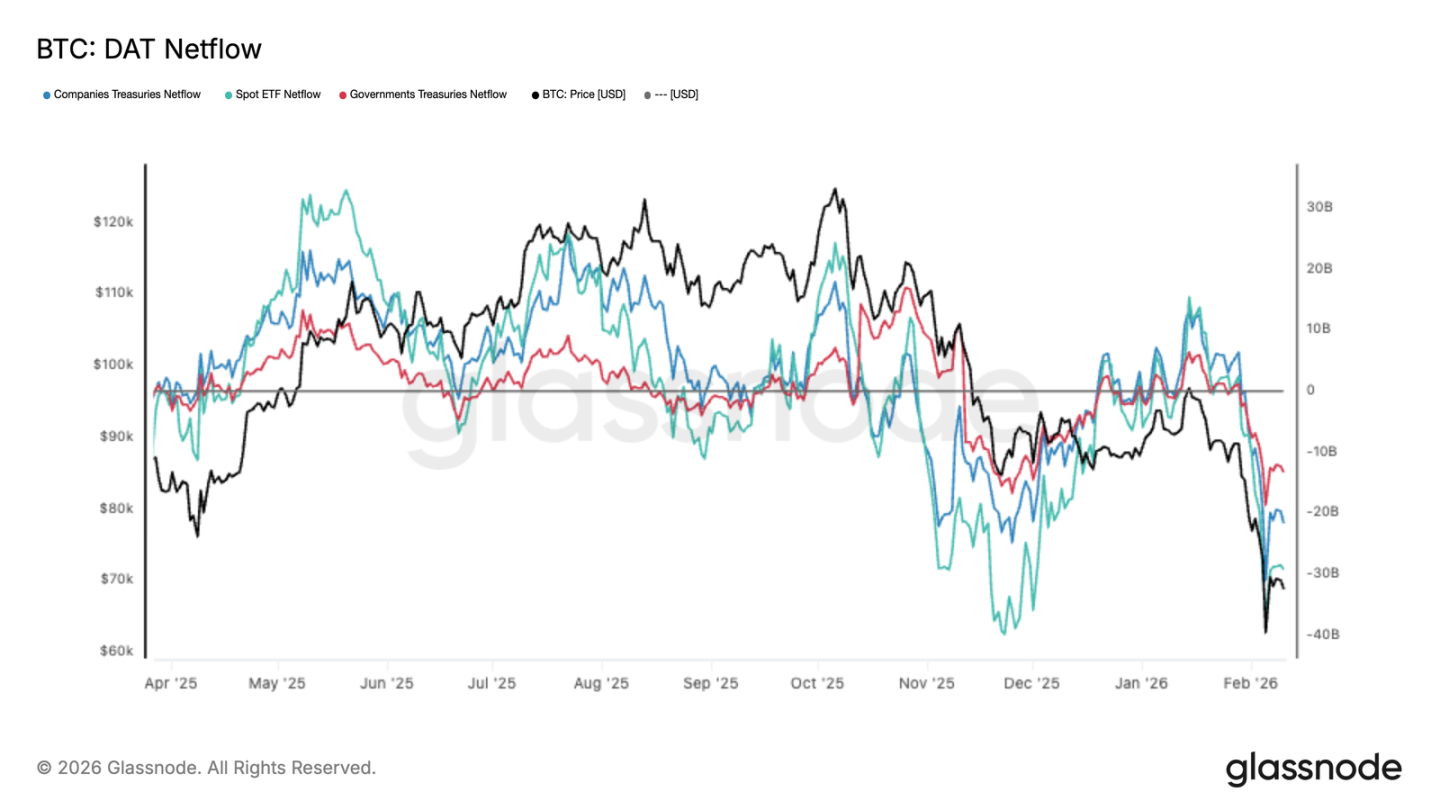
- Institutional capital (including ETFs, corporations, governments) is experiencing synchronized net outflows, indicating an overall market contraction of risk exposure and insufficient spot buying support.
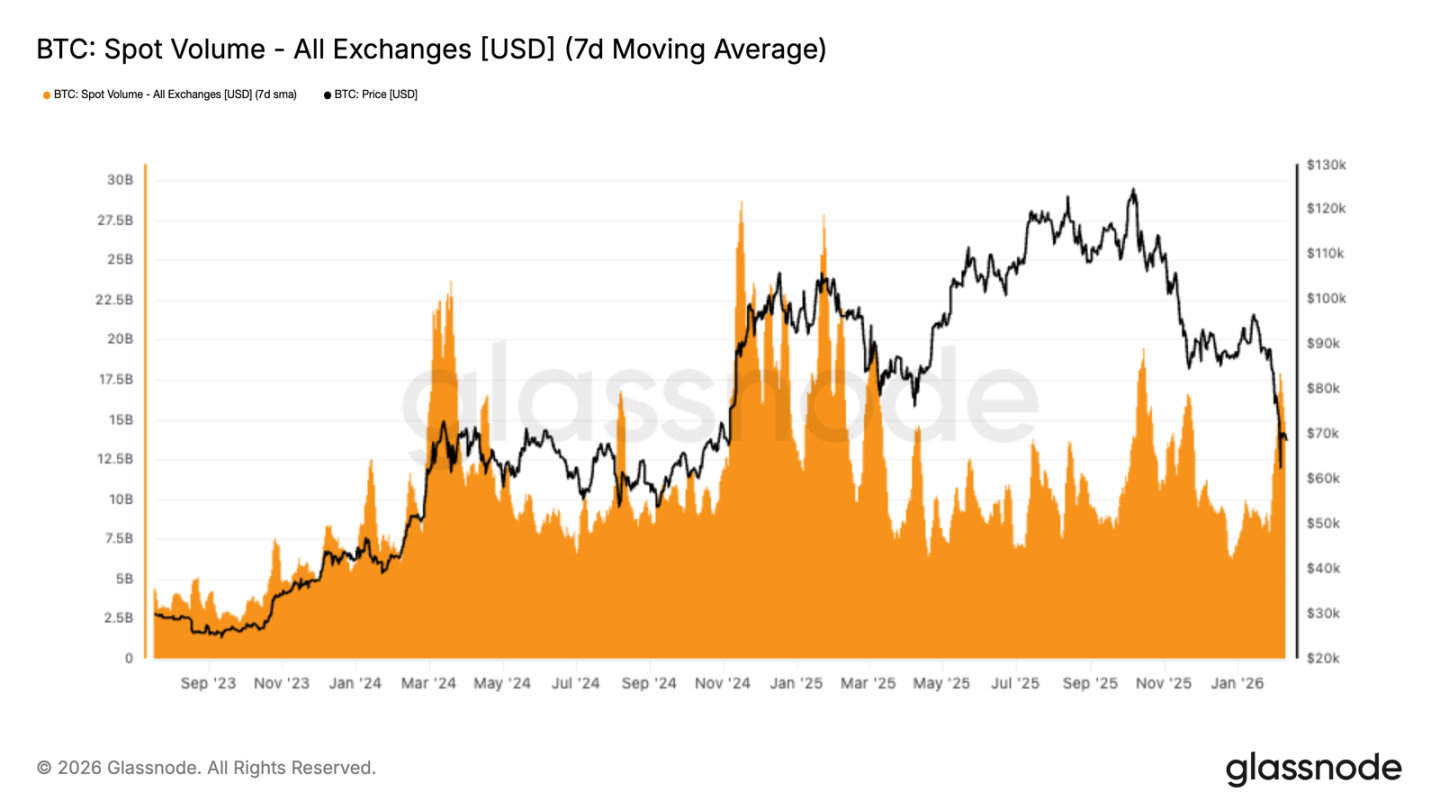
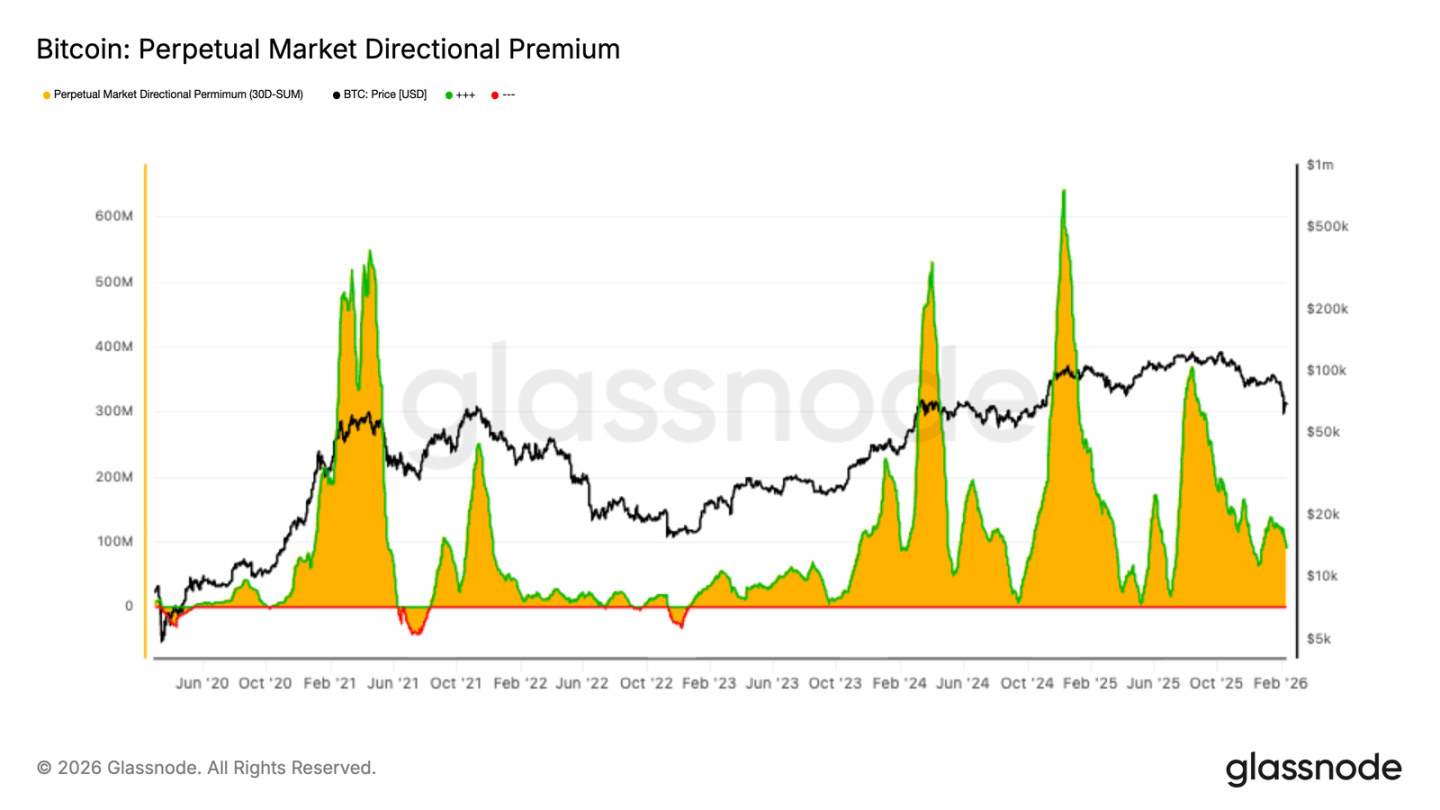
- Spot trading volume only spikes during declines, lacking sustained and proactive bottom-fishing buying. Futures premiums have retreated to neutral levels, showing a cooling in leveraged speculative sentiment.
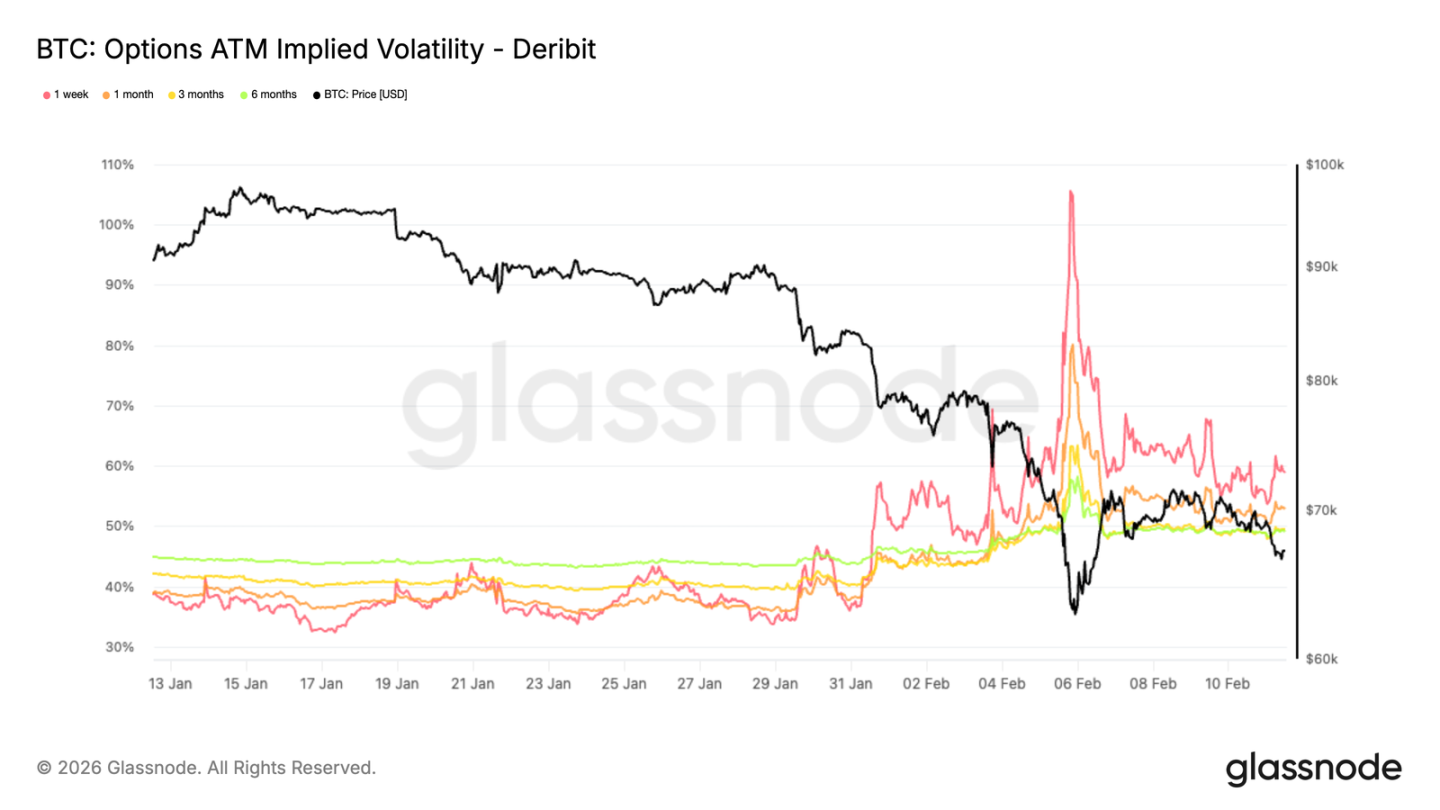
- Implied volatility across the options market is rising comprehensively, with skew persistently negative, indicating the market is still actively purchasing downside protection and positioning is defensive.
- Short-term holders are generally in a loss-making state (profit ratio only 4.9%), and newly entering capital lacks confidence, leading to a lack of momentum for upward continuation.
Original Author: Glassnode
Original Compilation: AididiaoJP, Foresight News
Bitcoin continues to defend within the $60k-$72k range, while selling pressure in the $82k-$97k zone caps the upside. Capital outflows, tepid spot trading volume, and cooling futures activity all point to insufficient demand, leaving prices to react passively with little momentum for a decisive breakout.
Summary
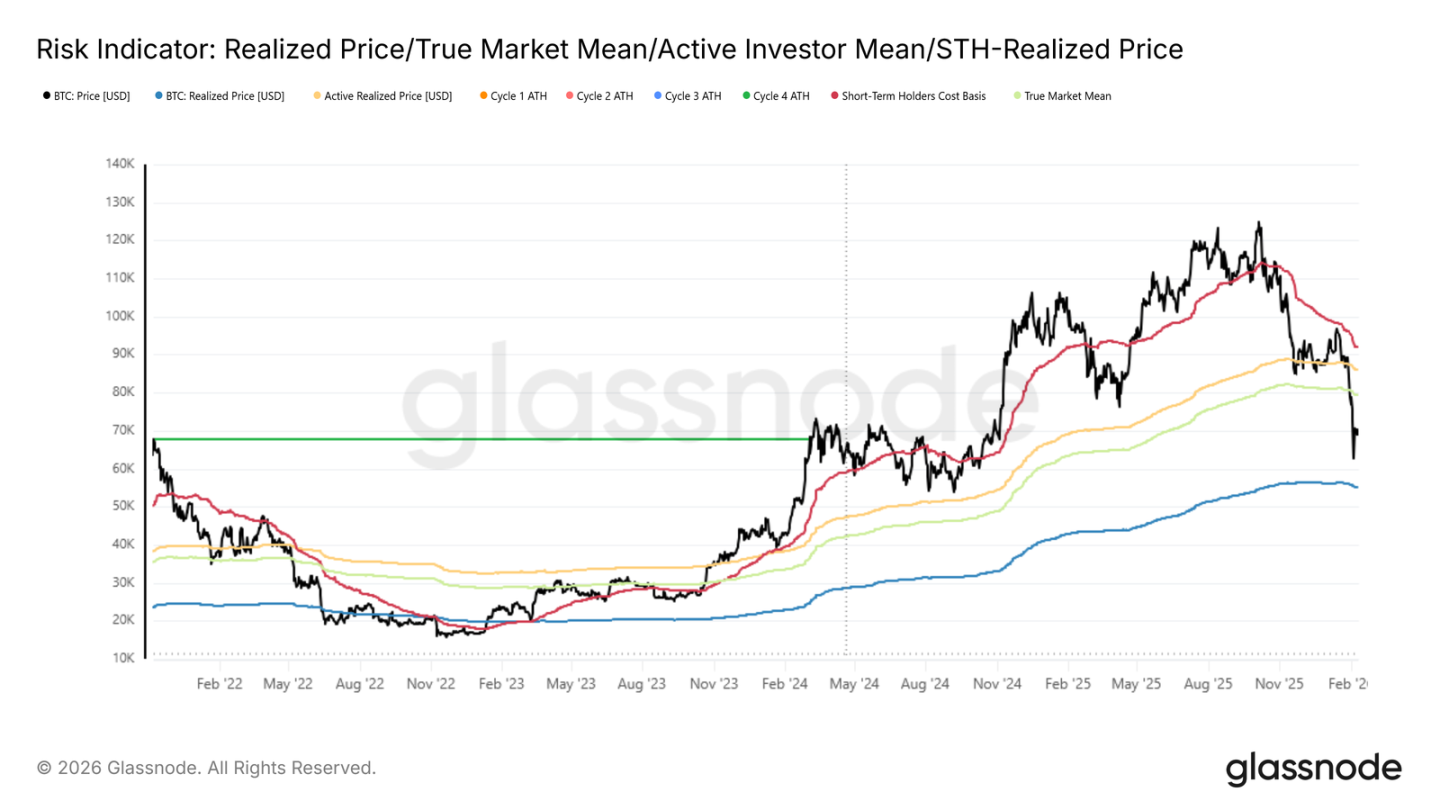
- Bitcoin is trapped between the Realized Cap Mean (approx. $79.2k) and the Realized Price (approx. $55k). Following structural weakness, the market has remained defensive, with the $60k-$72k range still absorbing selling pressure.
- Significant supply overhangs exist in the $82k-$97k and $100k-$117k ranges, currently held at a loss, creating clear resistance for any price rebound.
- Short-Term Holders are generally at a loss, and new entrants lack confidence, making it difficult for rallies to sustain momentum.
- Digital asset holdings across various institutional entities are experiencing synchronized net outflows. This is not isolated behavior but a broad-based reduction in risk exposure, indicating weak spot market absorption.
- Spot trading volume only spiked during the initial drop and quickly contracted afterward, suggesting a passive, reactive market rather than active bottom-fishing.
- Perpetual futures markets have cooled, with funding rates compressed. Leveraged players have stepped back, and speculative sentiment has receded.
- Implied Volatility indicates the market continues to buy protection, a classic defensive posture.
- The positioning structure in the options market also makes prices prone to choppy, range-bound action without significant directional moves, exacerbated by already tight liquidity.
On-Chain Insights
Since hitting a new high last October, Bitcoin has gone through three phases: an initial sharp decline, repeatedly testing the Realized Cap Mean; a sideways consolidation lasting until late January this year; and the recent third phase—breaking below the Realized Cap Mean and accelerating towards $60k.
A New Trading Range
The upper bound of this third phase is the Realized Cap Mean at $79.2k, and the lower bound is the Realized Price at $55k. This structure resembles that of the first half of 2022.
Similar to Q2 2022, price is likely to oscillate within this range, requiring time to grind as new buyers gradually enter and absorb supply.
To break this pattern in the short term would require either extreme strength—a decisive reclaim of the $79.2k Realized Cap Mean to re-establish an uptrend—or extreme weakness—a LUNA or FTX-level event driving price below the $55k Realized Price. Barring these extremes, the most likely path is continued consolidation within the range.
Range Support Holding
So far, the $60k-$72k range continues to absorb selling pressure. This zone was a dense trading area in the first half of 2024 and is now holding again, confirming that genuine buying interest exists at these levels.
Ideally, if this zone can sustain absorption and accumulation, similar to previous strong accumulation phases, it could lay a solid foundation for the next leg up.
However, this depends on the conviction of buyers. The willingness of buyers to deploy capital within the $60k-$72k range will determine whether the market stabilizes or breaks down to test lower levels.
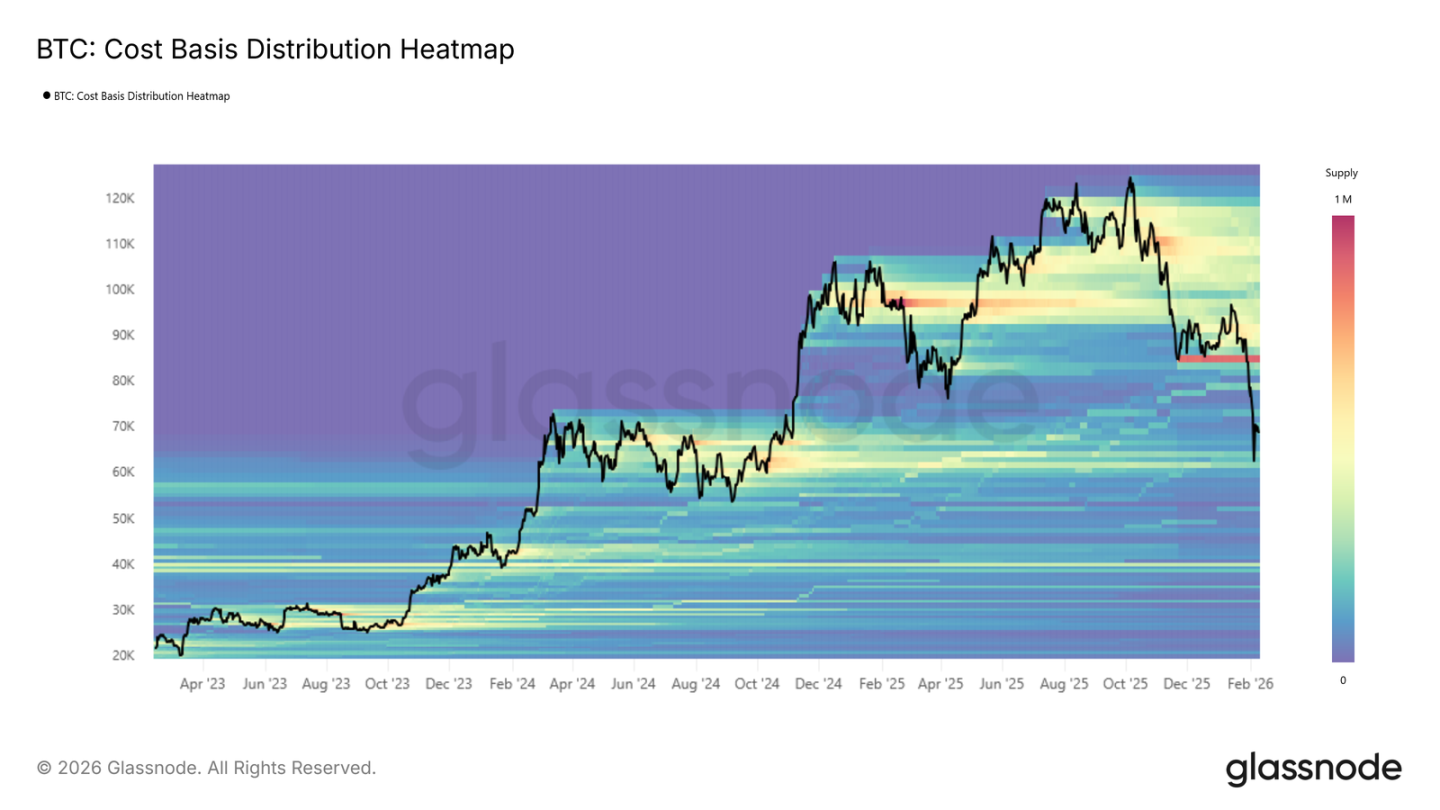
Selling Pressure
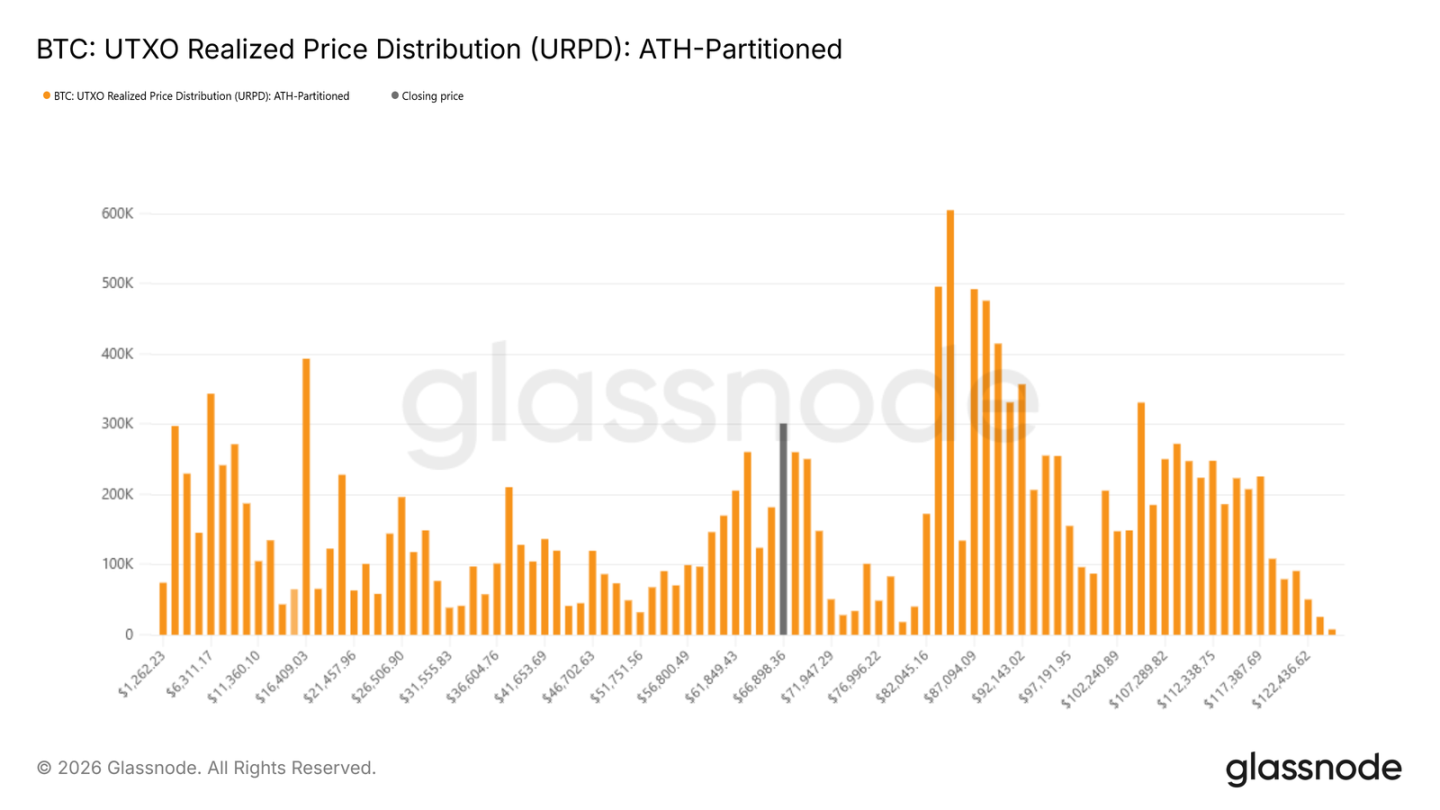
Whether the $60k-$72k range is genuinely strengthening can be assessed via cost distribution. The UTXO Realized Price Distribution shows the concentration of coins at each price level. Currently, price is indeed finding support in the dense cluster formed in H1 2024—the $60k-$72k range—indicating that buyers from that period are not selling and are holding their positions.
However, selling pressure remains heavy. The $82k-$97k and $100k-$117k ranges contain very dense clusters of underwater supply. If prices fail to recover for an extended period or experience another downturn, these holders may capitulate, creating new selling pressure.
Where Bear Market Rallies Top Out
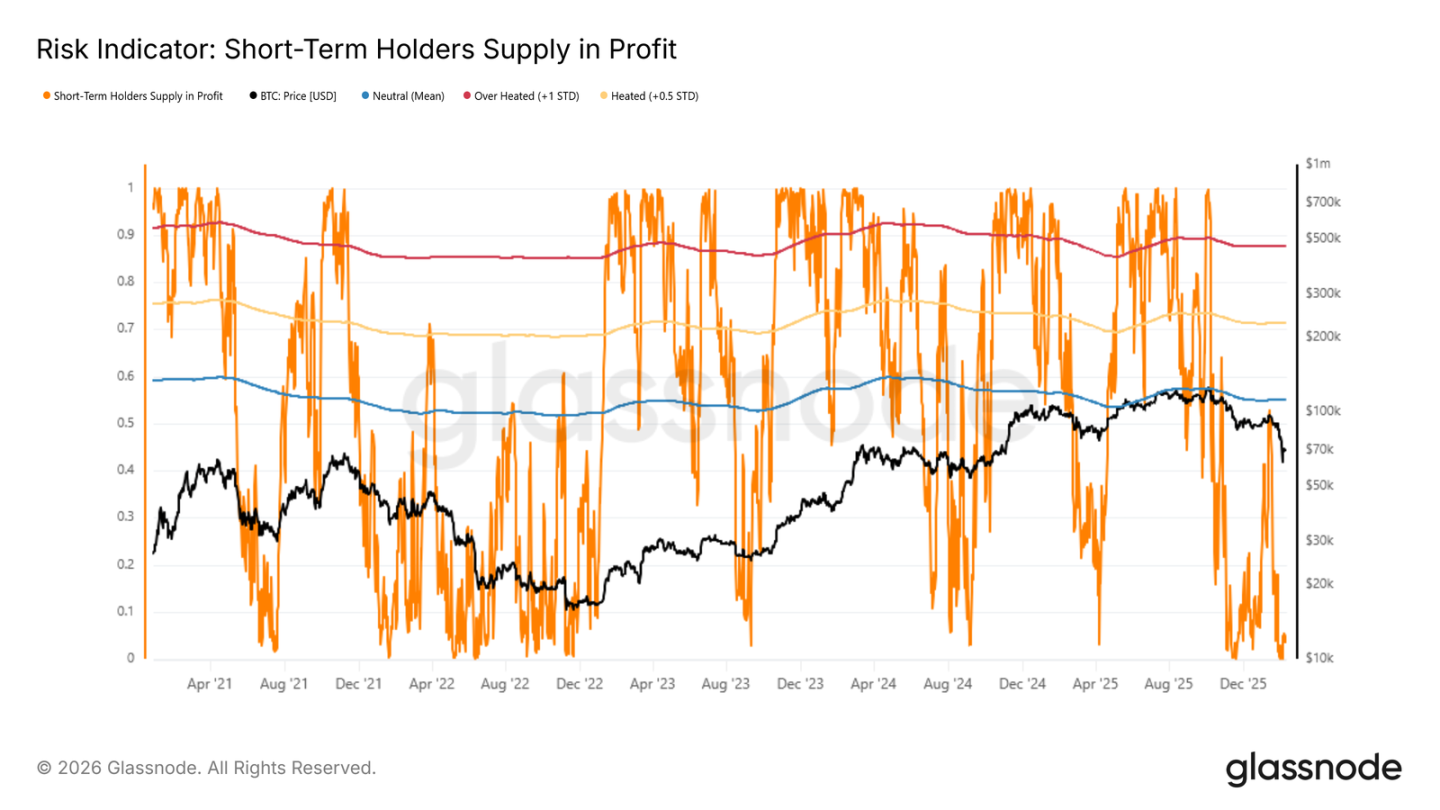
Given the high probability of range-bound action, identifying potential local tops and bottoms becomes crucial. In bearish phases, rallies are often seen as exit opportunities by recent buyers. Therefore, significant unrealized profits among this cohort often signal an approaching local top.
The Short-Term Holder Profit/Loss Ratio is a useful metric for this. Historically, bear market rallies have often stalled when this metric reached the "mean to +0.5 standard deviation" zone. Currently, this figure is only 4.9%, indicating that the vast majority of recent entrants are underwater. With so few in profit, selling pressure from them is limited, but it also highlights market weakness, a lack of fresh capital, and the difficulty for rallies to extend.
Off-Chain Insights
Institutional Capital Exiting
Digital asset fund flows have turned notably negative recently, with ETFs, corporate, and government entities all experiencing simultaneous net outflows, pushing Bitcoin to new lows. ETFs are the primary driver, but corporates and governments are also reducing exposure. This isn't isolated portfolio rebalancing but a broad-based institutional risk reduction across the market.
The outflow volume is substantial, exceeding the spot market's absorption capacity. This isn't a rotation between asset classes but a comprehensive de-risking. Unless these outflows stabilize, prices will remain under selling pressure, with the extent of the decline dependent on when willing buyers step in.
Sluggish Spot Trading Volume
When price dropped to the lower $70k region, spot volume spiked, lifting the 7-day moving average. However, this volume was driven by the drop itself—a passive, reactive response, not active accumulation. Moreover, volume contracted immediately after the spike, indicating observers, not buyers.
This suggests buying pressure is insufficient to match selling pressure. Current volume reflects churn and liquidations, not sustained accumulation. Without consistent buy-side liquidity, prices are vulnerable to further downside. Current spot volume represents a panic-induced reaction, not a signal of stabilization.
Futures Premium Recedes
Perpetual futures funding rates have been compressed, largely returning to neutral. This indicates leveraged players have stepped back, unlike the previous period where both longs and shorts were aggressive. High funding rates often signal strong directional consensus; their absence now suggests a lack of market conviction.
The compression in premiums reflects overall quiet in the derivatives market, with risk appetite declining alongside volatility. No one is aggressively shorting, nor is anyone confidently chasing longs. Directional positioning is thin. Derivatives are no longer providing momentum, leaving spot to drive price action. The current futures market signals one thing: caution, not participation.
Implied Volatility – Risk Repricing
Following this decline, the volatility structure has changed markedly. Looking at 1-month at-the-money (ATM) implied volatility (IV) makes it clear: longer-dated volatility has been repriced—up 5 points for 6-month and 9 points for 3-month.
The front end saw the sharpest jump, with 1-week IV surging over 20 points. Implied volatility reflects market expectations for future price swings; such a significant spike is unlikely to be temporary. The entire term structure is repricing risk.
Although it has since moderated somewhat, IV across tenors remains elevated, indicating the market perceives sustained uncertainty, not a one-off event.
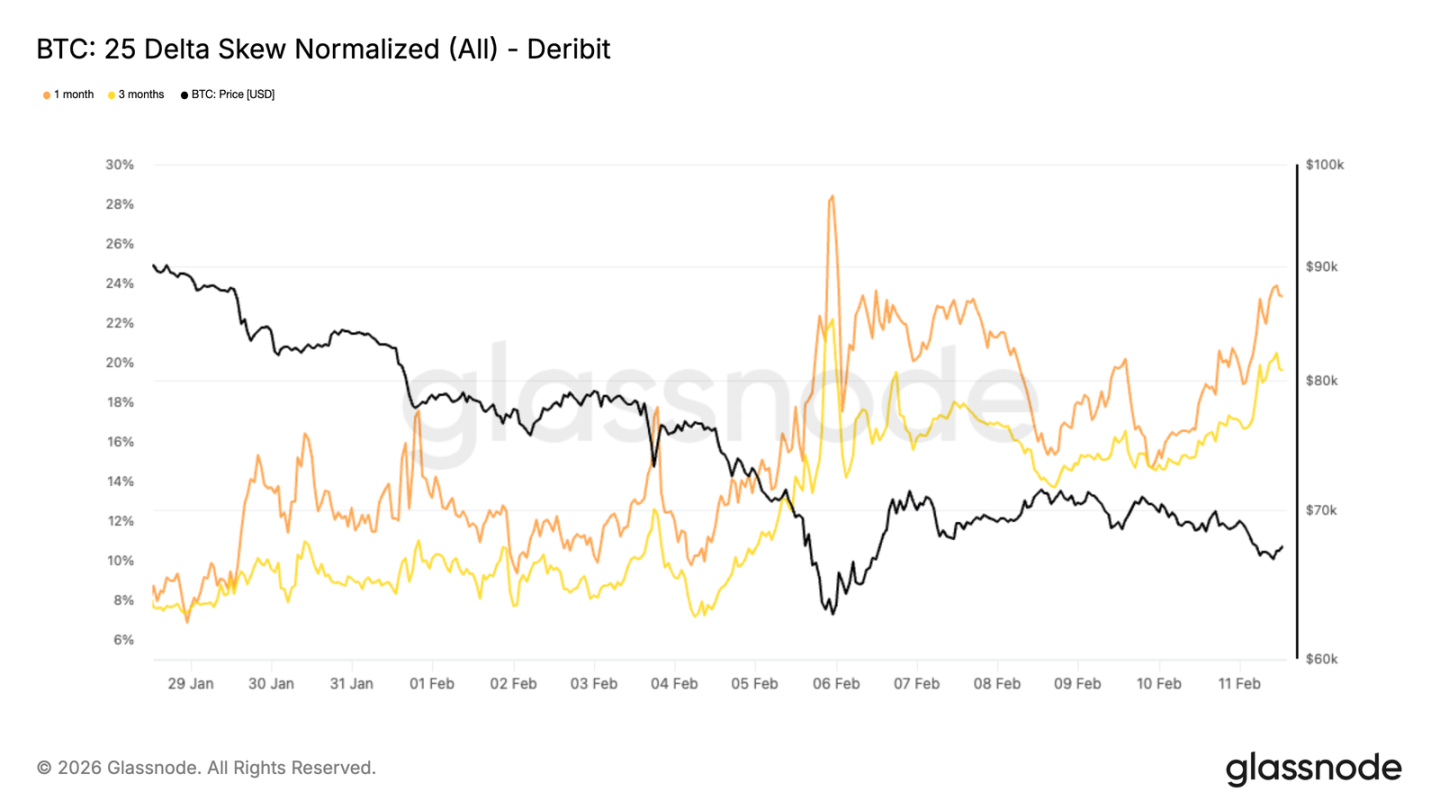
25-Delta Skew Shows Persistent Downside Demand
While overall IV has stepped higher, the flow of money is revealed by skew. The 1-month and 3-month 25-delta skew plunged during the sell-off, dominated by put buying.
Although there was a bounce on Friday, put premiums remain elevated, nearly back to levels seen at the worst of the decline. The 25-delta skew compares the implied volatility of out-of-the-money (OTM) puts versus OTM calls; a negative value indicates puts are more expensive, reflecting a preference for downside protection. On January 28th, the 1-month and 3-month skew indicated an approximate 8% put premium; it has now reached 23% and 19%, respectively.
The entire volatility surface remains tilted towards puts. Despite the bounce, fear has not dissipated.
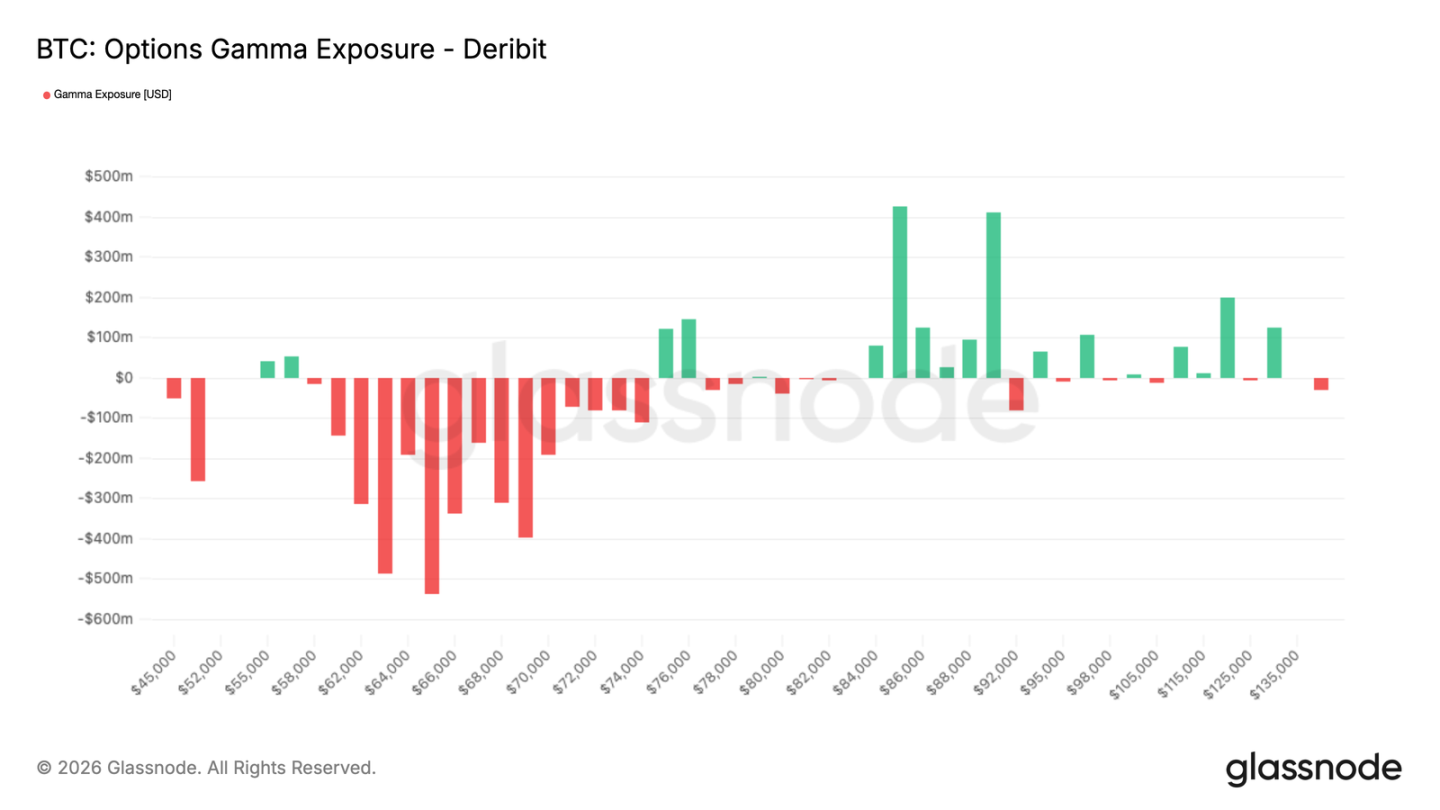
Market Maker Gamma – Price Elasticity
This defensive options flow leaves its mark on market maker positioning. When market makers are short gamma, they must buy as price rises and sell as it falls, amplifying volatility rather than dampening it.
The wave of aggressive put buying earlier has left market maker structures still vulnerable. The recent bounce has not eliminated this sensitivity. The result is a fragile market where moves in either direction can be accelerated by hedging flows, with a higher probability of acceleration to the downside.
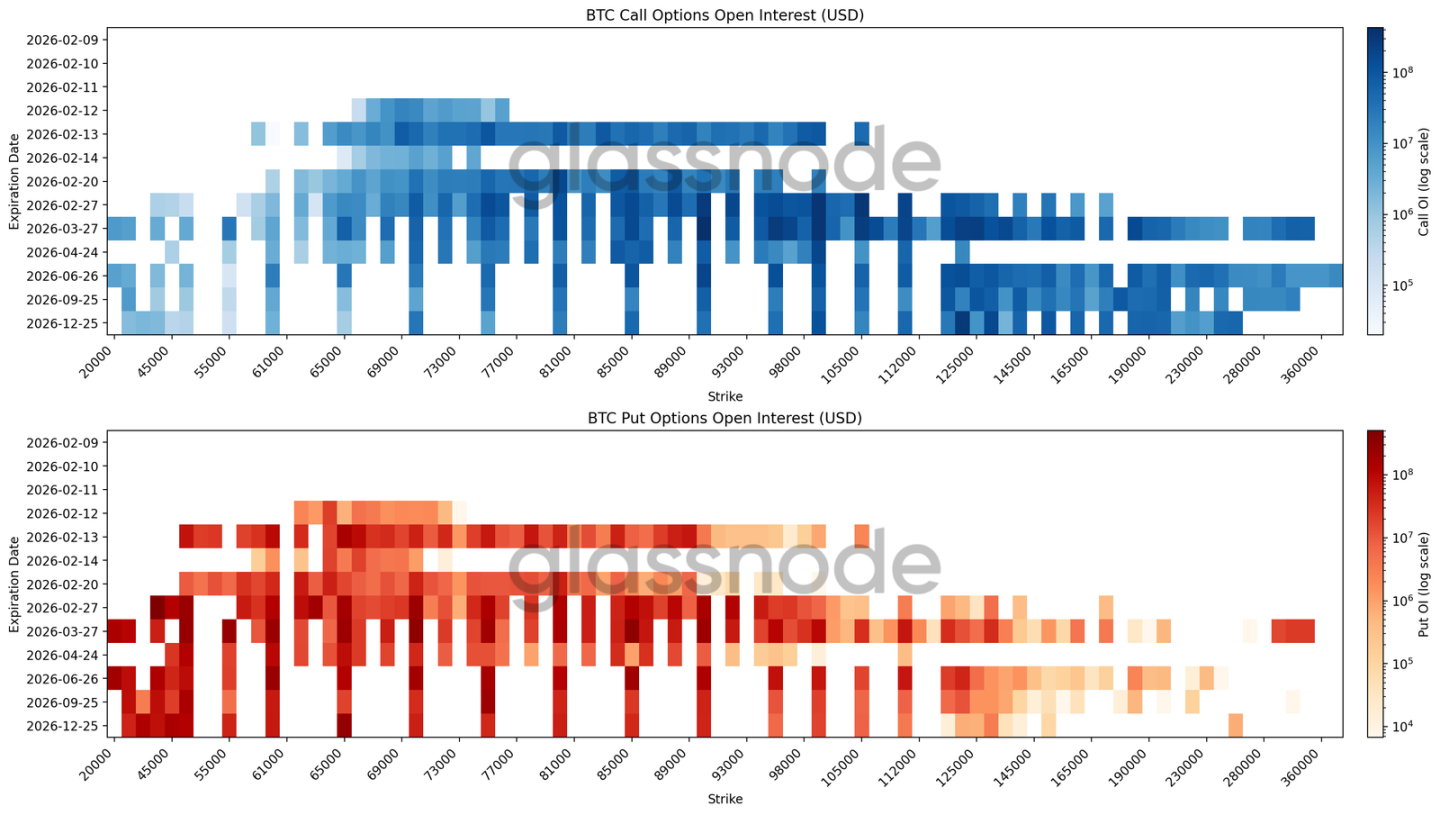
Open Interest Heatmap Reveals Broad-Based Hedging
The latest heatmap aggregates Bitcoin options open interest across strikes and expiries, clearly showing where capital is concentrated and where pricing pressure may emerge.
For February expiries, the largest block of open interest is in the $60k-$70k put strikes. Looking further out, year-end and longer-dated contracts show ample put open interest between $50k and $30k.
This isn't a bet on a specific event date but multi-period downside protection. Moreover, it's not a precise bet on a single strike but a blanket coverage of a range—a classic range hedge. Call open interest is concentrated above $120k for the second half of the year. Short-term bullish bets are being unwound, while long-term bearish hedges are held as tail-risk protection, contributing to the deeply negative skew.
The overall positioning structure is defensive, not betting on a reversal.
Conclusion
Bitcoin remains in a defensive structure, with price caught between key cost bases, and critical support zones being repeatedly tested. The $60k-$72k range continues to absorb selling, but overhead supply is heavy, and Short-Term Holders are underwater with weak confidence. In this state, rallies are easily capped, and stabilization requires sustained buying pressure.
Off-chain data corroborates this cautious outlook. Institutions are exiting, spot volume is reactive rather than accumulative, and in derivatives, speculative sentiment has cooled while hedging persists. Market maker positioning adds to price elasticity, making decisive directional moves difficult.
Overall, the market is in a pressured equilibrium. Liquidity is thin, participation is fragmented, and positioning is defensive. For a trend change, either spot buying intensity must increase, or risk appetite must return. Until then, volatility will likely be driven by short-term positional flows rather than a sustained trend.


