
Bitcoin's Short-Term Bear-to-Bull Shift: Will History Repeat Itself? | Guest Analysis
- Core View: Analysts believe Bitcoin is currently experiencing a daily rebound within a weekly bearish trend. Whether it can effectively break through and stabilize above the 21-week moving average in the coming weeks is a critical watershed for determining if the market trend can reverse.
- Key Elements:
- Last week's price action validated the effectiveness of the key resistance zone between $94,500 and $95,000. After reaching a high of $97,963, the market is now confirming the gains or losses within this range.
- Technical models indicate that the weekly trend remains bearish, while the momentum for the daily rebound is showing signs of exhaustion. The validity of the current market structure still requires confirmation.
- The core observation range for this week is $94,500 to $95,000. Holding above this range could lead to a choppy rebound, while facing pressure could result in a pullback to test the support zone between $89,500 and $91,000.
- Regarding operations, maintain a neutral mid-term position and observe. For short-term trades, based on key levels and model signals, execute spread trading using two sets of plans (A/B) with a 30% position allocation.
- Historical comparative analysis suggests that if the rebound fails to effectively break through the 21-week moving average, the market may revisit a pattern of deep correction, potentially even testing the $80,000 level.
Odaily's exclusive market analyst, Conaldo, holds a Master's in Financial Statistics from Columbia University. He has focused on quantitative trading in U.S. stocks since his university years, gradually expanding into digital assets like Bitcoin. Through practical experience, he has developed a systematic quantitative trading model and risk control framework. He possesses a keen data-driven insight into market volatility and is dedicated to continuous growth in professional trading, pursuing steady returns. Each week, he will conduct an in-depth analysis of BTC's technical, macroeconomic, and capital flow dynamics, review and showcase practical trading strategies, and preview upcoming significant events for reference.

Core Summary of the Trading Weekly Report:
• Strategy Execution (Short-term): Last week's trading strictly adhered to the established strategy, completing one short-term operation (1x leverage) with a return of -1.07%. (See Figure 1 for details)
• Core View (Short-term) Validation: The core view proposed last week has been precisely validated by the market. Over the past week, the price broke through the crucial resistance zone of $94,500–$95,000 and is currently confirming its validity. The price reached a high of $97,963, which is less than 0.5% away from the lower bound of the given resistance zone at $97,500, once again confirming our ability to judge key levels.
• Market Outlook for the Coming Weeks: Is Bitcoin transitioning from a bear to a bull market? Is the current market movement a rebound or a reversal? The 21-week moving average may become the market's bull-bear dividing line in the future. (Detailed explanation in Figure 4)
The following sections will provide a detailed review of market predictions, strategy execution, and specific trading processes.
1. Bitcoin Market Review for Last Week (01.12–01.18)
1. Review of Last Week's Short-term Operations: As shown in (Figure 1)
We strictly followed the trading signals generated by our self-developed Spread Trading Model and Momentum Quant Model, combined with our market trend predictions, to execute one short-term trade. This trade resulted in a loss of 1.07%.
Specific trade details and review are as follows:
Bitcoin 30-minute K-line Chart: (Momentum Quant Model + Spread Trading Model)
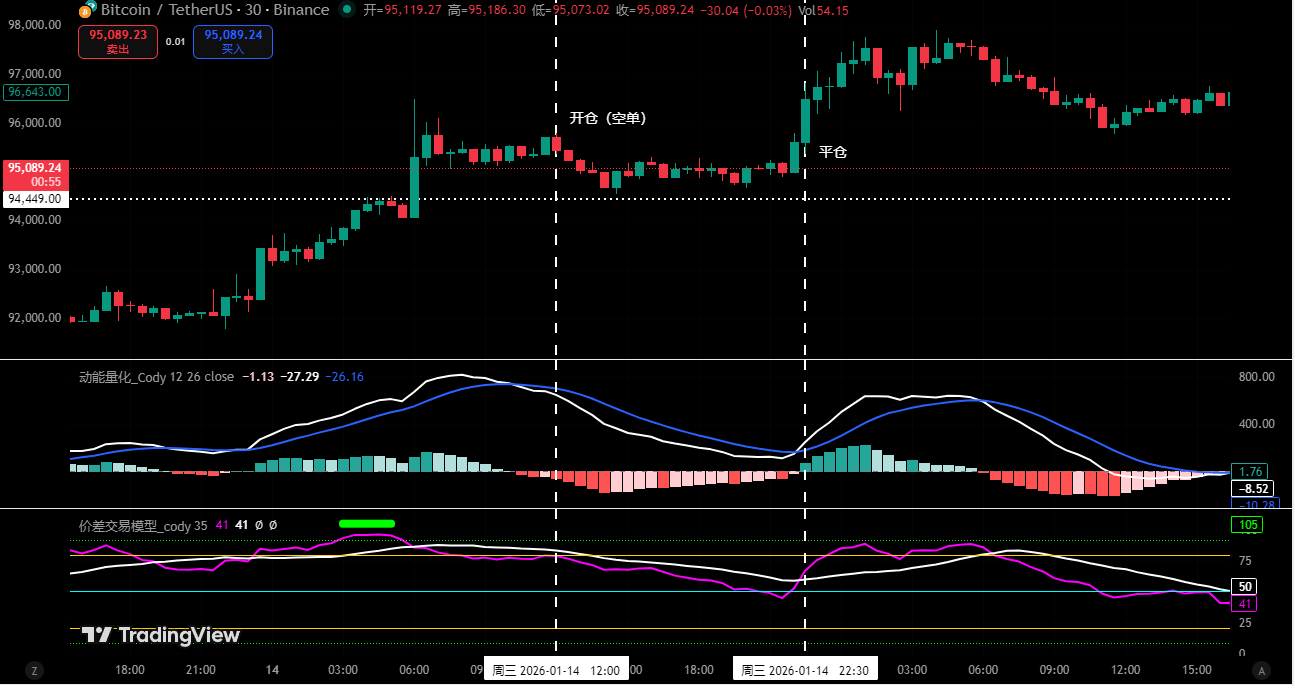
Figure 1
①、Trade Details Summary: (No Leverage)
②、Short-term Trade Review:
• First Trade (Loss 1.07%): This operation executed the Plan A (Shorting at Resistance Level) strategy: When the price rose to the key resistance zone of $94,500–$95,000 and showed signs of rejection, the Spread Trading Model simultaneously triggered a top signal (green dot), forming a dual confirmation. Accordingly, we established a 30% short position as planned at $95,460; however, the market deviated from expectations, finding support near $94,500 and turning upward. When the Momentum Quant Model and Spread Trading Model triggered bottom signals again, we immediately stopped the loss and exited at $96,493. Although this trade resulted in a loss, we strictly adhered to the operational discipline of "trading upon signal trigger, risk control first", achieving unity of knowledge and action.
2. Review of Last Week's Trend Prediction and Operational Strategy:
①、Last week clearly stated: Maintain consolidation within the $84,000–$94,500 range, focusing on observing directional choices and their validity at both ends of the range.
②、Key Level Review: Resistance zone at $94,500–$95,000, important resistance near $97,500–$99,500; support zone at $89,500–$91,000.
②、Operational Strategy Review:
• Medium-term Strategy: If the price successfully breaks through and stabilizes above $94,500, close all medium-term positions (short positions) and hold coins for observation.
• Short-term Strategy: If consolidation continues within the $84,000–$94,500 range, execute operations according to Plan A:
• Entry: When rebounding to the $94,500–$95,000 zone combined with model top signals, establish a 30% short position.
• Risk Control: Initial stop-loss for short positions set near 1.5% above the entry price (i.e., 1.015 * entry price).
• Exit: When approaching core support levels combined with model signals, gradually close positions to take profits.
2. Analyzing Bitcoin's Price Structure from a Technical Perspective: A Comprehensive Assessment Based on Multiple Models and Dimensions
Combined with market movements, the author conducts an in-depth analysis of Bitcoin's price structure from multiple models and dimensions based on a self-developed trading system.
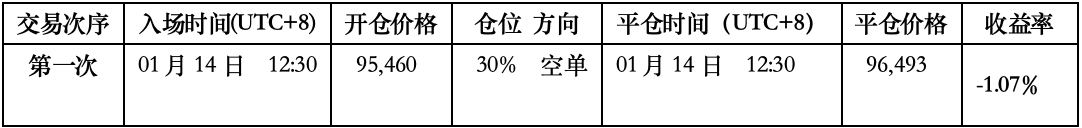
Bitcoin Weekly K-line Chart: (Momentum Quant Model + Sentiment Quant Model)
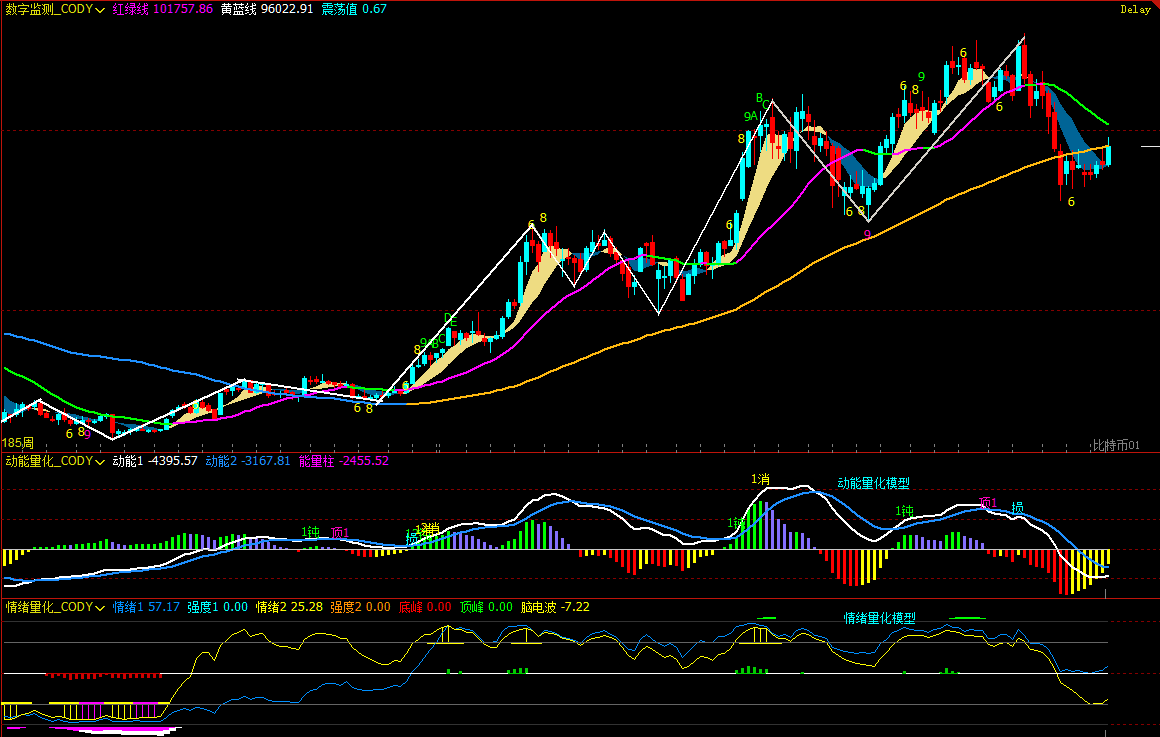
Figure 2
1、As shown in (Figure 2), analysis from the weekly chart:
• Momentum Quant Model: Technical indicators show, continuing the pattern of previous weeks, the momentum lines are gradually converging, while negative energy bars continue to shrink. However, current signals do not confirm a reversal of the bearish trend.
The Momentum Quant Model indicates: Probability of Price Decline: High
• Sentiment Quant Model: Blue sentiment line value 57.17, intensity zero; yellow sentiment line value 25.28, intensity zero, peak value is 0.
The Sentiment Quant Model indicates: Price Pressure and Support Index: Neutral
• Digital Monitoring Model: The price has been below the bull-bear (yellow-blue line) dividing line for 9 weeks. Last week, bulls challenged this line again, closing near it.
The Digital Monitoring Model indicates: No monitoring (top/bottom) digital signals appeared; the weekly K-line closed as a medium bullish candle, gaining approximately 2.92%.
The above data suggests: Bitcoin's weekly chart shows a bearish trend; be alert to risks of volatile adjustments.
Bitcoin Daily K-line Chart: (Momentum Quant Model + Sentiment Quant Model)
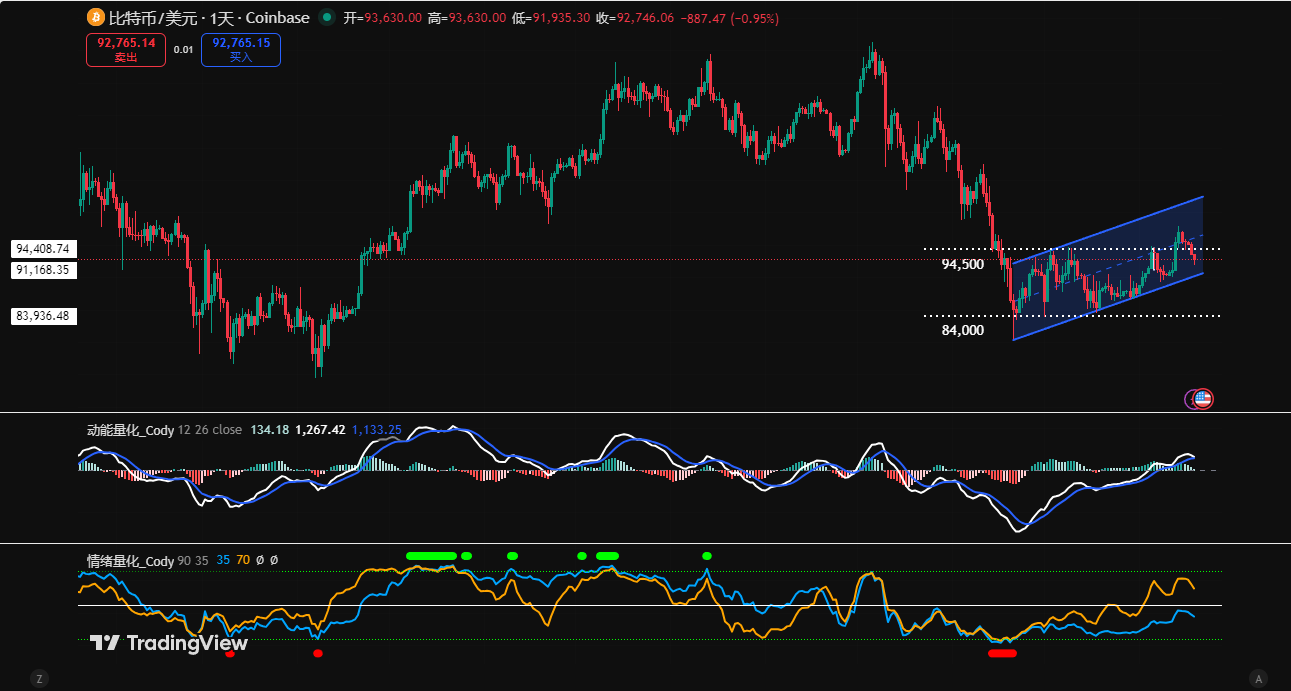
Figure 3
2、As shown in (Figure 3), analysis from the daily chart:
• Momentum Quant Model: Last week's overall trend was "rising first, then falling." In the first half, the price accelerated its rebound, the momentum line moved above the zero axis, and positive energy bars expanded rapidly. However, in the latter half, energy bars significantly shrank, the momentum lines converged again, and began slowly approaching the zero axis.
The Momentum Quant Model indicates: Daily chart bullish momentum is showing signs of exhaustion, focus on the gain/loss of the zero axis.
• Sentiment Quant Model: After last week's daily close, the blue sentiment line value is 38, intensity zero; the yellow sentiment line value is 76, intensity zero.
The Sentiment Quant Model indicates: Pressure and Support Index: Neutral
The above data suggests: The daily chart rebound continues, and the market is initially showing a bullish structure, but its validity needs confirmation. The focus next is on the battle between bulls and bears over the zero axis.
3. This Week's Market Forecast (01.19–01.25)
1、This Week's Core View: Focus on whether the $94,500–$95,000 zone is held or lost.
• Resistance Holds: If the price rebounds to this zone and confirms resistance, it is expected to maintain consolidation within the $84,000–$94,500 range. The subsequent primary test target is the $89,500–$91,000 zone.
• Holding Firmly: If it can firmly hold above this zone, the price may experience a volatile rebound, but the upside is limited.
2、Core Resistance Levels:
• First Resistance Zone: $94,500–$95,000 zone (previous range top)
• Second Resistance Zone: $97,500–$99,500 zone (previous consolidation pivot)
• Important Resistance Level: Near $10,200 (near the 21-week moving average)
3、Core Support Levels:
• First Support Level: $89,500–$91,000 zone (previous high-volume trading area)
• Second Support Level: $86,000–$86,500 zone (previous important support level)
• Important Support Level: Near $84,000 (previous range bottom)
4. This Week's Operational Strategy (Excluding Sudden News Impact) (01.19–01.25)
1、 Medium-term Strategy: No positions. Market movements may be volatile and repetitive; temporarily hold coins for observation.
2、 Short-term Strategy: Utilize 30% of capital, set stop-loss points, and look for "spread" trading opportunities based on support and resistance levels. (Using the 30-minute chart as the operational timeframe).
3、 Operationally, focus on whether the $94,500–$95,000 zone is held or lost. To dynamically respond to market evolution and combine real-time model signals, we have formulated two short-term operational plans, A/B:
• Plan A: If the price stabilizes above the $94,500–$95,000 zone:
• Entry: After the price breaks through the $94,500–$95,000 zone and shows signs of stabilization, combined with model bottom signals, establish a 30% long position.
• Risk Control: Initial stop-loss for long positions set near 1.5% below the entry price (i.e., 0.985 * entry price).
• Exit: When approaching core resistance levels combined with model signals, gradually close positions to take profits.
• Plan B: If the price effectively breaks below the $94,500–$95,000 zone:
• Entry: If the rebound confirms a valid breakdown of this zone, establish a 30% short position.
• Risk Control: Initial stop-loss for short positions set near 1.5% above the entry price (i.e., 1.015 * entry price).
• Exit: When approaching near $86,500 combined with model signals, gradually close positions to take profits.
Bitcoin Weekly K-line Chart: Comparative Analysis of Historical Price Structures (2021.11 VS 2025.10)
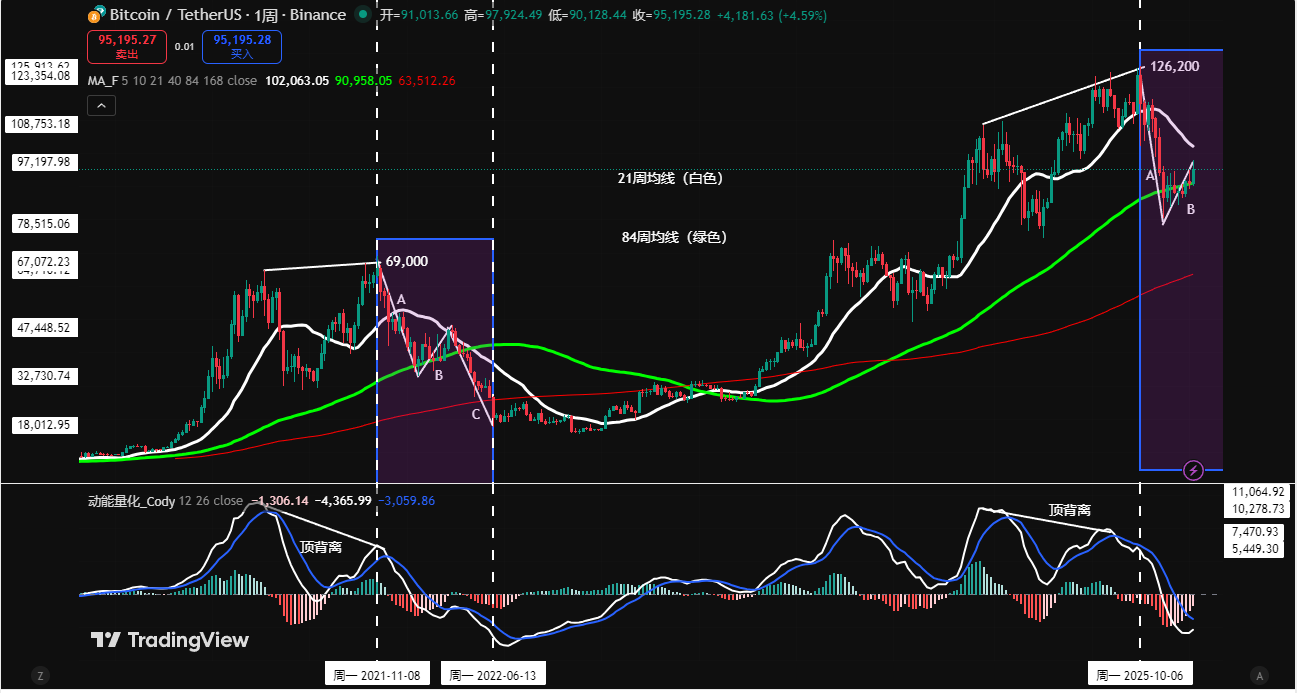
Figure 4
Note: In the chart above, the 21-week moving average (white), 84-week moving average (green)
5. How Will History Repeat? Comparing Similarities, Differences, and Insights from Two Rounds of Weekly-Level Adjustments:
In summary, we can extract the following core insights:
1、The current weekly chart is in a bearish trend, which limits the upside potential of the daily chart rebound.
2、In the coming weeks, whether the price can effectively break through and stabilize above the 21-week moving average will become a market focus. If the price fails to form an effective breakthrough when rebounding to this moving average, the market may repeat the historical adjustment pattern, potentially even breaking below the $80,000 level.
3、Whether the weekly MACD indicator can show signs of stabilization and whether the momentum line can effectively cross above the zero axis become a key basis for judging whether the market trend has reversed.
6. Special Notes:
1. Upon Entry: Immediately set the initial stop-loss level.
2. When Profit Reaches 1%: Move the stop-loss to the entry price (breakeven point) to ensure capital safety.
3. When Profit Reaches 2%: Move the stop-loss to the 1% profit level.
4. Continuous Tracking: Thereafter, for every additional 1% profit, move the stop-loss up by 1% accordingly, dynamically protecting and locking in profits.
Financial markets are ever-changing, and all market analysis and trading strategies require dynamic adjustment. All views, analytical models, and operational strategies mentioned in this article are derived from personal technical analysis, intended solely for personal trading log purposes, and do not constitute any investment advice or operational basis. Markets involve risks, invest with caution, DYOR.


