
The Battle Between Bulls and Bears Is Imminent, Three Strategies to Help You Gain Short-Term Profits | Invited Analysis
- Core View: Bitcoin may maintain range-bound consolidation in the short term, awaiting a directional breakout.
- Key Factors:
- Last week's strategy was successfully validated, with BTC oscillating within the 86.5k-91k range.
- Quantitative models indicate a bearish weekly trend, with daily charts showing a tug-of-war around key levels.
- This week, focus on the 84k support and 94.5k resistance; a breakout will determine the direction.
- Market Impact: Provides traders with clear technical analysis and actionable contingency plans.
- Timeliness Note: Short-term impact.
Odaily invited market analyst Cody Feng, a Master of Financial Statistics from Columbia University in the United States. Since his university days, he has focused on quantitative trading in US stocks and gradually expanded into digital assets such as Bitcoin. Through practical experience, he has built a systematic quantitative trading model and risk control system. He possesses keen data insight into market fluctuations and is committed to continuous in-depth exploration in the professional trading field, pursuing stable returns. Each week, he will delve deeply into changes in BTC's technicals, macro environment, and capital flows, review and showcase practical trading strategies, and preview noteworthy upcoming events for reference.

Core Summary of the Trading Weekly Report:
• Strategy Execution (Short-term) Effectiveness Verification: Last week's trading strictly followed the established strategy, successfully completing two short-term operations (1x leverage), achieving a cumulative return of 0.62%.
• Core View (Short-term) Verification: Our short-term view from last week has been validated by the market: if Bitcoin can effectively hold above the $86,000~$86,500 region, it will maintain a range-bound oscillation between $86,500 and $91,000. The price action over the past week precisely confirmed this judgment. Last week, the price reached a high of $91,764 and a low of $86,675, largely aligning with our key levels, confirming the range-bound pattern.
In the previous analysis, we explored the possibility of a price movement favorable to bears. From the current market perspective, if viewed from the standpoint of the main bullish force, the current rhythm of slight fluctuations and slow upward movement could continue. Upon encountering the dual resistance of the descending trendline since October last year and the long-term ascending trendline since late 2022, a strong bullish candlestick with high volume could emerge, breaking through the key resistance level in one move, triggering a "short squeeze" to clear out bearish positions. Subsequently, a secondary bottom test might occur to shake out retail bulls who entered near recent lows, thereby completing the bottom formation. After that, the price is expected to rise rapidly, moving away from the main force's cost area, and initiate a relatively strong technical rebound. It is important to clarify that the above scenario is merely a projection favorable to the main bullish force and is not inevitable. Regardless of the market's choice, one must remember the principle that "the market is always right," and choosing the correct response strategy is what truly matters.
1. Last Week's Trading Results: (12.29~01.04)
1. Short-term Trading Review (No Leverage):
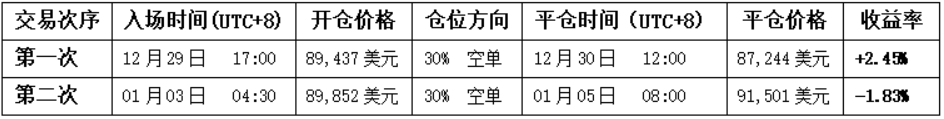
• First Trade (Profit 2.45%): Based on the "sell short upon encountering resistance at the core pressure zone during a rebound" pattern. When the price surged into the $89,500~$91,000 zone and showed signs of resistance, coupled with the spread trading model simultaneously signaling a top, a 30% short position was established and ultimately closed for profit when the price fell near the support zone.
• Second Trade (Profit -1.83%): This trade followed the same entry logic as above, but the price action deviated from expectations. The price completed technical indicator repairs through sideways consolidation, then slowly climbed, showing signs of effectively breaking through the key $91,000 resistance level. Ultimately, when I observed two trading models resonating to signal a bottom, I decided to close all positions to stop losses.
2. Last Week's Price Prediction and Operational Strategy Review:
Last Week's Core View: Focus on observing the gain or loss of the $86,000~$86,500 zone. An effective break below would lead to a bottom-seeking oscillation; holding effectively above would maintain a range-bound oscillation between $86,500 and $91,000.
①、Key Level Review:
• Core Resistance Levels: First resistance at the $89,500~$91,000 zone; second resistance at the $93,000~$94,500 zone.
• Core Support Levels: First support at the $86,000~$86,500 zone; second support at the $83,500~$84,500 zone.
②、Operational Strategy Review:
• Mid-term Strategy: Maintain a mid-term position of approximately 65% (short).
• Short-term Strategy: Based on the market's actual movement, we ultimately executed Plan A (effectively holding above the $86,000~$86,500 zone) as the core strategy.
• Entry: When the price rebounds to the $89,500~$91,000 zone and shows resistance signals, establish a 30% short position.
• Risk Control: Set stop loss for short positions above $92,500.
• Closing: When the price falls to the $86,000~$86,500 zone and shows signs of stabilization, close all short positions to take profits.
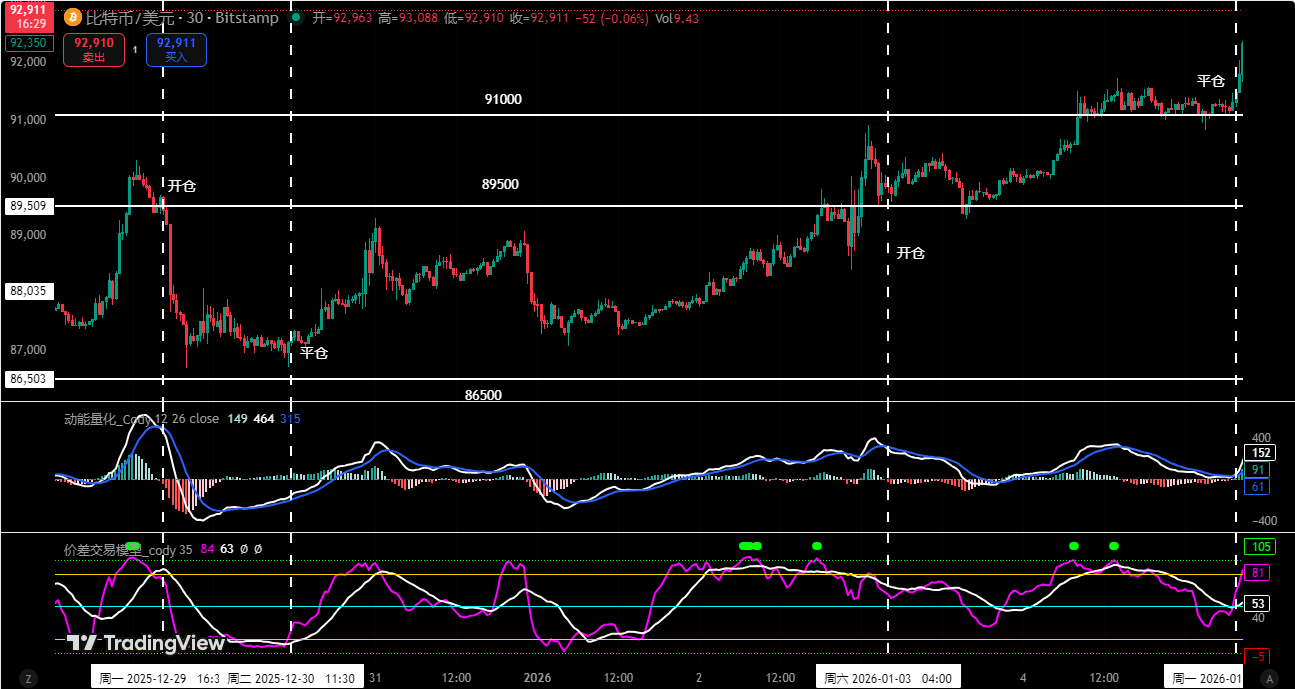
Figure 1
2. Quantitative Technical Analysis: How to Enter
Combining last week's market performance, the author will conduct an in-depth analysis of the evolution of Bitcoin's internal structure using multi-dimensional analytical models.
Bitcoin Weekly Chart: (Momentum Quant Model + Sentiment Quant Model)
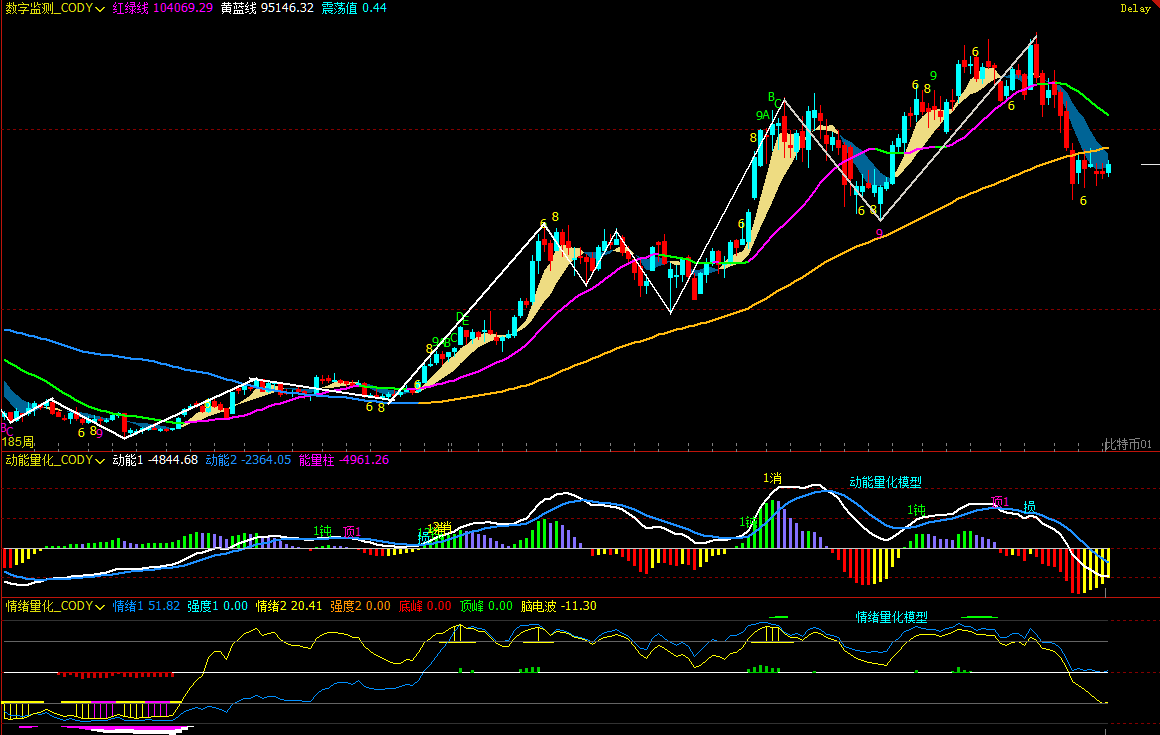
Figure 2
1、As shown in (Figure 2), analysis from the weekly chart:
• Momentum Quant Model: Technical indicators show that the two momentum lines continue to decline below the zero line, while the negative energy bars show a shrinking trend. This reflects that although bears dominate, their downward momentum has not fully exerted itself.
Momentum Quant Model Indicates: Price decline probability: High
• Sentiment Quant Model: Blue sentiment line value 51.82, intensity zero; yellow sentiment line value 20.41, intensity zero, peak value is 0.
Sentiment Quant Model Indicates: Price pressure and support probability: Neutral
• Digital Monitoring Model: The price has broken below the bull-bear (yellow-blue line) demarcation for 7 weeks; short-term bottom digital signals have not appeared.
The above data indicates: Bitcoin's weekly chart has entered a bearish trend, beware of oscillation and adjustment risks.
Bitcoin Daily Chart:
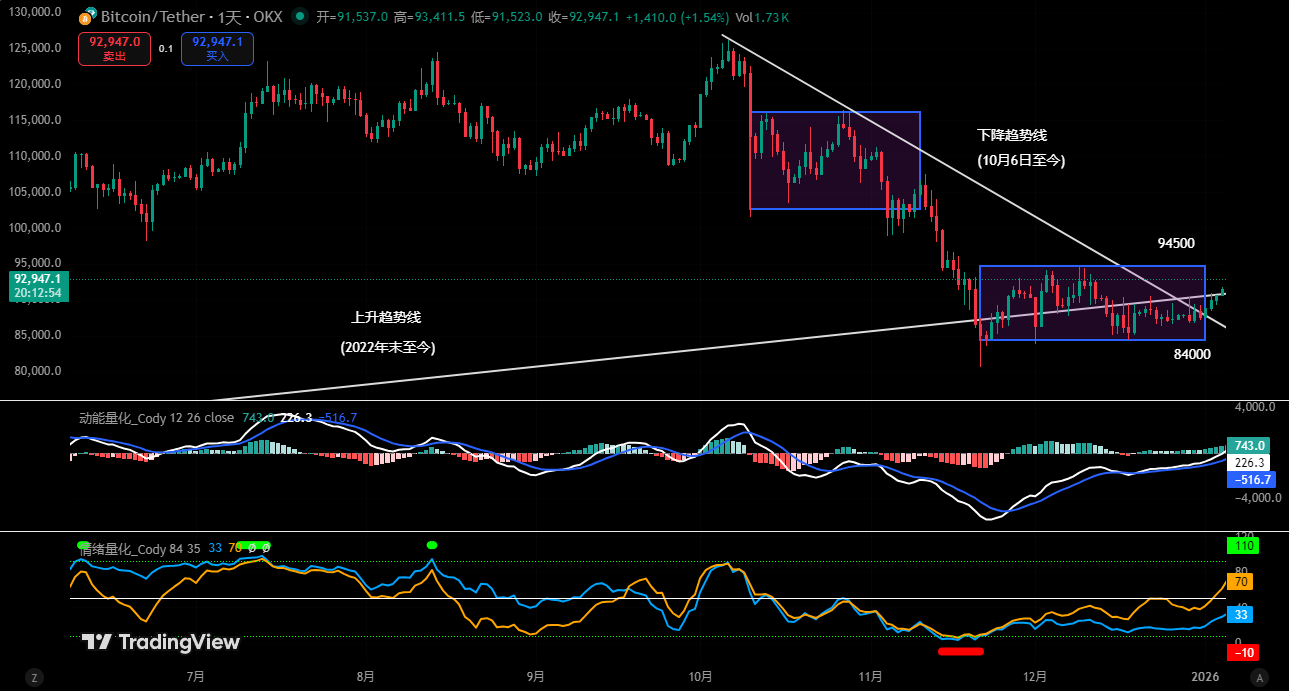
Figure 3
2、As shown in (Figure 3), analysis from the daily chart:
• Momentum Quant Model: In the latter half of last week, the price rose for 4 consecutive days. The gap between the two momentum lines gradually widened, the white momentum line is approaching the zero line, and the positive energy bars show signs of gradual expansion.
Momentum Quant Model Indicates: The area near the zero line is a battleground for bulls and bears; monitor the gain or loss of the zero line.
• Sentiment Quant Model: After last Sunday's close, the blue sentiment line value is 29, intensity zero; yellow sentiment line value is 61, intensity zero.
Sentiment Quant Model Indicates: Pressure and support probability: Neutral
The above data suggests: The daily chart level is still in a bear market, but the market is beginning to choose a direction.
3. This Week's Market Prediction: (01.05~01.11)
1、Before the market makes a directional choice this week, the main fluctuation range is expected to be $84,000~$94,500. Operationally, focus on the bullish/bearish performance of the price near the range boundaries.
• If it effectively breaks below the $84,000 key support, the price may initiate a bottom-seeking move, testing the $80,000 level.
• If it effectively holds above the $94,500 key resistance, a relatively strong technical rebound may begin.
2、Core Resistance Levels:
• First Resistance Zone: $93,000~$94,500 area
• Second Resistance Zone: Near $97,500~$99,500
• Important Resistance Level: Near $104,000.
3、Core Support Levels:
• First Support Zone: $89,500~$91,000 area
• Second Support Zone: $86,000~$86,500 area
• Third Support Zone: $83,500~$84,500 area
• Important Support Level: Near $80,000.
4. This Week's Operational Strategy (Excluding Sudden News Impact): (01.05~01.11)
1、 Mid-term Strategy:
• Before the price effectively breaks above $94,500, continue to maintain a mid-term position of approximately 65% (short).
• If the price successfully breaks and holds above $94,500, close all mid-term positions (short) and hold funds for observation.
2、 Short-term Strategy: Utilize 30% of the position, set stop-loss points, and look for "spread" trading opportunities based on support and resistance levels. (Using 30 minutes as the operation cycle).
3、 To respond to market evolution, we have formulated three short-term operation plans: A/B/C.
• Plan A: If the price maintains a range-bound oscillation between $84,000~$94,500:
• Entry: When the price rebounds to the $93,000~$94,500 area and shows resistance signals, establish a 30% short position.
• Risk Control: Set stop loss for short positions above $95,500.
• Partial Close: When the price falls to the $86,000~$86,500 area and shows signs of stabilization, close part of the short positions.
• Full Close: When the price probes near $84,000 and shows signs of stabilization, close all positions to take profits.
• Plan B: If it effectively breaks below the $84,000 support:
• Entry: If the price effectively breaks below, establish a 30% short position.
• Risk Control: Set stop loss above $85,000.
• Closing: When the price probes near $80,000 and shows signs of stabilization, gradually close positions to take profits.
• Plan C: If it successfully breaks and holds above the $94,500 resistance:
• Entry: If the price successfully breaks above, establish a 30% long position.
• Risk Control: Set stop loss below $93,000.
• Closing: When the price rebounds near $97,500 and shows resistance signals, gradually close positions to take profits.
5. Special Notes:
1. When Opening a Position: Immediately set the initial stop-loss level.
2. When Profit Reaches 1%: Move the stop-loss level to the entry cost price (breakeven point) to ensure capital safety.
3. When Profit Reaches 2%: Move the stop-loss level to the 1% profit level.
4. Continuous Tracking: Thereafter, for every additional 1% profit, move the stop-loss level up by 1% accordingly, dynamically protecting and locking in existing profits.
(Note: The 1% profit trigger threshold mentioned above can be flexibly adjusted by investors based on their own risk preferences and the volatility of the asset.)
6. This Week's Key Event Outlook: (01.05~01.11)
I. Intensive Speeches by FOMC Officials: A Forward-Looking Window for Policy Path Expectations
This week, several voting Federal Reserve officials will deliver intensive speeches on economic prospects and policy stance, constituting an important source of information for the market regarding the future monetary policy path.
Monday 01:30, 2026 FOMC voter, Minneapolis Fed President Kashkari will speak at the American Economic Association;
Tuesday 21:00, 2027 FOMC voter, Richmond Fed President Barkin speaks;
Friday 23:00, Kashkari will deliver a welcome address and participate in an informal discussion at an online conference hosted by the bank;
Saturday 02:35, Barkin will speak again on the economic outlook.
The market's core focus is currently on: whether officials will maintain the "cautious easing" tone or begin to provide clearer signals for the next phase of policy shift. It is important to note that officials' speeches typically influence expectation structure rather than short-term direction, making them more suitable as a reference for medium-term capital pricing anchors.
II. ADP Employment Data: An Important Barometer Before Non-Farm Payrolls
Wednesday 21:15, the US will release December ADP employment change, previous value -32K, market forecast 45K.
Before the Non-Farm Payrolls release, ADP primarily serves a role of trend verification rather than pricing determination. The market's focus is not on monthly fluctuations but on whether employment is gradually shifting from "high-level resilience" to "moderate cooling."
If ADP shows a significant rebound, it will temporarily reinforce the judgment that "employment remains supportive," potentially lifting US Treasury yields and putting some pressure on risk asset sentiment. If the data continues to be weak or below expectations, it will further validate the labor market cooling narrative, providing a precursor for easing expectations, which is relatively friendly for Bitcoin's medium-term valuation.
III. Initial Jobless Claims: A High-Frequency Indicator for Observing Employment Inflection Points
Thursday 21:30, the US will release Initial Jobless Claims for the week ending Jan 3, previous value 199K, forecast 216K.
Compared to ADP and Non-Farm Payrolls, Initial Jobless Claims is more like a liquidity and economic thermometer. Persistently above-trend levels often indicate structural loosening in the job market.
If claims continue to rise and remain above 210K, it will reinforce expectations of economic cooling and policy easing, benefiting the valuation repair of non-yield assets like Bitcoin. If the data falls back again, it may strengthen the "economy still resilient" narrative, which is unfavorable for risk appetite expansion in the short term.
<


