Glassnode: Is Bitcoin showing signs of a 2022 crash again? Be wary of a key price range.
- 核心观点:比特币市场结构脆弱,需守住关键成本区域。
- 关键要素:
- 超25%供应处亏损,结构类似2022年初。
- ETF资金流转负,现货需求明显减弱。
- 期权隐含波动率偏低,市场情绪谨慎。
- 市场影响:市场下行风险增加,依赖关键支撑位。
- 时效性标注:短期影响。
Original authors: CryptoVizArt, Chris Beamish, Antoine Colpaert, Glassnode
Compiled and edited by: BitpushNews
summary
- Bitcoin is stable above the True Market Mean, but the broader market structure is now similar to that of the first quarter of 2022, with more than 25% of the supply operating at a loss.
- Capital momentum remains positive, supporting consolidation, although well below the peak expected in mid-2025.
- The 0.75–0.85 quantile range (US$96.1K–US$106K) is a key area for restoring market structure; a break below this level would increase downside risk.
- ETF fund flows have turned negative, and the cumulative trading volume difference (CVD) in the spot market has declined, indicating that demand is weakening.
- The decline in futures open interest and the reset of funding rates to neutral reflect a risk-averse stance.
- The options market is characterized by compressed implied volatility (IV), softened skewness, and a shift in fund flows from put options to cautious call option selling.
- Options appear to be undervalued, with realized volatility exceeding implied volatility, putting pressure on traders shorting Gamma (short-gamma).
- Overall, the market remains fragile and will depend on holding key cost base areas unless macroeconomic shocks disrupt the balance.
On-chain insights
Bottoming out or collapsing?
Over the past two weeks, Bitcoin's price has fallen and found support near a key valuation anchor known as the True Market Mean—the cost basis for all non-dormant coins (excluding miners). This level typically marks the dividing line between a mild bearish phase and a deep bear market. While prices have recently stabilized above this threshold, the broader market structure is increasingly echoing the dynamics of the first quarter of 2022.
This similarity becomes even clearer when using the Supply Quantiles Cost Basis Model (which tracks the cost basis of supply clusters held by top buyers). Since mid-November, spot prices have fallen below the 0.75 quantile and are currently trading around $96.1K, leaving more than 25% of supply at a loss.
This creates a fragile balance between the risk of top buyers capitulating and the potential for sellers to tire and form a bottom. However, the current structure remains highly sensitive to macroeconomic shocks until the market can reclaim the 0.85 quantile (approximately $106.2K) as support.

Pain is dominant
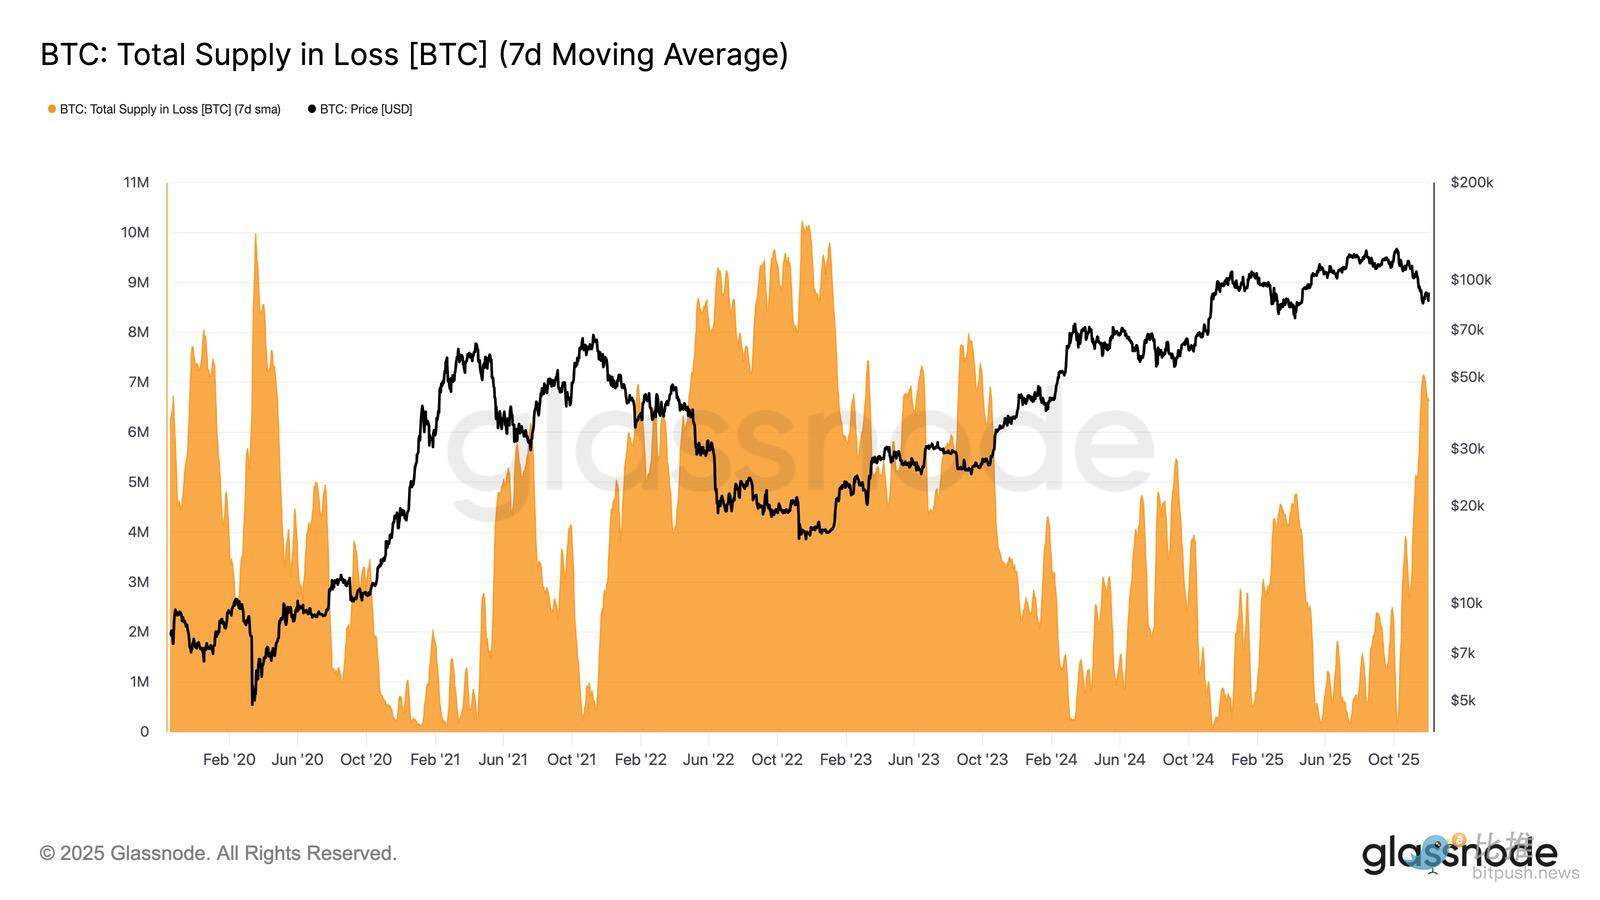
Based on this structural perspective, we can magnify the supply situation of top buyers by using "Total Supply in Loss" to measure the degree of dominance of losses, i.e., the pain of unfulfilled needs.
The indicator’s 7-day simple moving average (7D-SMA) climbed to 7.1 million BTC last week—the highest level since September 2023—highlighting that the more than two-year bull market price expansion is now facing two shallow bottoming phases.
The current loss-making supply size (between 5 million and 7 million BTC) bears a striking resemblance to the sideways market of early 2022, further reinforcing this similarity. This comparison underscores once again that the true market mean is a key threshold distinguishing between a mild bearish phase and the transition to a more defined bear market.
The kinetic energy is still positive.
Despite strong similarities to the first quarter of 2022, the capital inflows into Bitcoin remained slightly positive, which helps explain the support near the real market average and the subsequent rebound to above $90,000.
This capital momentum can be measured by the net change in realized cap, which is currently at a level of +$8.69 billion per month—well below the peak of $64.3 billion per month in July 2025, but still positive.
As long as capital momentum remains above zero, the real market average can continue to serve as a consolidation zone and a potential bottoming area, rather than the start of a deeper decline.

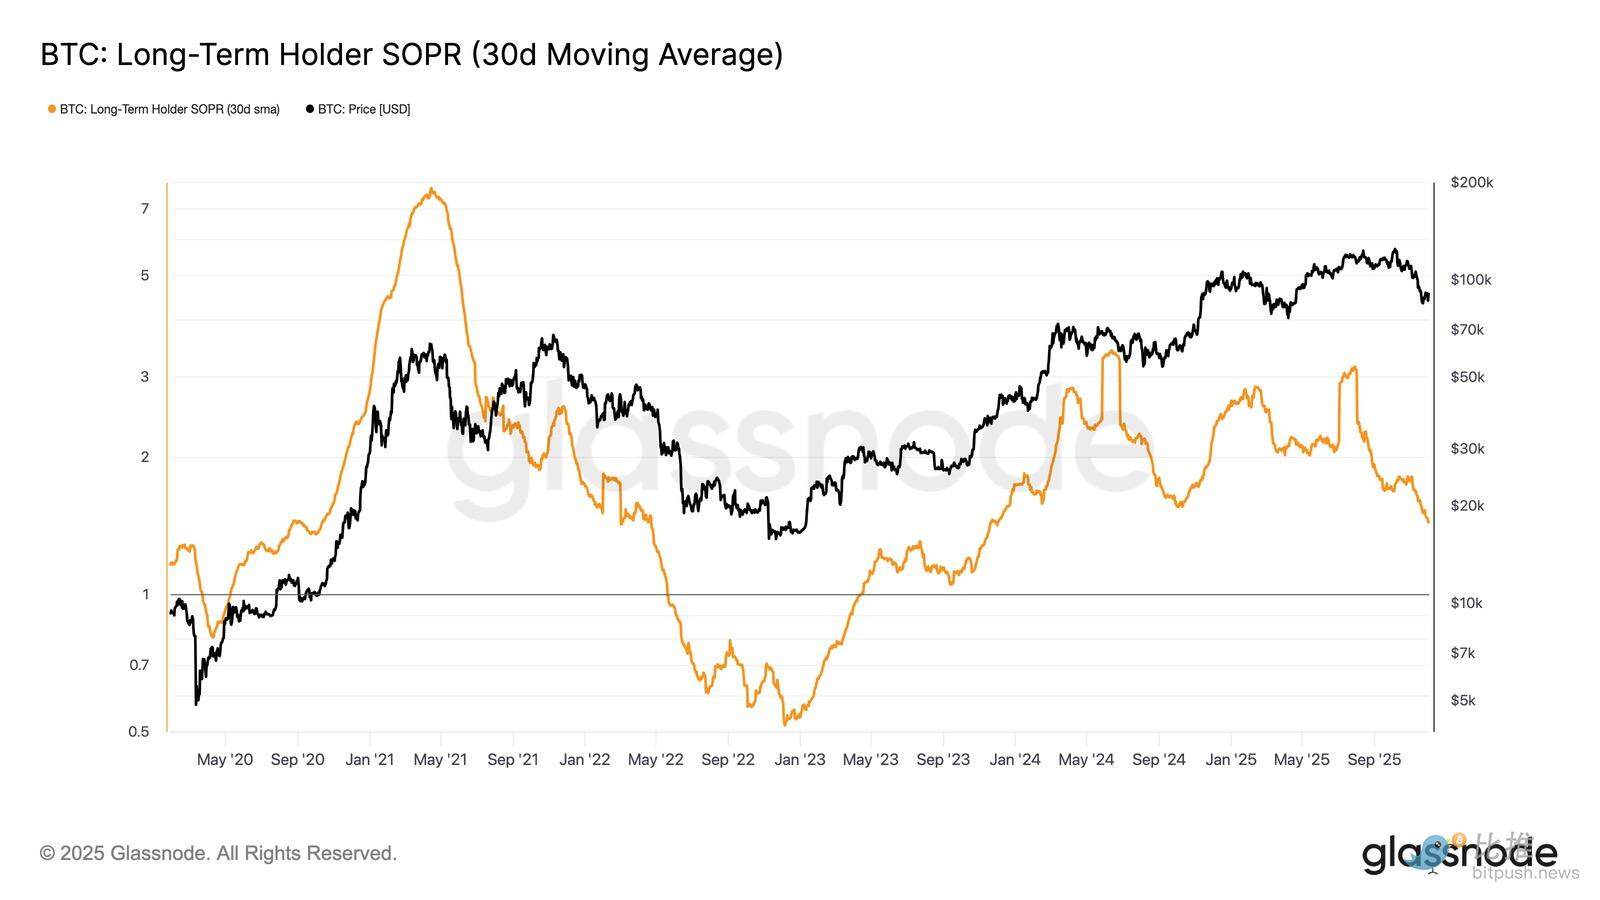
Long-term holders' profit margins decline
The continued presence of positive capital inflows implies that new demand can still absorb profit-taking by long-term investors. The long-term holder SOPR (30-day SMA, a measure of the ratio of spot price to cost basis for active long-term holders) has remained above 1 (currently at 1.43) despite a sharp decline in prices. This emerging margin trend echoes the structure of Q1 2022: long-term holders continue to sell at profits, but margins are narrowing.
Despite stronger demand momentum compared to early 2022, persistently low liquidity forces bulls to hold above the real market mean until a new wave of demand enters the market.
Off-chain insights
ETF demand weakens
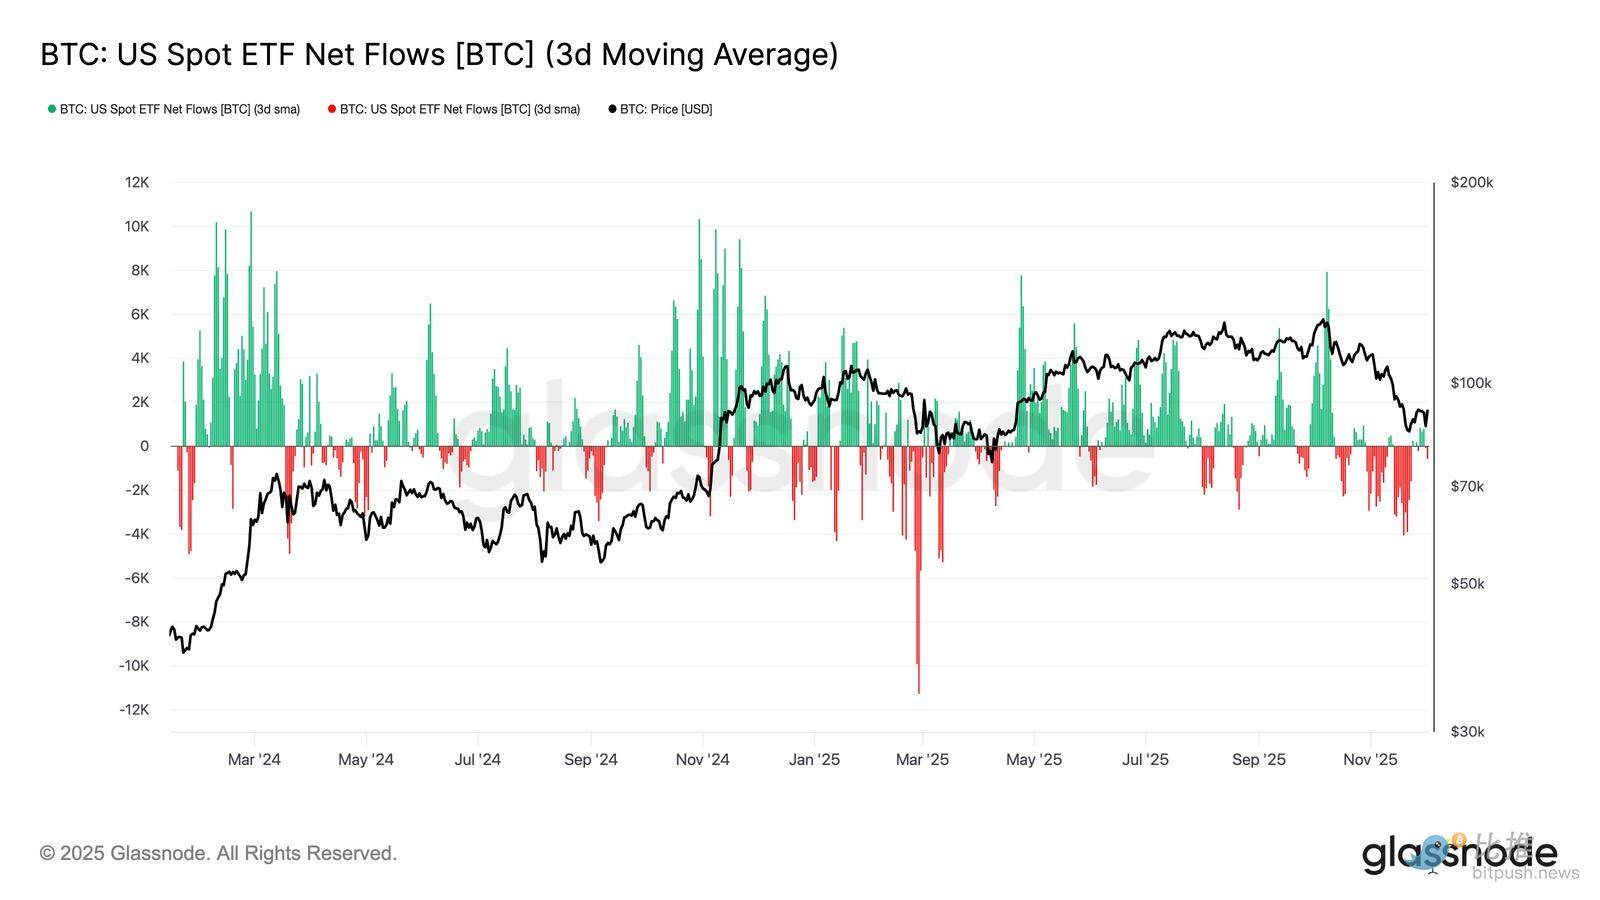
Turning to the spot market, net inflows into US Bitcoin ETFs deteriorated significantly, with its 3-day average firmly slipping into negative territory throughout November. This marks a break from the sustained inflows that supported prices earlier this year, reflecting a cooling of new capital allocation.
The widespread outflows of funds across issuers indicate that institutional participants have adopted a more cautious stance as market conditions weaken. The spot market is currently facing a backdrop of weakening demand, which has diminished immediate buyer support, making prices more sensitive to external shocks and macroeconomic drivers.
Spot buying weakened
Amid deteriorating demand for ETFs, the cumulative volume difference (CVD) has also declined on major exchanges, with Binance and aggregated trading platforms continuing to show a negative trend.
This indicates a steady increase in sell pressure driven by short sellers, with traders crossing bid-ask spreads to mitigate risk rather than accumulate positions. Even Coinbase, often seen as a bellwether for the strength of US buying, has flattened out, suggesting a general retreat in confidence in the spot market.
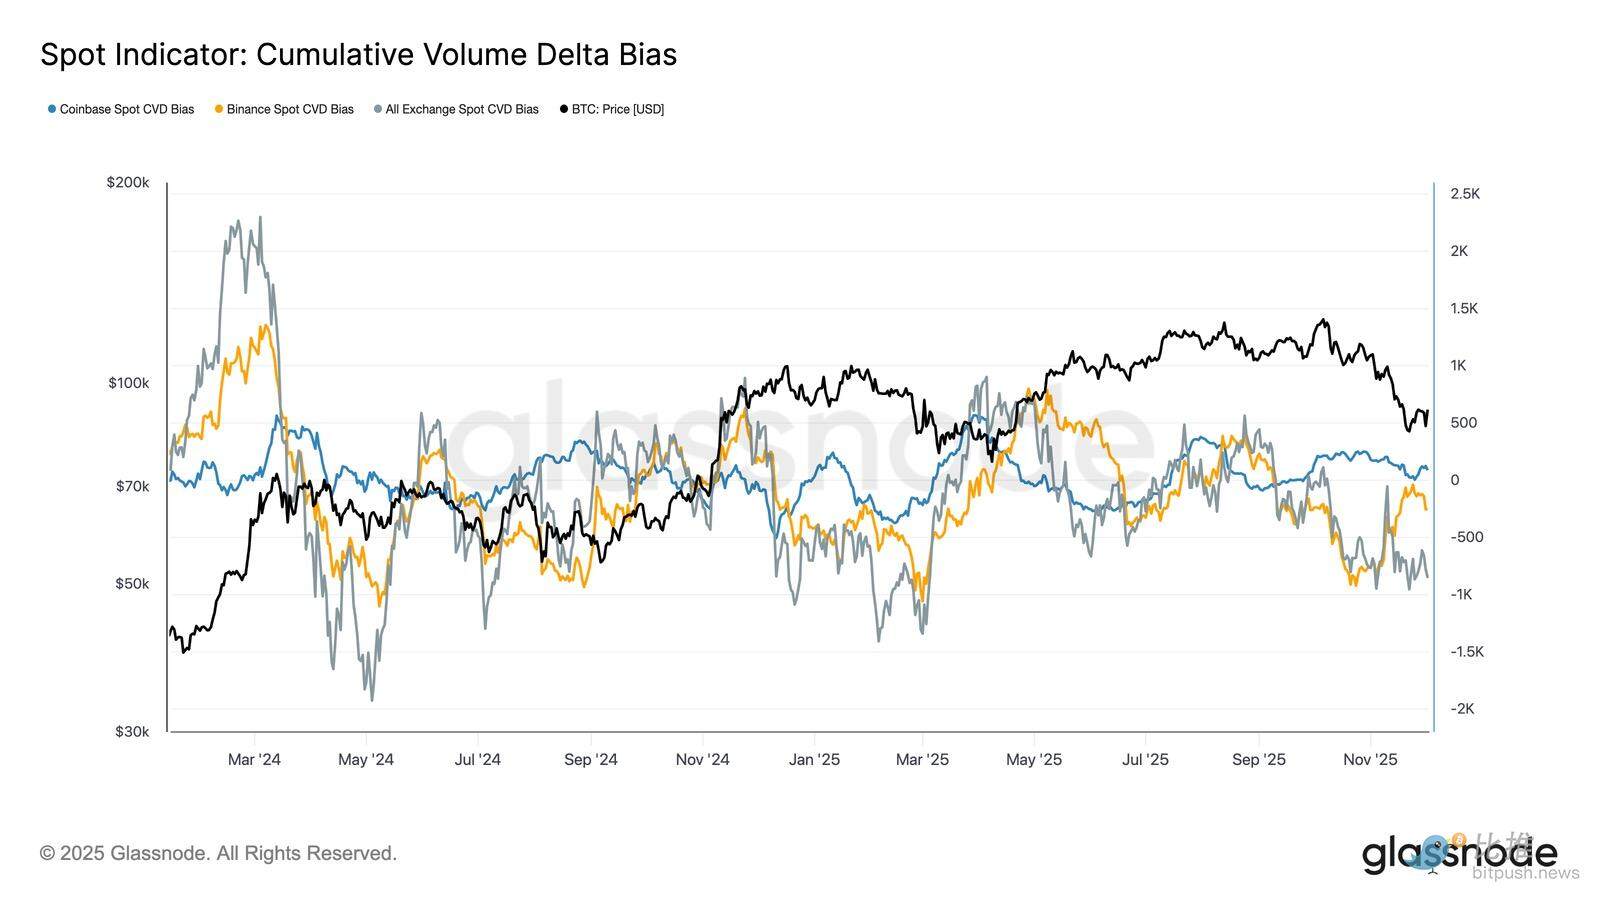
With ETF flows and spot CVDs shifting towards a defensive stance, the market now relies on a weaker demand base, making prices more vulnerable to sustained declines and macro-driven volatility.
Open interest continued to decline
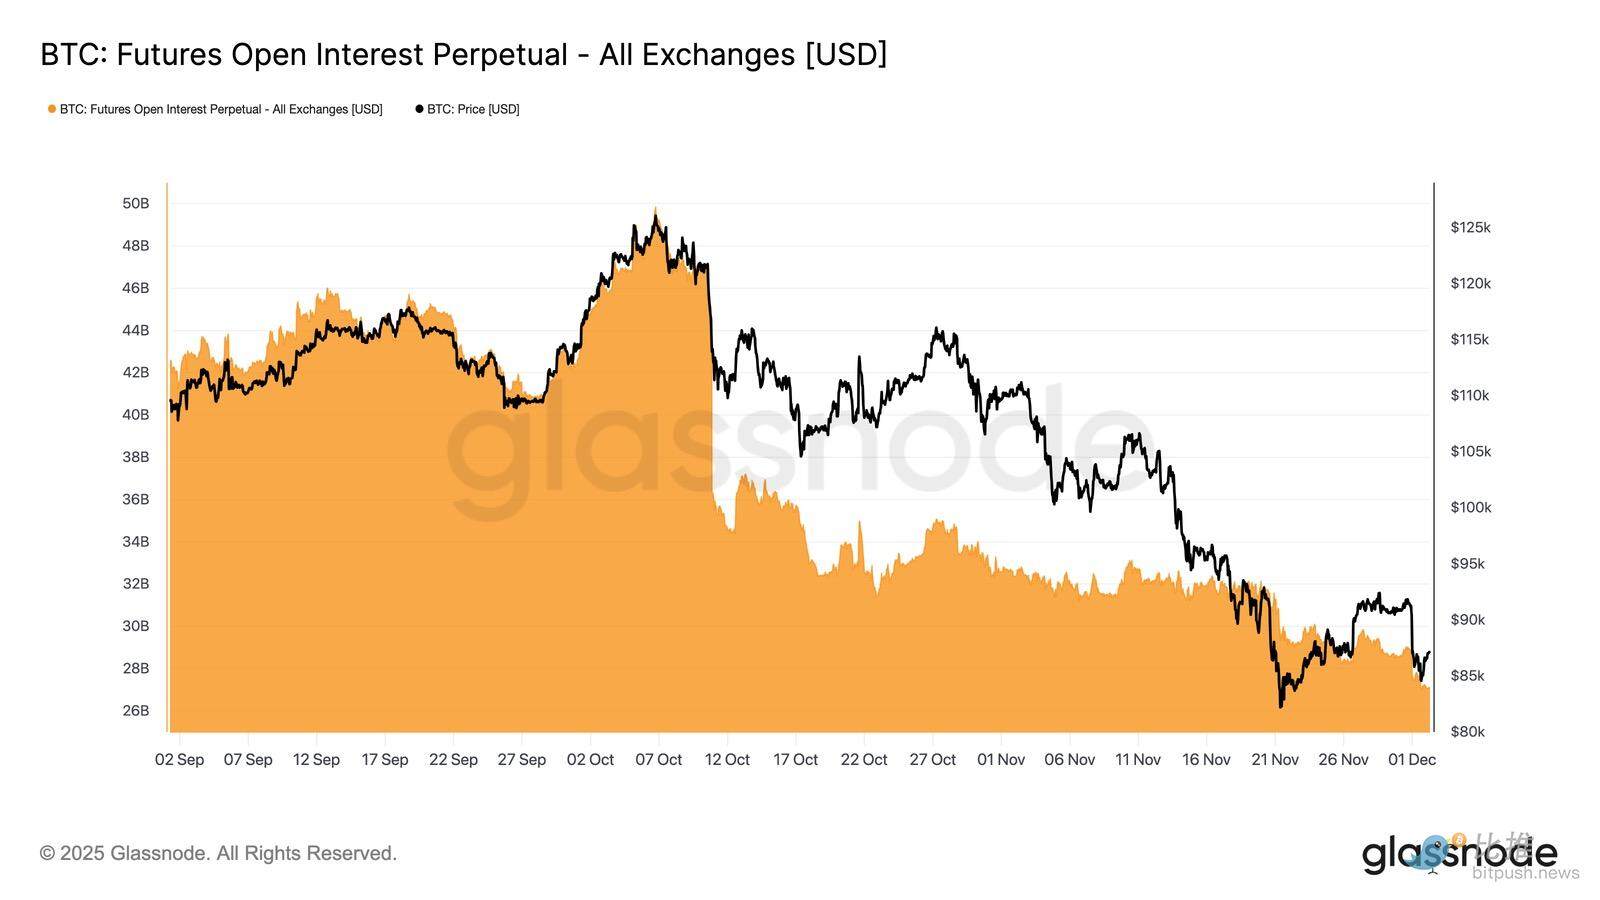
This weakening demand extended to the derivatives market, with futures open interest steadily declining throughout late November. While the unwinding was gradual, it was persistent, erasing much of the speculative positions accumulated during the previous upward trend. With no meaningful new leverage entering the market, traders appeared reluctant to express directional conviction, instead adopting a conservative, risk-averse stance as prices fell.
Derivatives are characterized by significantly lighter leverage, indicating a marked lack of speculative intent and reducing the likelihood of sharp volatility driven by liquidation.
Neutral funding rates signify a reset
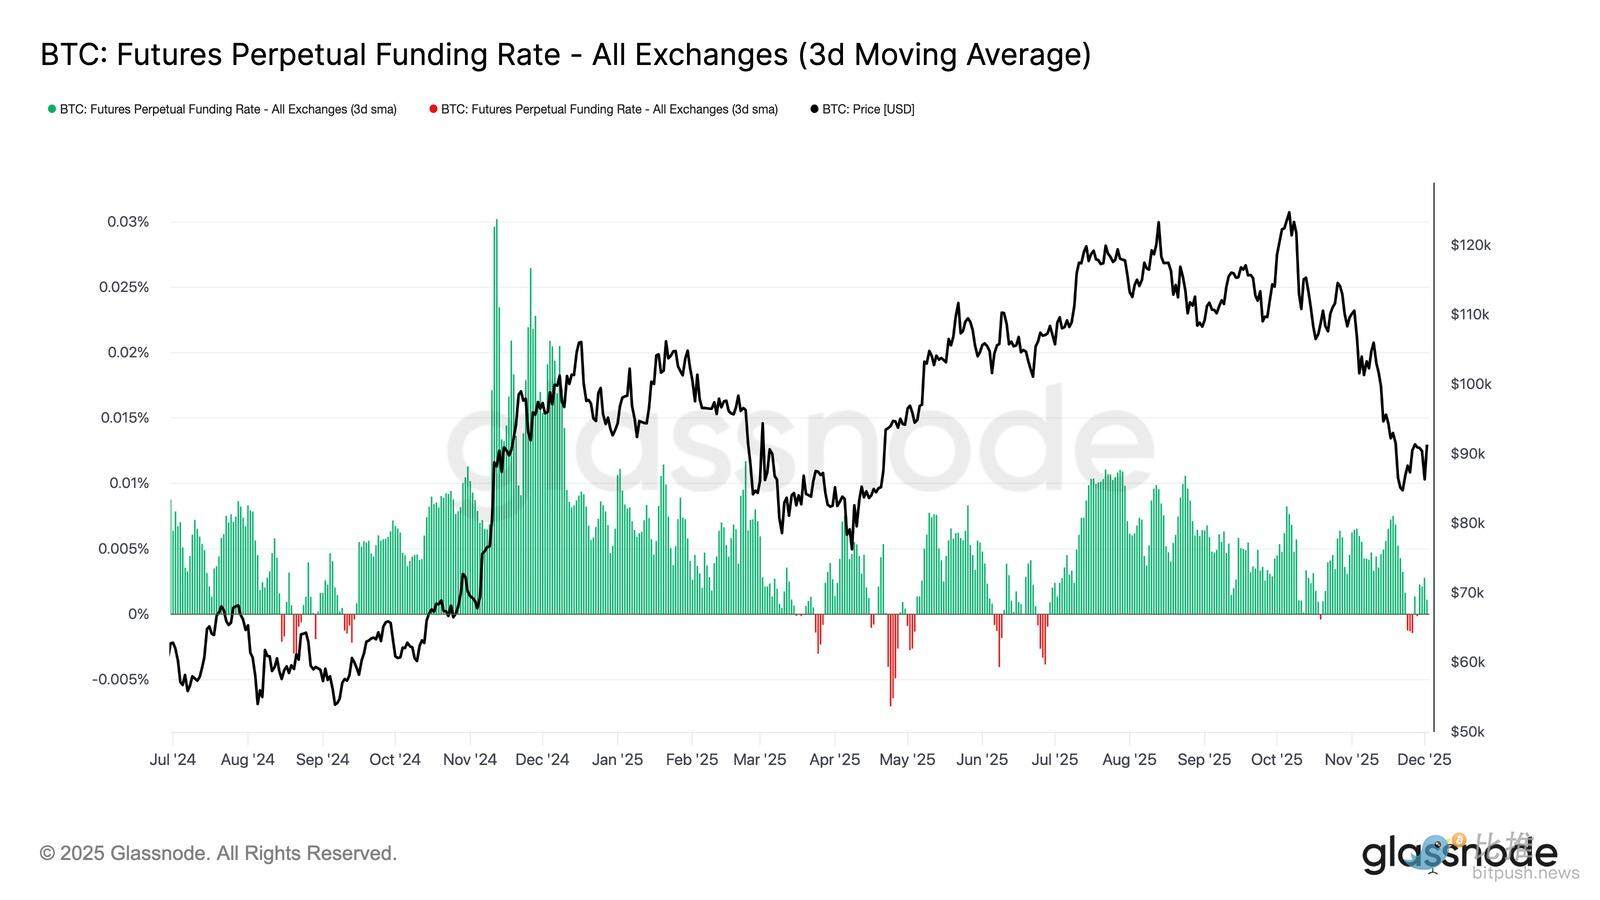
With open interest continuing to contract, perpetual funding rates have cooled to a broadly neutral level, fluctuating around zero for most of late November. This marks a significant shift from the high positive funding rates observed during previous expansion periods, indicating that excess long positions have been largely liquidated. Importantly, the period of mild negative funding rates was also brief and short-lived, suggesting that traders did not actively build short positions despite price declines.
This neutral to slightly negative funding structure suggests a more balanced derivatives market with a lack of crowded long positions, reducing downside vulnerability and potentially laying the groundwork for a more constructive positioning when demand begins to stabilize.
Implied volatility (IV) fully reset
Turning to the options market, implied volatility (IV) provides a clear window into how traders price in future uncertainty. Tracking implied volatility is useful as it reflects market expectations for future price movements. After high readings last week, implied volatility has reset and is trending lower. Price struggled to break through the 92K resistance level, and the rebound lacked follow-through momentum, prompting volatility sellers to re-enter the market, pushing implied volatility lower across the board.
- Short-term contracts decreased from 57% to 48%.
- The proportion of medium-term contracts decreased from 52% to 45%.
- Long-term contracts decreased from 49% to 47%.
This continued decline suggests that traders believe the likelihood of a sharp downturn has decreased and anticipate a calmer environment in the near term.
This reset also marks a shift towards a more neutral stance, as the market emerges from last week's heightened caution.

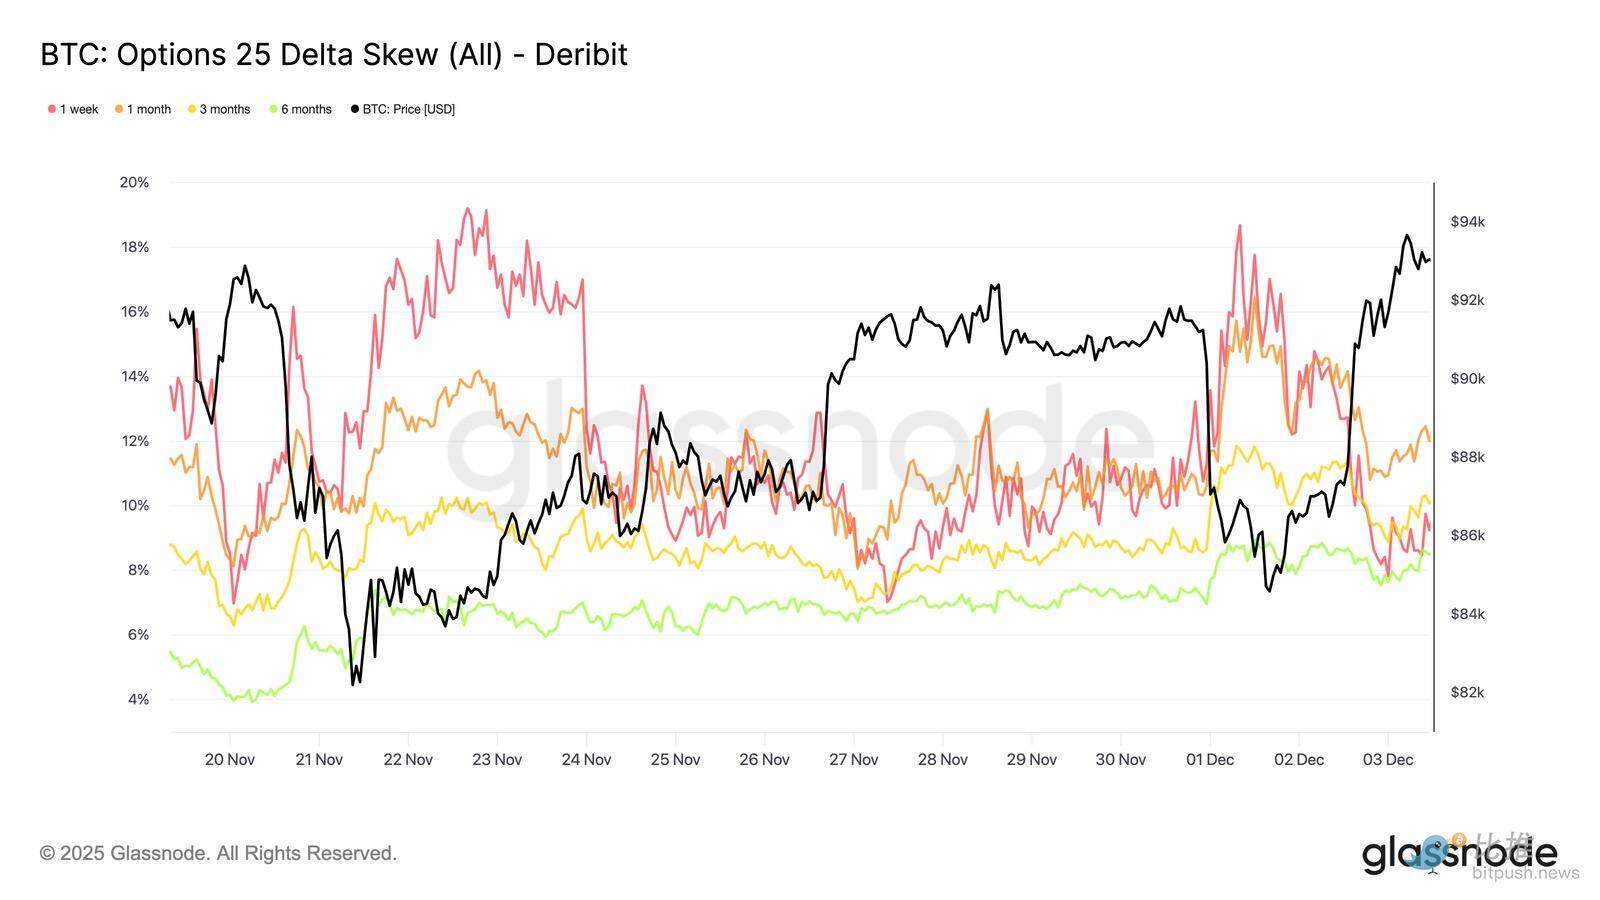
The bearish skew has eased.
After examining implied volatility, skewness helps clarify how traders assess downside and upside risk. It measures the difference between the implied volatility of put and call options.
When skewness is positive, traders pay a premium for downside protection; when skewness is negative, they pay more for upside exposure. The direction of skewness is just as important as its level.
For example, an 8% short-term skewness conveys a very different message if it decreases from 18% over two days rather than increasing from a negative value.
The short-term skewness moved from 18.6% on Monday (during the drop to 84.5K driven by the Japanese bond narrative) to 8.4% on the rebound.
This suggests that the initial reaction was exaggerated. Longer-term contracts adjusted more slowly, indicating that traders are willing to chase short-term upside, but their sustainability remains uncertain.
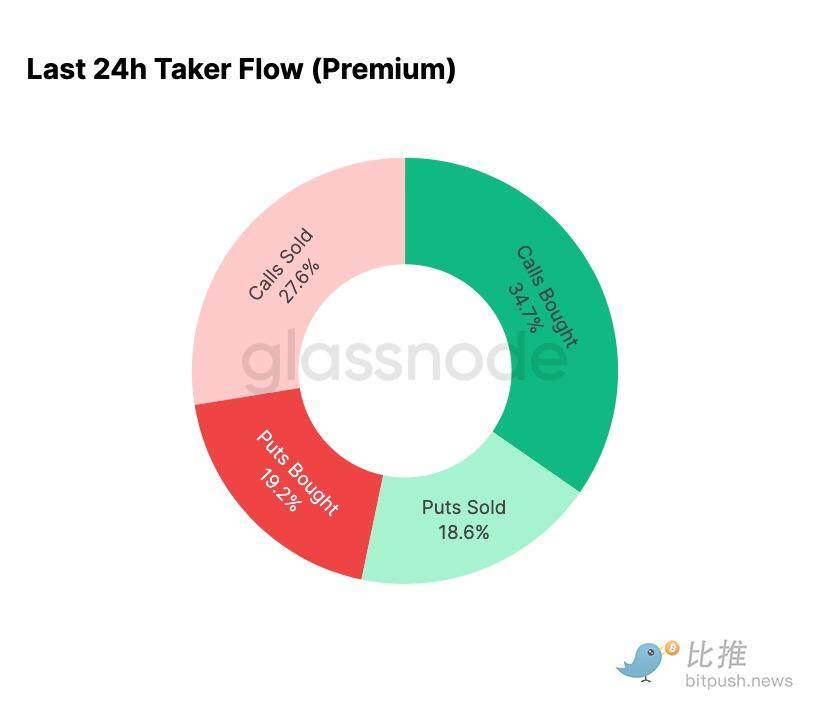
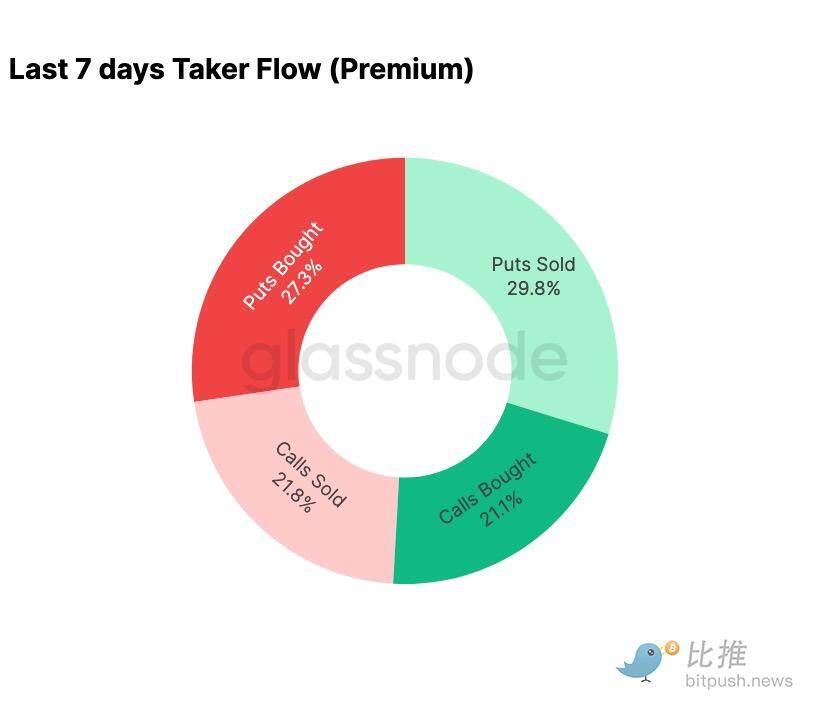
Fear subsided
Fund flow data shows a stark contrast between the past seven days and the subsequent rebound.
Earlier this week, activity was primarily driven by put option buying, reflecting fears of a repeat of the August 2024 price action, linked to concerns about the unwinding of potential Japanese carry trades. Having experienced this risk before, the market was already sensing how far such a spread could go and the subsequent recovery that would typically follow. Once prices stabilized, the flow of funds shifted rapidly: the rebound brought a decisive tilt towards call option activity, almost perfectly reversing the pattern seen during periods of stress.
It's worth noting that traders are still holding net long Gamma positions at current levels, and this could continue until December 26th (the largest expiry date this year). Such positions typically suppress price volatility. Once that expiry date has passed, the positions will reset, and the market will enter 2026 with a new set of dynamics.
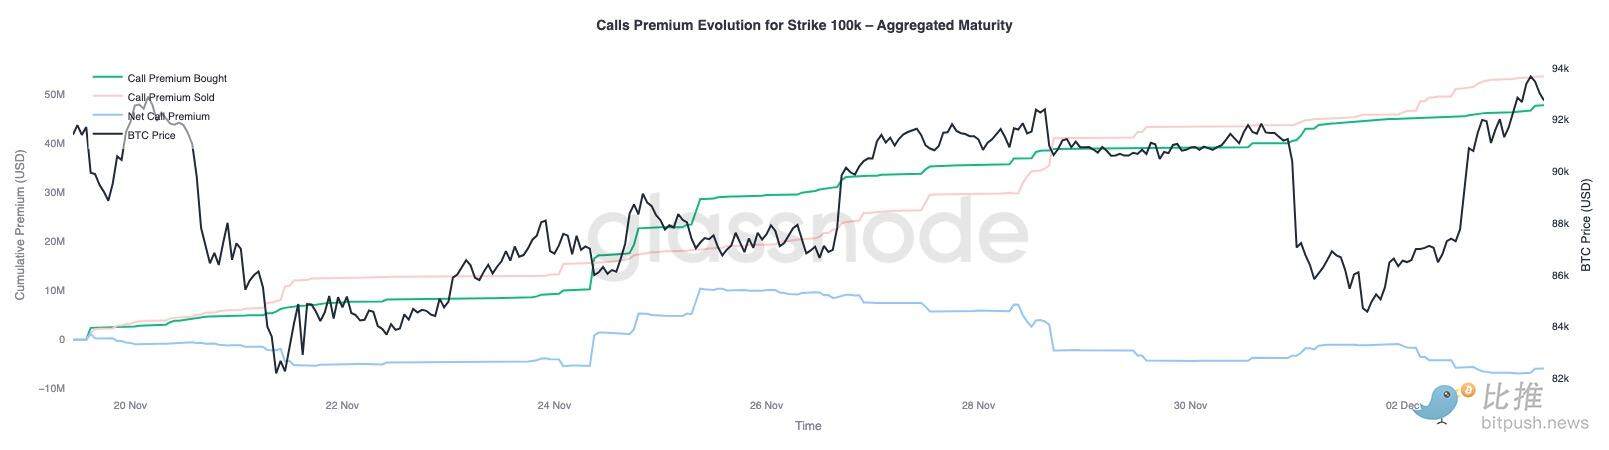
Evolution of the premium on a $100,000 call option
Watching the call option premium at a strike price of $100,000 helps clarify how traders are treating this key psychological level. On the right side of the chart, the call option selling premium remains higher than the call option buying premium, and the gap has widened during the rally over the past 48 hours. This widening suggests that conviction in reclaiming $100,000 remains limited. This level is likely to attract resistance, especially given the pattern of implied volatility compression on the upside and reconstruction on the downside. This pattern reinforces the mean-reverting behavior of implied volatility within its current range.
The premium overview also shows that traders did not establish aggressive breakout positions ahead of the FOMC meeting. Instead, fund flows reflect a more cautious stance, with upside being sold rather than chased. Therefore, the recent recovery lacks the conviction typically required to challenge the important $100,000 level.
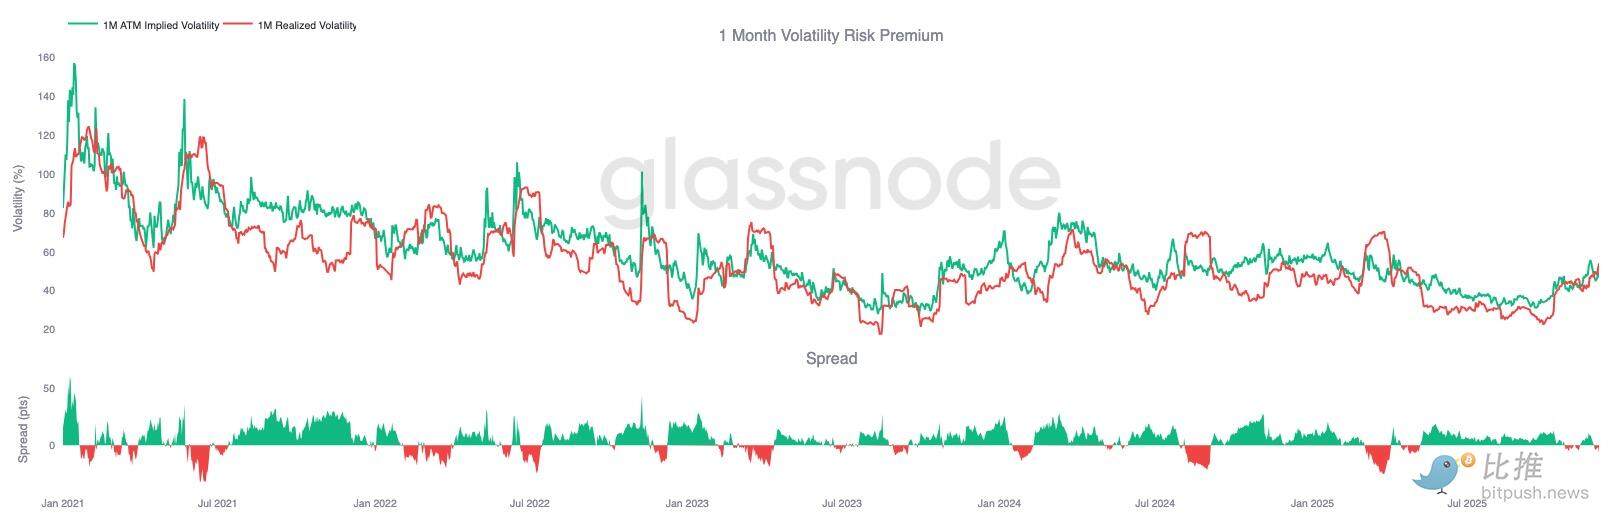
Volatility is underestimated
When we combine the reset of implied volatility with the sharp two-way swings this week, the result is a negative volatility risk premium. A volatility risk premium is typically positive because traders demand compensation for the risk of a surge in volatility. Without this premium, traders shorting volatility cannot monetize the risk they bear.
At current levels, implied volatility is lower than realized volatility, meaning that the volatility in option pricing is less than the volatility actually delivered in the market. This creates a favorable environment for long Gamma positions, as every price swing could potentially generate profit, provided the actual volatility exceeds the expectation implied by the option price.
in conclusion
Bitcoin continues to trade in a structurally fragile environment, with on-chain weakness and shrinking demand intertwined with a more cautious derivatives landscape. Prices have temporarily stabilized above the "real market mean," but the broader structure is currently highly similar to that of Q1 2022: over 25% of supply is underwater, realized losses have increased, and sensitivity to macroeconomic shocks has risen. While significantly weaker than earlier this year, positive capital momentum remains one of the few constructive signs preventing a deeper market collapse.
Off-chain indicators reinforce this defensive tone. ETF flows have turned to net outflows, the spot CVD indicator has declined, and futures open interest continues to decrease in an orderly manner. Funding rates are near neutral, reflecting neither bullish sentiment nor aggressive short-selling pressure. In the options market, implied volatility is compressing, skewness is softening, fund flows are reversing, and options are currently priced low relative to realized volatility, conveying caution rather than a renewed risk appetite.
Looking ahead, holding within the 0.75-0.85 quantile range (US$96.1K-106K) is crucial for stabilizing the market structure and reducing downside vulnerability before the end of the year.
Conversely, the "real market mean" remains the most likely area for a bottom to form, unless negative macroeconomic catalysts disrupt the market's already delicate balance.