Bitcoin and Global Liquidity: Follow or Lead?
- 核心观点:比特币在周期顶部引领全球流动性变化。
- 关键要素:
- 全球流动性解释90%比特币价格波动。
- 历史数据显示流动性变化滞后3个月影响资产。
- 财政紧缩可能成为新周期流动性收紧催化剂。
- 市场影响:风险资产可能面临流动性收紧压力。
- 时效性标注:中期影响
Original author: Michael Nadeau
Original translation: Chopper, Foresight News
There are many tools and frameworks for understanding Bitcoin price trends, such as the quantity equation of money (MV = PQ), stock-to-flow ratio, network value to transaction volume ratio, network value to Metcalfe's Law ratio, realized price to market capitalization ratio, production cost, etc.
But in the current market, everything ultimately comes down to liquidity conditions .
In this article, we will explore the relationship between Bitcoin and global liquidity: Is Bitcoin really "lagging" behind global liquidity ?
Bitcoin and Global Liquidity
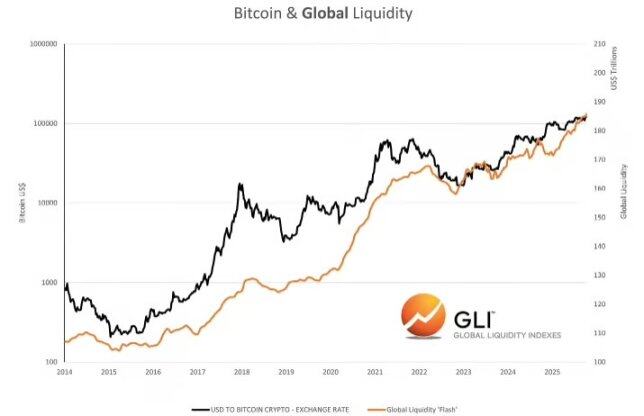
Data source: Global Liquidity Indexes
According to research from the Global Liquidity Indexes, "Historical data shows that changes in liquidity often trigger changes in risky asset prices, with a lag of approximately three months. Specifically, increases in global liquidity generally lead to positive performance in risky assets, while decreases in liquidity often signal weak asset price trends."
In addition, Raoul Pal of Global Macro Investor said that global liquidity can explain 90% of Bitcoin price fluctuations.
So what are the current data?
- The three-month annualized growth rate of global liquidity was 10.2%;
- Global liquidity is currently growing at 6% annually.
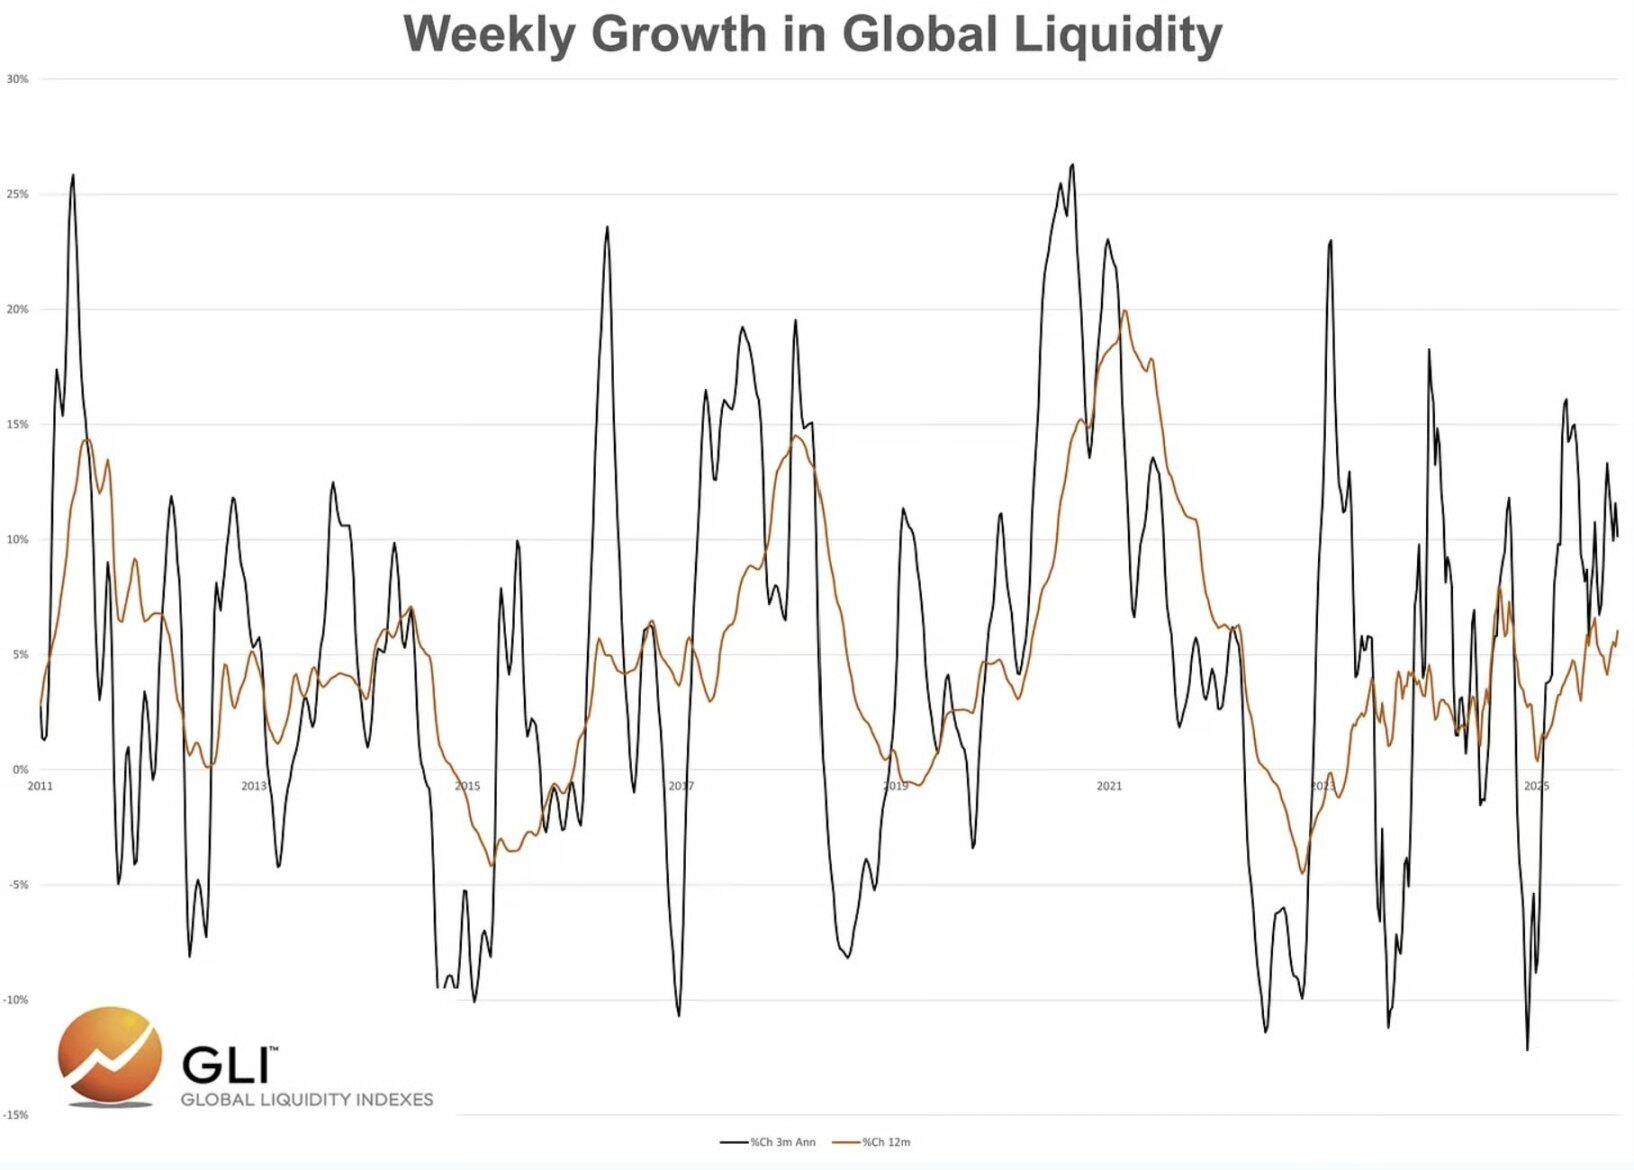
Data source: Global Liquidity Indexes
According to this data and logic, Bitcoin should continue to rise, right?
Judging from the data and conventional narrative, this conclusion seems to be true. However, in the previous two cycles, global liquidity continued to expand for a considerable period of time after Bitcoin reached its peak.
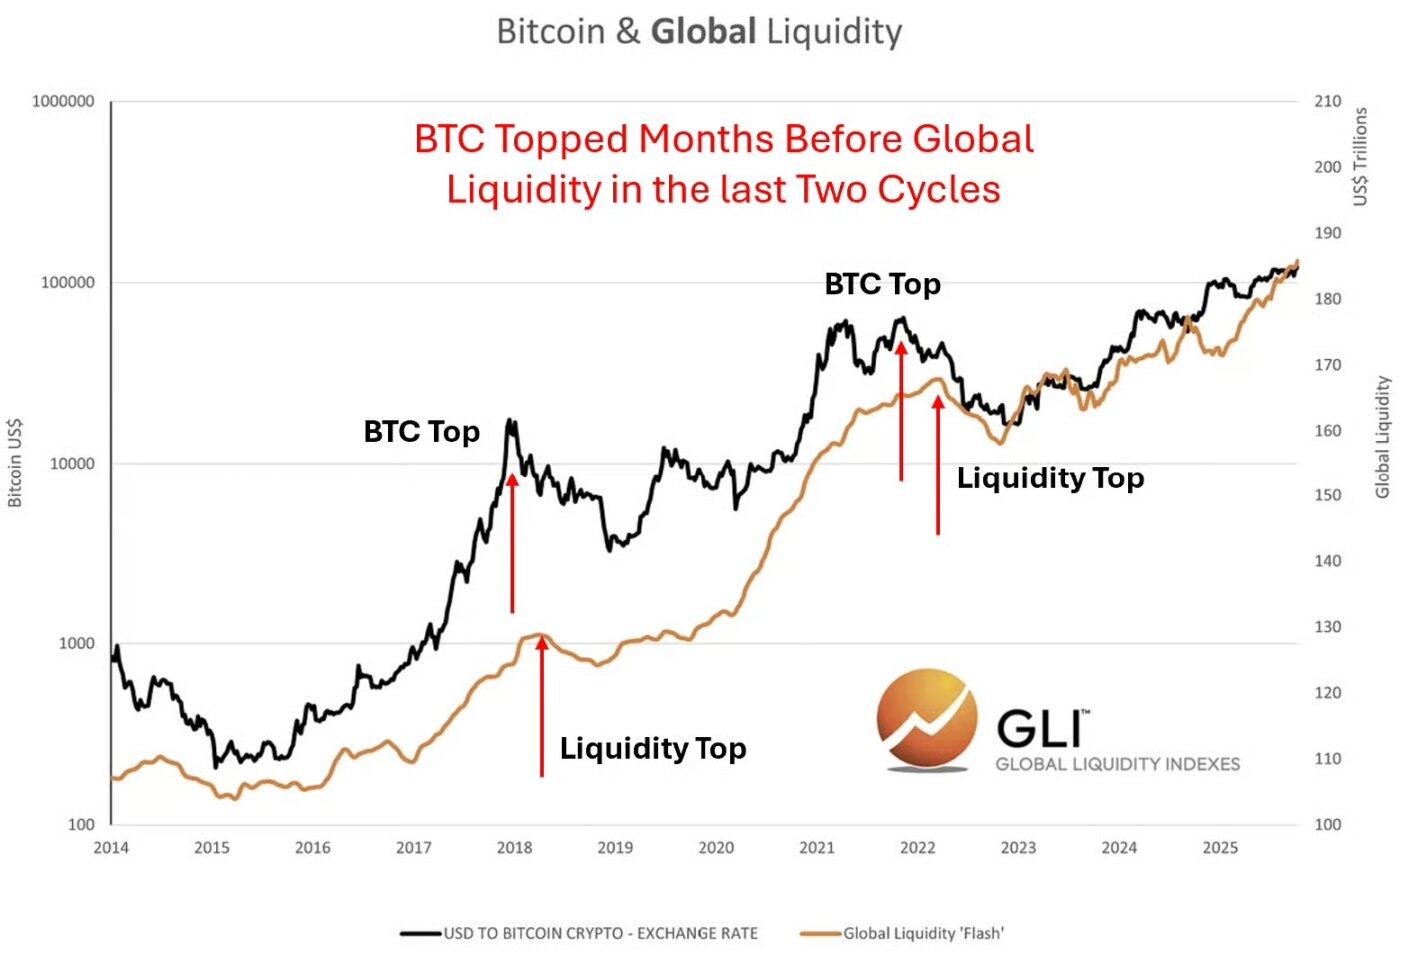
Data source: Global Liquidity Indexes
This phenomenon contradicts the common view that Bitcoin price lags liquidity.
Let’s pause for a moment and think about this question: Why does Bitcoin lag behind liquidity conditions?
After all, markets are forward-looking; and since Bitcoin trades 24/7 across global markets, why would it lag liquidity, a key price-correlated variable recognized by market participants?
In fact, we believe Bitcoin is leading global liquidity, especially at market cycle tops.
Why? We believe that the market is reflecting the trend of liquidity tightening in advance and can smell the next changes.
But at market bottoms (bear markets), the opposite is true, and global liquidity tends to lead Bitcoin.
Why? Because in a bear market, markets typically wait for clear signals from monetary and fiscal authorities before taking action.
It should be noted that we have not yet confirmed this view through quantitative analysis, but by analyzing the charts, we can support this judgment.
Assuming that global liquidity will expand again after Bitcoin reaches its peak, our core task is to identify the catalyst that causes global liquidity to decline.
In the previous cycle, the catalyst was high inflation and the Federal Reserve was forced to raise interest rates rapidly. This was the reason why the market "positioned in advance" in November 2021. The liquidity contraction at that time was driven by the central bank's monetary policy.
So what might be the catalyst for this cycle?
In the current cycle, the pressure to tighten liquidity may not come from the Federal Reserve (the market expects the Fed to cut interest rates in October and December), but from fiscal policy.
Expected fiscal impact: Tariff increases and BBB spending cuts
Expected Tariff Revenue : Assuming a 13% tariff rate, this would raise an estimated $380 billion in tariff revenue annually. The chart below illustrates the impact of tariffs to date.
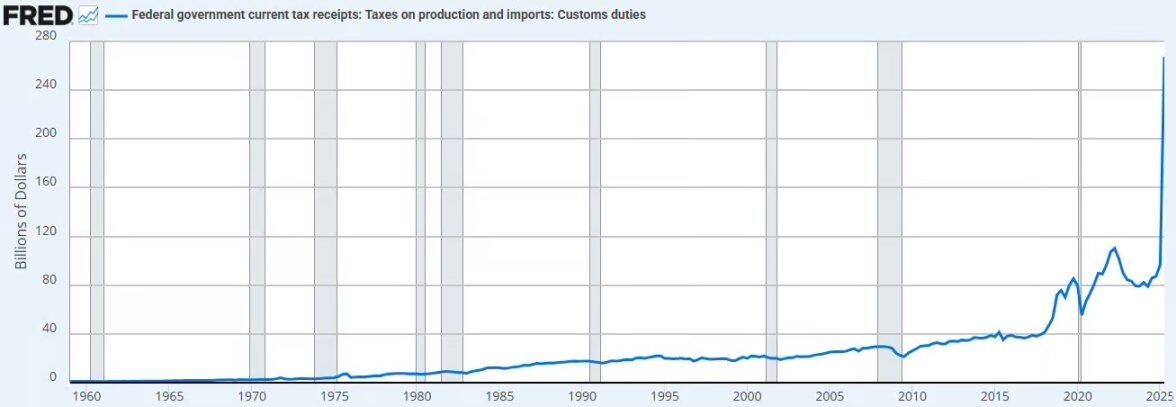
Data source: Federal Reserve Economic Database
This will result in liquidity being withdrawn from the private sector and flowing back into the public sector's fiscal accounts.
We believe that this move will bring deflationary pressure, even if it does not cause it.
Spending cuts : The Congressional Budget Office (CBO) projects that spending will be cut by $1.2 trillion to $1.3 trillion over the next decade, including Medicaid reform and budget cuts to the Supplemental Nutrition Assistance Program (SNAP), equivalent to approximately $125 billion in annual spending cuts.
Combining the tariff increases with the spending cuts would result in a combined fiscal contraction of $505 billion per year, or 1.7% of U.S. GDP.
However, in 2026, the United States will implement effective tax reduction policies for businesses, including tax exemption for tip income, and will also increase spending by $35 billion annually on infrastructure, national defense, rural hospitals, the National Aeronautics and Space Administration (NASA) and other areas.
These measures may offset the fiscal tightening caused by tariffs and spending cuts, but will they be enough?
If Bitcoin does lead liquidity again at the top of the cycle, then we believe that it is currently "pre-positioning" for the negative impact of fiscal policy tightening on liquidity.
You might often hear Bessant say in interviews: "We want to stimulate the economy through the private sector."
We agree with this direction, but achieving this goal may be full of twists and turns. This is why the Trump administration insists on significantly cutting interest rates to pave the way for our transition to a new economic model.
Banking liquidity
In addition to the potential fiscal policy changes mentioned above, we also observe that banking sector liquidity is tightening.
In the chart below, we can see a growing imbalance between liquidity and available collateral among market maker banks during the overnight funding period. This suggests that the money market is facing a liquidity shortage, with market makers either short on cash or collateral.
This phenomenon is consistent with the following factors:
- fiscal austerity;
- The Federal Reserve continues to shrink its balance sheet;
- Reconstruction of the balance of the Treasury General Account.
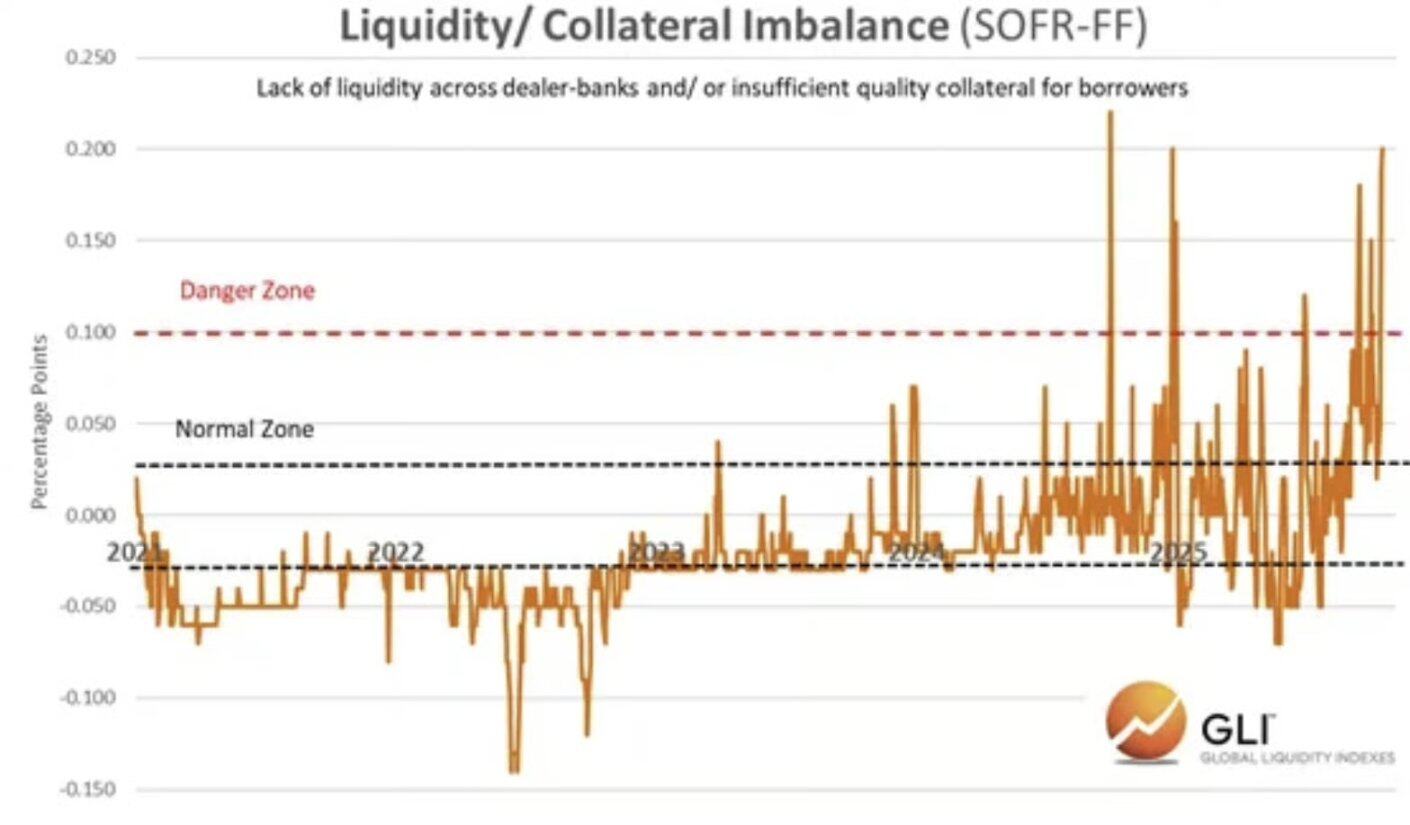
Data source: Global Liquidity Indexes
As these factors play out, bank reserves are approaching the shortfall level set by the Federal Reserve .
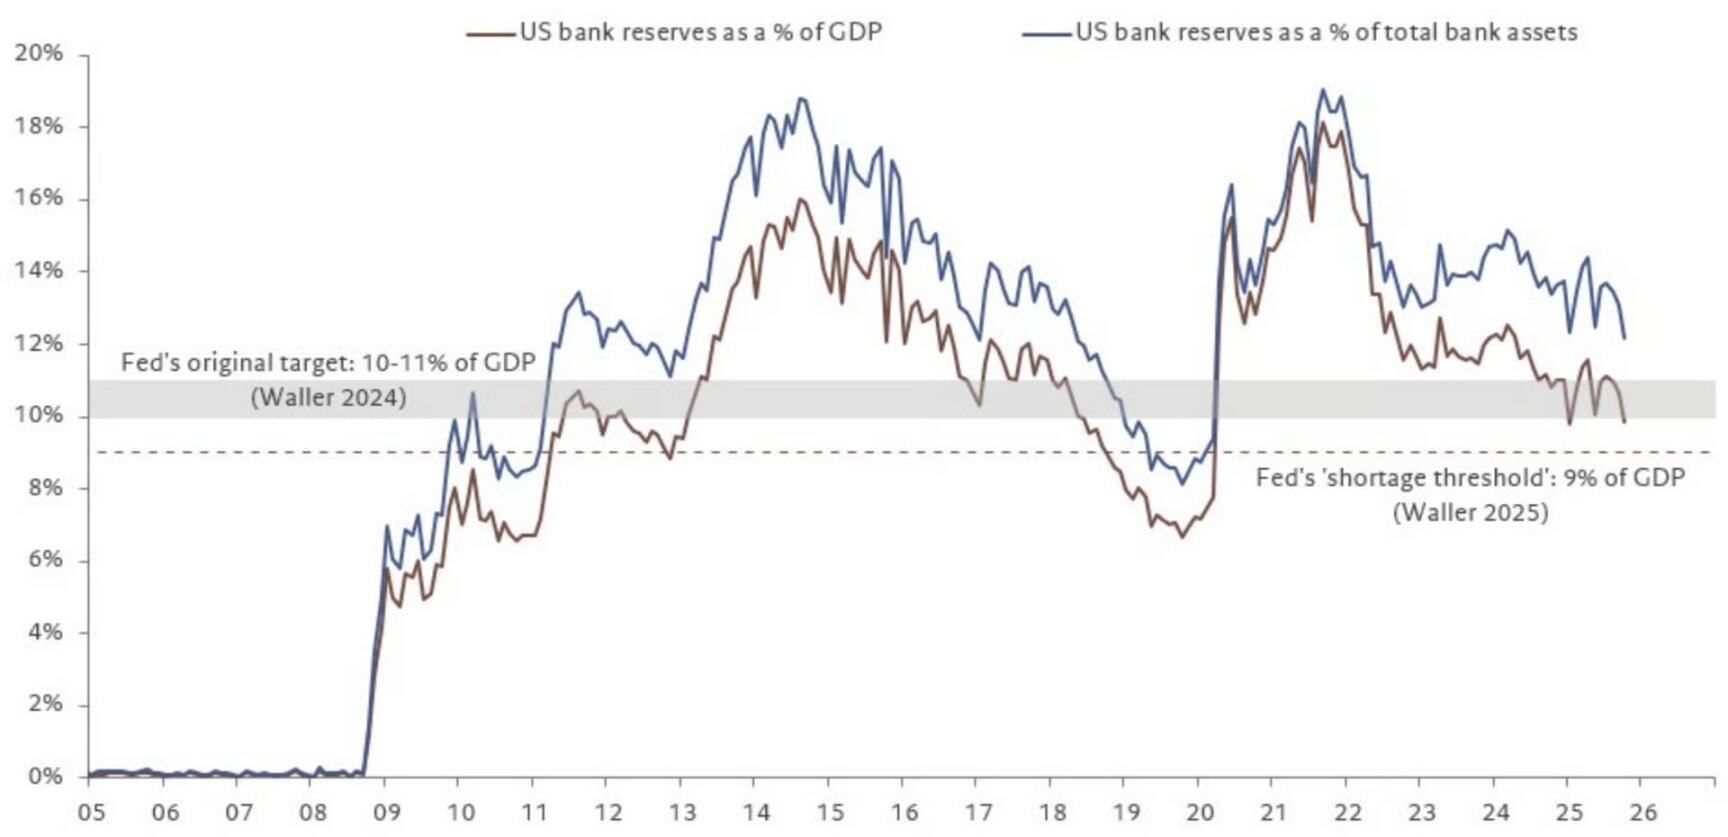
Data source: @fwred
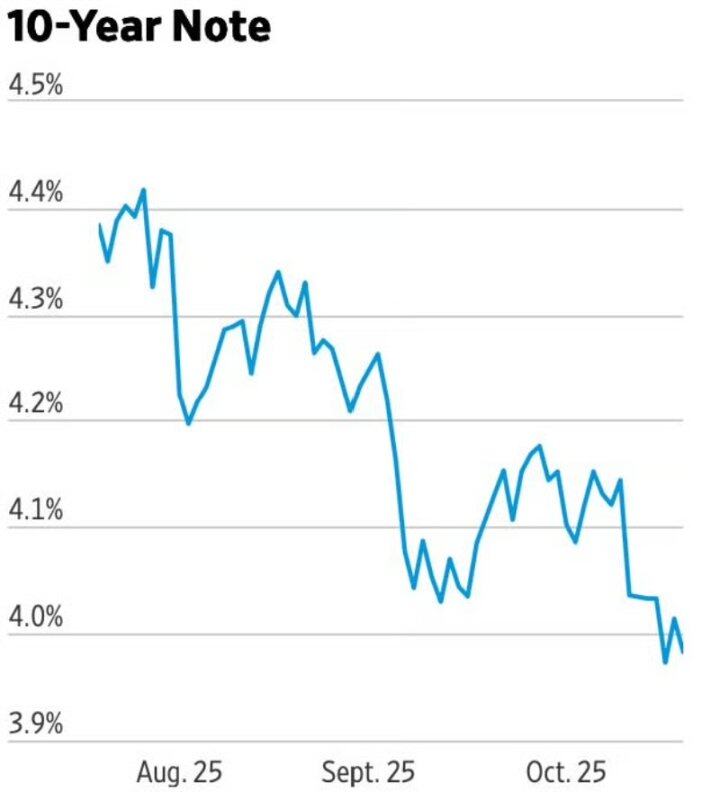
In summary, all signs indicate that trouble is brewing, and the performance of the bond market seems to confirm this.
Summarize
It is clear that Bitcoin led global liquidity at the top of the previous two cycles. In the 2021 cycle, Bitcoin sensed the trend of high inflation and interest rate hikes in advance; at that time, the Biden administration was pushing the economy to transition to a fiscal-led model, which is the core factor driving Bitcoin liquidity in this cycle.
So what now?
We are gradually transitioning away from a fiscally dominated model, and in our view, risk assets are likely to be negatively impacted by this transition.