Original author: BitMEX
Long story short:
With the explosive growth of decentralized derivatives platforms like Hyperliquid and the launch of Pendle Funding Exchange, the cryptocurrency funding market is evolving. Specifically, two structural forces can be attributed to the dynamics of the funding market, creating predictable trading opportunities:
1. Anchor Point (Lower Bound) of the Formula: The perpetual swap contract formula has a built-in interest rate component, forcing interest rates to converge around 0.01% (positive deviation). Data shows that in the third quarter of 2025, over 92% of funding rates were positive.
- Trader Action: Don't bet on continued negative interest rates. The formula is actively pushing rates higher.
2. Arbitrage Capital (Cap): Billions of dollars of institutional capital, including participants like Ethena, immediately short high-premium contracts when interest rates spike.
- Trader Action: Don't expect high rates to persist. Spikes are short-lived as arbitrage activity quickly pushes premiums and rates back down to the 0.01% baseline.
Compared to Binance and Hyperliquid, BitMEX's funding rate is the most stable, reaching the 0.01% anchor more often than other exchanges. In terms of volatility, ETH has a higher Beta value than BTC.
To succeed in funding rate trading, you must understand market structure, not market sentiment.
introduction
Nine years ago, BitMEX invented perpetual swaps, fundamentally changing the way people trade cryptocurrency. In our previous Q2 derivatives report , "The Evolution of Funding Rates: A Nine-Year Analysis of BitMEX XBTUSD Funding Rates ," we detailed its journey from a volatile, speculative instrument to a mature, stable market. Now, we are witnessing the next stage of this evolution: the emergence of a dedicated funding rate trading market.
Funding rate trading allows traders to speculate on prices and trade the underlying mechanics of the market itself. But what drives these mechanics? In this report, we delve into the dynamics of the perpetual swap market and the funding rate formula, providing key insights for cryptocurrency traders.
Our research highlights two powerful forces influencing funding rates: the gravitational pull of the 0.01%/8-hour funding rate formula and the immense power of institutional arbitrage capital that enforces that formula. This report explores these findings, based on data from Q3 2025, and provides key takeaways for traders based on this structural understanding.
A Review of the Nine-Year Evolution of Funding Rates
As we’ve explored in previous reports , the crypto funding rate market for major tokens like Bitcoin is mature. During the early bull run for perpetual swaps, Bitcoin funding rates regularly exceeded 0.2% per 8-hour period, equivalent to an annualized interest rate exceeding 200%. 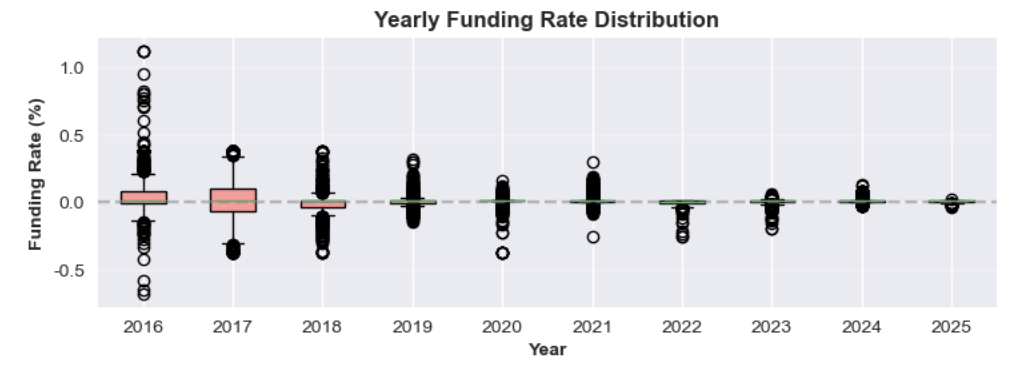
Figure 1: Annual Funding Rate Distribution from 2016 to 2025
Over the years, this volatility has gradually subsided as the market deepened and more institutional capital flowed in. The 2024-2025 cycle established a new normal: the average funding rate currently hovers around a stable 0.01%/8-hour baseline. This occurs when perpetual swap premiums are extremely low, leading to the default peg of the rate to its interest rate component—a sign of systemically efficient financial markets.
Analyzing the Funding Rate Structure
Why has the funding rate market experienced such dramatic changes? This phenomenon can be explained by two key factors:
1. The funding rate formula stipulates that when the perpetual contract price deviates slightly from the spot price, the rate defaults to the base rate of 0.01%/8 hours.
2. A large amount of funds are used for basis trading to obtain high funding rates.
Let’s explore these concepts in more detail.
Factor 1: Anchor of the Formula (Secret Positive Bias)
The funding rate for perpetual swaps aims to keep the contract price aligned with the spot price of the underlying asset. On BitMEX and some other exchanges, the funding rate is calculated every eight hours using a formula consisting of two main components: a premium index and an interest rate, balanced by a clamp mechanism.
The general formula for funding rates on exchanges like BitMEX, Binance, and Hyperliquid is:
F=P+clamp(I−P,−0.05%,0.05%)
Below is a detailed explanation of each part of the formula.
- Funding Rate (F): The periodic payment between long and short positions in a perpetual swap contract.
- Average Premium Index (P): measures market sentiment by tracking the difference between the perpetual contract price and the spot price. Calculated as the average value over the funding period.
If P is positive , it means the contract is trading at a premium (higher than the spot price). Long positions pay for short positions.
If P is negative , it means the contract is trading at a discount (below the spot price). Short positions pay for long positions.
- Interest Rate (I): A fixed rate, typically set at 0.01% for 8 hours (or 10.95% annually). 0.01%/ was originally an arbitrary number set by BitMEX to incentivize arbitrage traders to provide liquidity.
- Clamp(x, min, max): A buffering mechanism used to ensure that the difference between the interest rate and the premium index (I-P) does not become too large. The upper limit of the difference is +0.05% and the lower limit is -0.05% to prevent excessive fluctuations in the funding rate.
Scenario 1: Slight premium/discount, funding rate = 0.01%/8 hours
A key feature of this formula is its ability to keep the funding rate stable at the benchmark rate (0.01%) when markets are relatively calm.
Golden Rule: As long as the average Premium Index (P) remains within the range of -0.04% to +0.06%, the Funding Rate (F) will be exactly 0.01%.
Within this range, the Clamp function can perfectly offset the premium or discount, causing the funding rate to default back to the interest rate.
Example A: Small Premium
Assume the average premium index (P) is +0.02%.
1. Calculate the difference: I − P = 0.01% − 0.02% = − 0.01%
2. Apply the clamp function: Since -0.01% is within the range [-0.05%, +0.05%], the clamp value is -0.01%.
3. Calculate the final interest rate: F = P + (clamp value) = 0.02% + (−0.01%) = 0.01%
Example B: Small Discount
Now, assume that the average premium index (P) is -0.03%.
1. Calculate the difference: I − P = 0.01% − (−0.03%) = 0.04%
2. Apply the clamp function: Since 0.04% is within the range [-0.05%, +0.05%], the clamp value is 0.04%.
3. Calculate the final interest rate: F = P + (clamp value) = −0.03% + 0.04% = 0.01%
Both examples show that regardless of whether the average premium index (P) is slightly higher or lower than the funding rate, the final interest rate is always 0.01%
Scenario 2: Positive Deviation (Funding Rate is Positive during Discount Period)
A key design feature of many perpetual swaps is their inherent positive bias . This means that even if the contract is trading at a slight discount, long positions will typically still pay a small fee to short positions. This is because a fixed positive interest rate (I=0.01%) acts as a floor.
This also explains why the funding rate is usually a small positive number (such as 0.005%) rather than a negative number.
Example: Perpetual Contract Discount with Positive Funding Rate
Assuming a bearish market, the average premium index (P) falls to -0.045%.
1. Calculate the difference: I − P = 0.01% − (−0.045%) = 0.055%
2. Apply the clamp function: The difference of 0.055% exceeds the upper limit of the clamp function. Therefore, the clamp function forces the value down to a maximum of 0.05%.
3. Calculate the final rate: F = P + (Clamping Value) = −0.045% + 0.05% = 0.005%
In this example, even though the perpetual contract is trading below the spot price, the funding rate remains positive. Longs are still paying shorts, indicating that structural bias favors short positions with a positive bias.
Scenario 3: When the funding rate becomes zero or negative
For funding rates to become neutral or negative, the market discount must be significant enough to overcome the positive bias introduced by interest rates.
- When the Premium Index (P) is exactly -0.05%, the funding rate becomes 0.00%.
○ I−P=0.01%−(−0.05%)=0.06%
Clamp the value to 0.05%
○ F = P + (Clamping value) = −0.05% + 0.05% = 0.00%
● When the average premium index (P) falls below -0.05% , the funding rate becomes negative . For example, if P = −0.10%, the funding rate will become negative, and shorts will start paying longs to incentivize buying, pushing the contract price back to near the spot price.
Factor 2: Massive interest rate arbitrage capital
The funding rate formula defines the rules, while arbitrage capital enforces them. Currently, open interest in major tokens (Bitcoin, Ethereum, and Solana) on major cryptocurrency exchanges has reached tens of billions of dollars. From proprietary trading firms to DeFi protocols like Ethena, arbitrageurs have billions of dollars in capital ready to deploy as soon as funding rates become attractive. When perpetual swaps experience high premiums, these institutions sell their perpetual swaps and buy spot assets to capture the high funding rates, thereby compressing the premium. 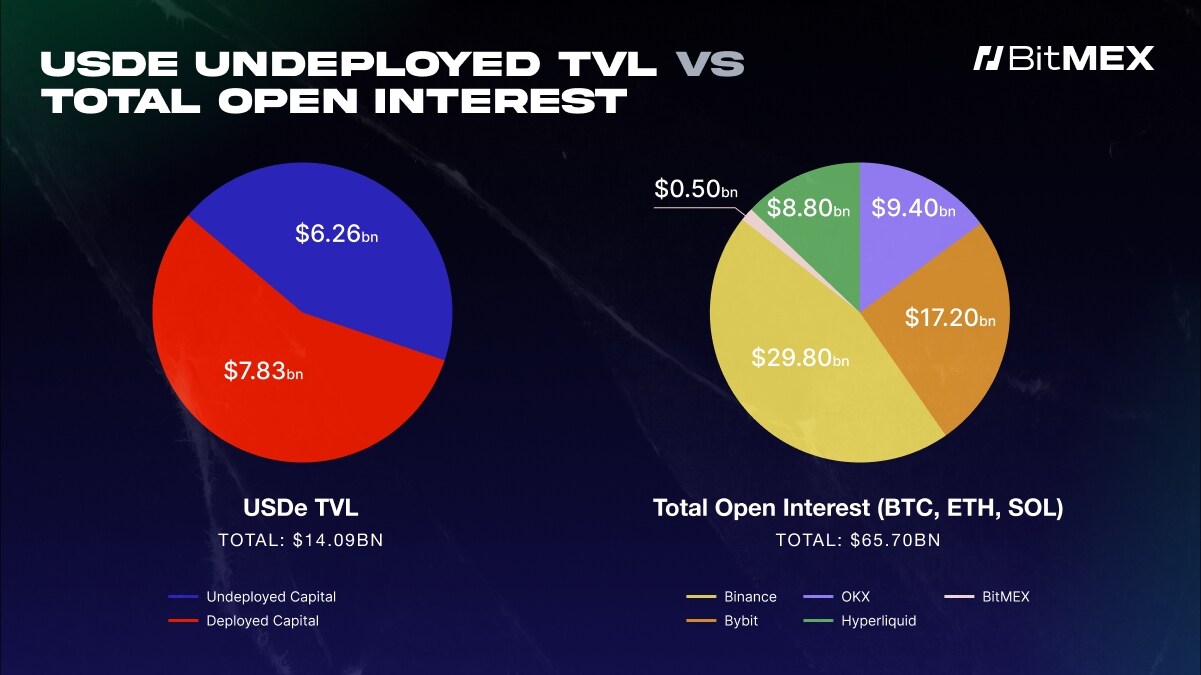
Figure 2: Total value locked in Ethena (USDe) and total open interest in BTC, ETH, and SOL on major cryptocurrency exchanges on September 25, 2025
Figure 2 clearly illustrates how Ethena's USDe (a major funding rate arbitrage platform) plays a significant role in explaining the temporary high funding rates. The pie chart on the left shows that Ethena (USDe) has $7.83 billion in undeployed funds. The pie chart on the right shows the total open interest across major exchanges (as of September 21, 2025), which stands at $65.7 billion. Comparing the two pie charts clearly demonstrates the outsized role played by a single protocol like Ethena— its undeployed funds account for as much as 12% of the market's open interest.
Whenever funding rates become attractive, institutions deploy their available funds to capture profits. This arbitrage strategy drives high funding rates down.
In short, the large pool of undeployed capital acts as a ceiling on funding rates, preventing them from remaining elevated for long.
Practical Viewpoint: Review of Funding Rates in the Third Quarter of 2025
To analyze the validity of the aforementioned theories regarding the lower and upper limits of funding rates, we analyzed funding rate data from BitMEX, Binance, and Hyperliquid for Q3 2025. This data confirms the two core theories discussed in the previous section:
1. The funding rate remains positive for the vast majority of the time, driven by a structural positive bias in the calculation formula.
2. Funding rates rarely stay well above the 0.01% baseline because large amounts of arbitrage funds from institutions like Ethena intervene, compressing high premiums.
Figures 3 and 5 show the funding rate history for BTC and ETH through Q3 2025, confirming two of our core findings. First, the funding rates for all three platforms remained positive for the vast majority of the quarter, a direct result of the formula's structural positive bias. Second, it demonstrates that the funding rates for BitMEX and Binance remained tightly anchored around the 0.01% baseline, reflecting the strong effect of arbitrage capital.
A notable exception is Hyperliquid, whose funding rate exhibits significant volatility and frequently spikes well above this baseline - a phenomenon we will examine in the next section. 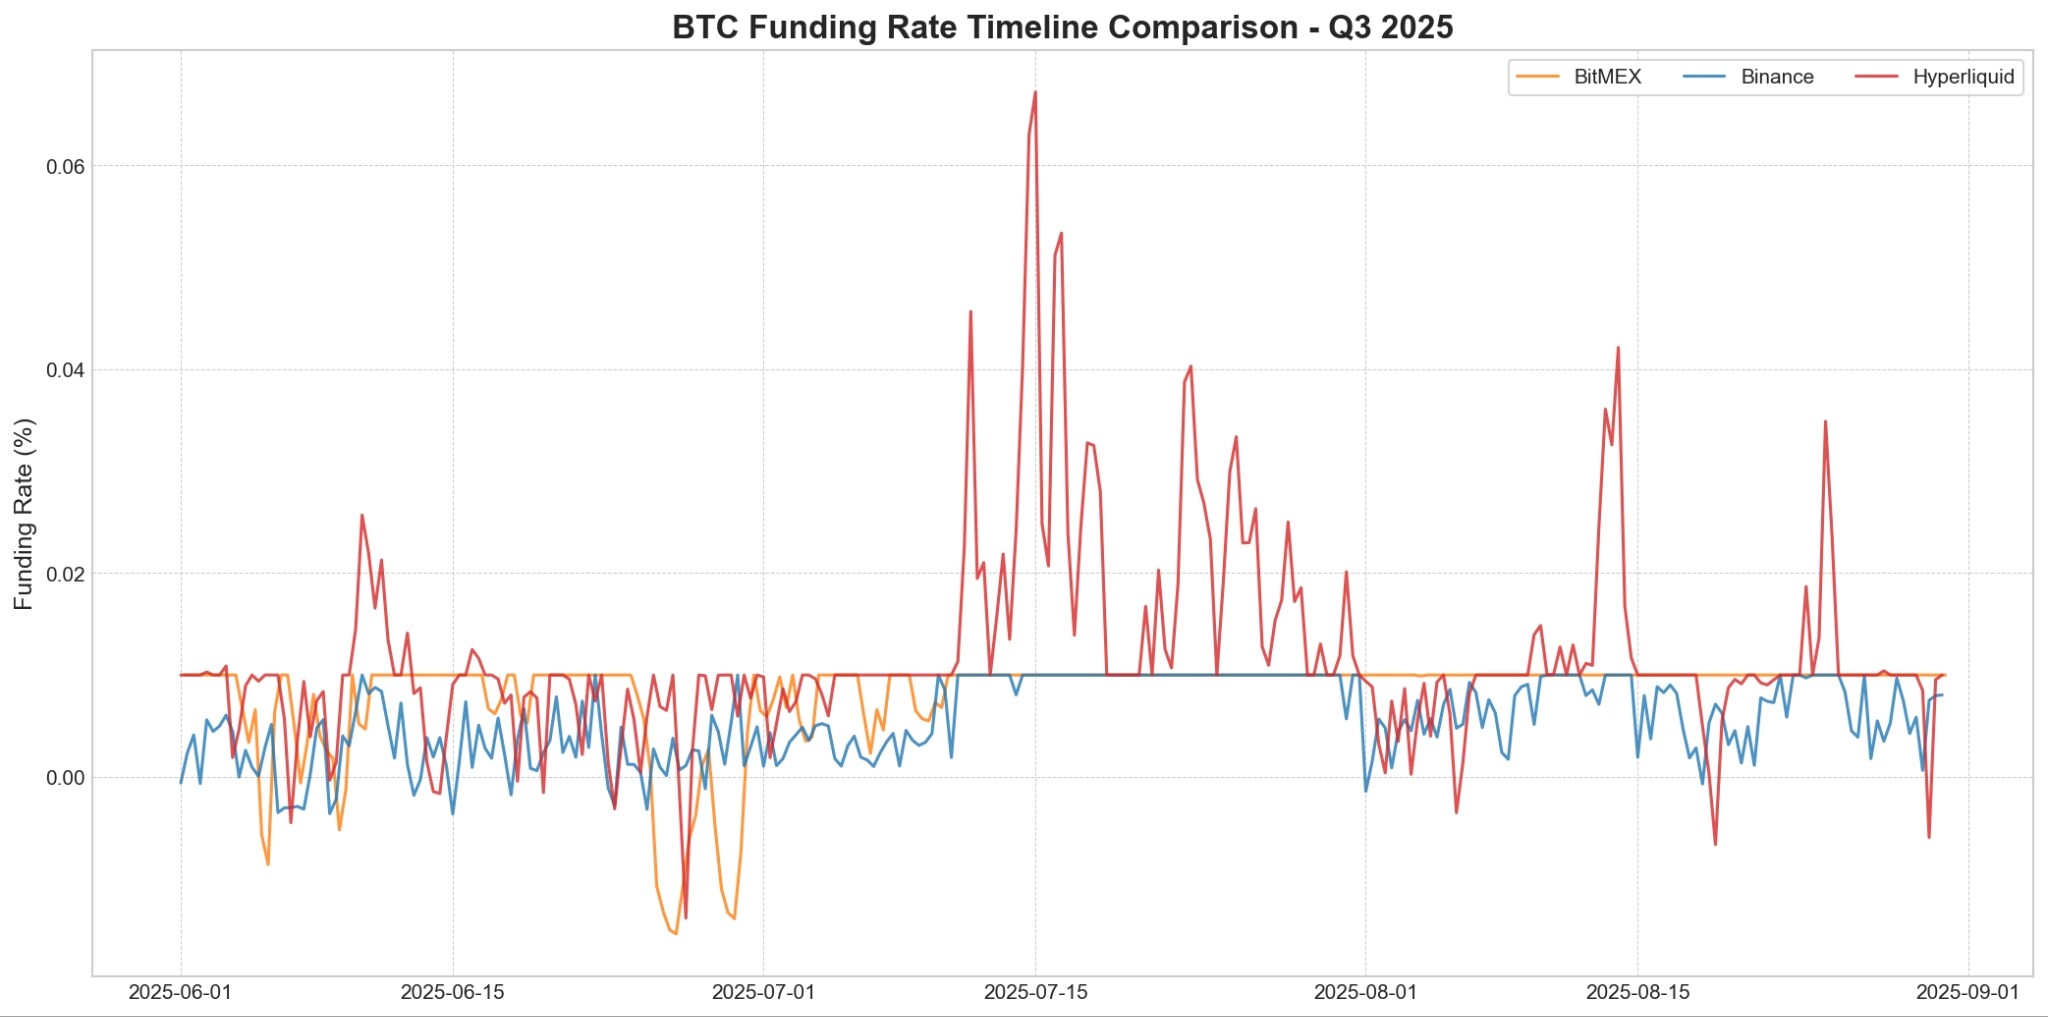
Figure 3: Differential trends in BTC funding rates across exchanges in Q3 2025. Hyperliquid (red) exhibits significant volatility, with sharp increases often exceeding the 0.01% cap. In contrast, BitMEX (orange) and Binance (blue) offer more stable interest rates.
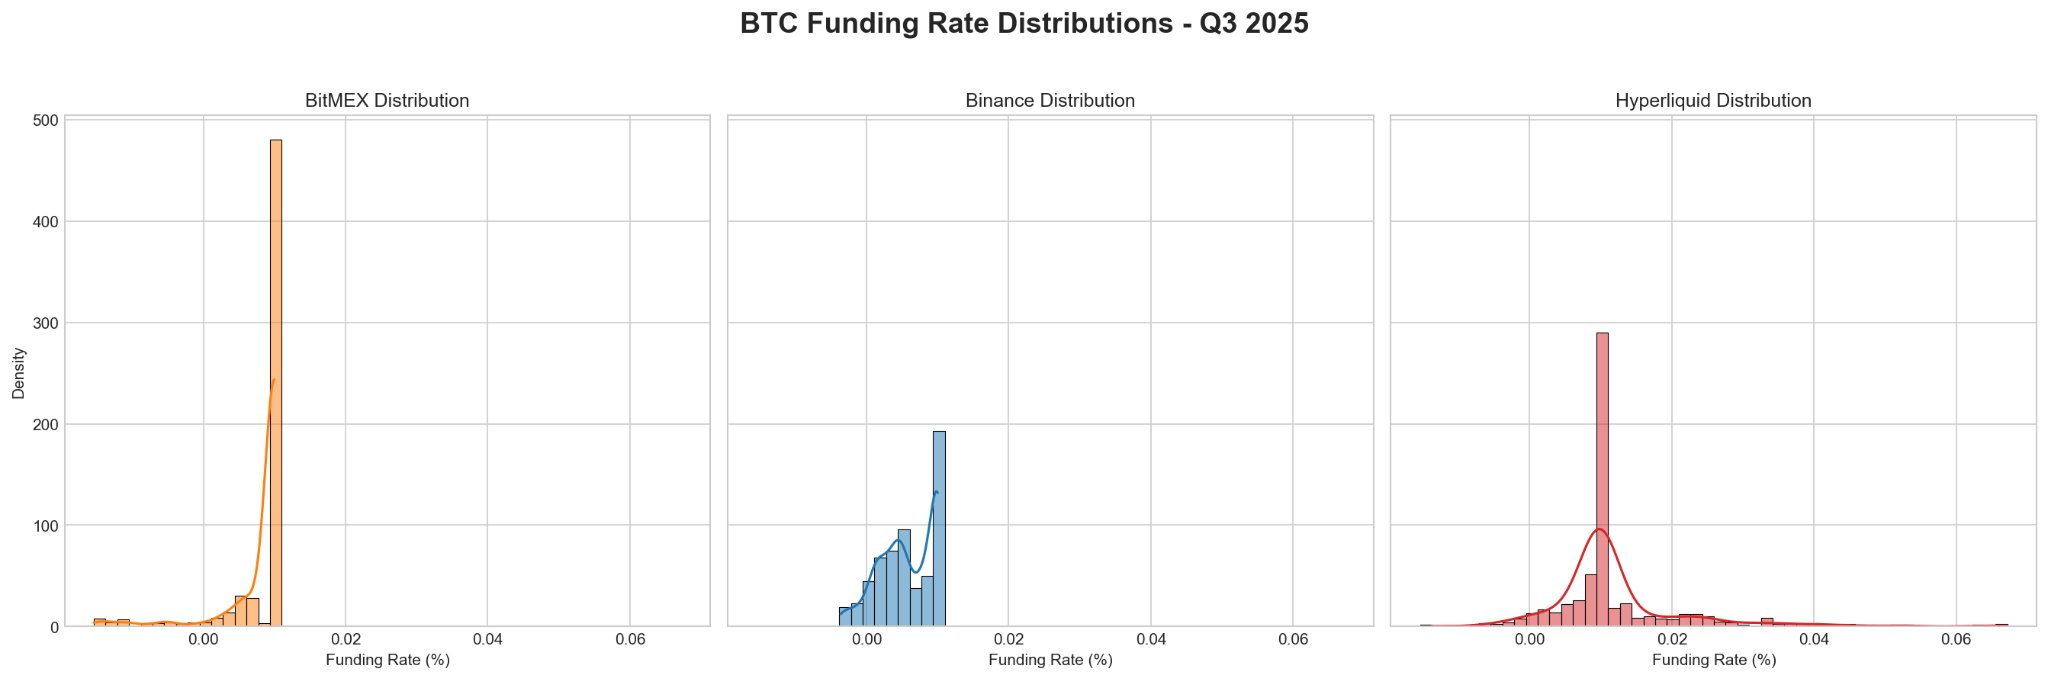
Figure 4: Distribution of BTC funding rates across exchanges in the third quarter of 2025.
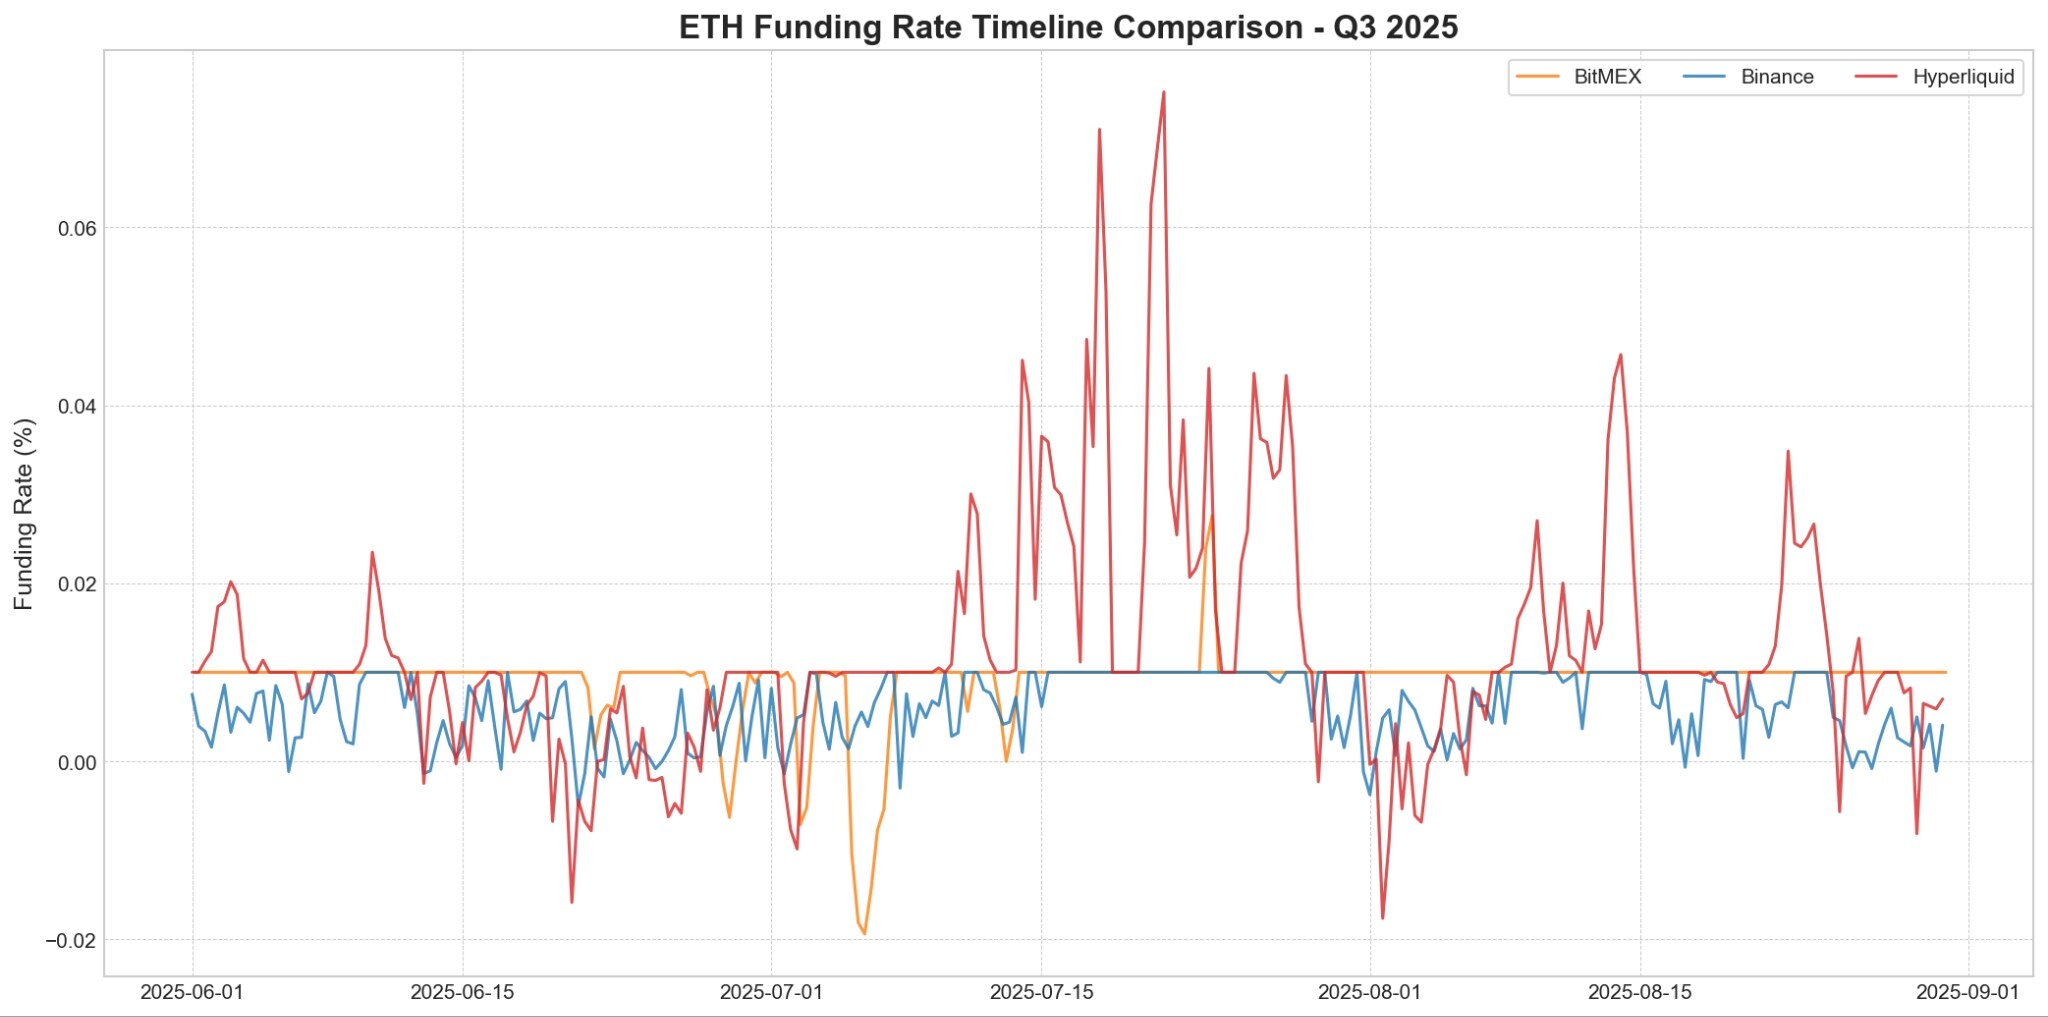
Figure 5: Comparison of ETH funding rates in Q3 2025, revealing similar behavioral patterns to BTC. High liquidity (red) is characterized by high volatility and frequent large swings, while BitMEX (orange) and Binance (blue) maintain a more stable and predictable interest rate environment.
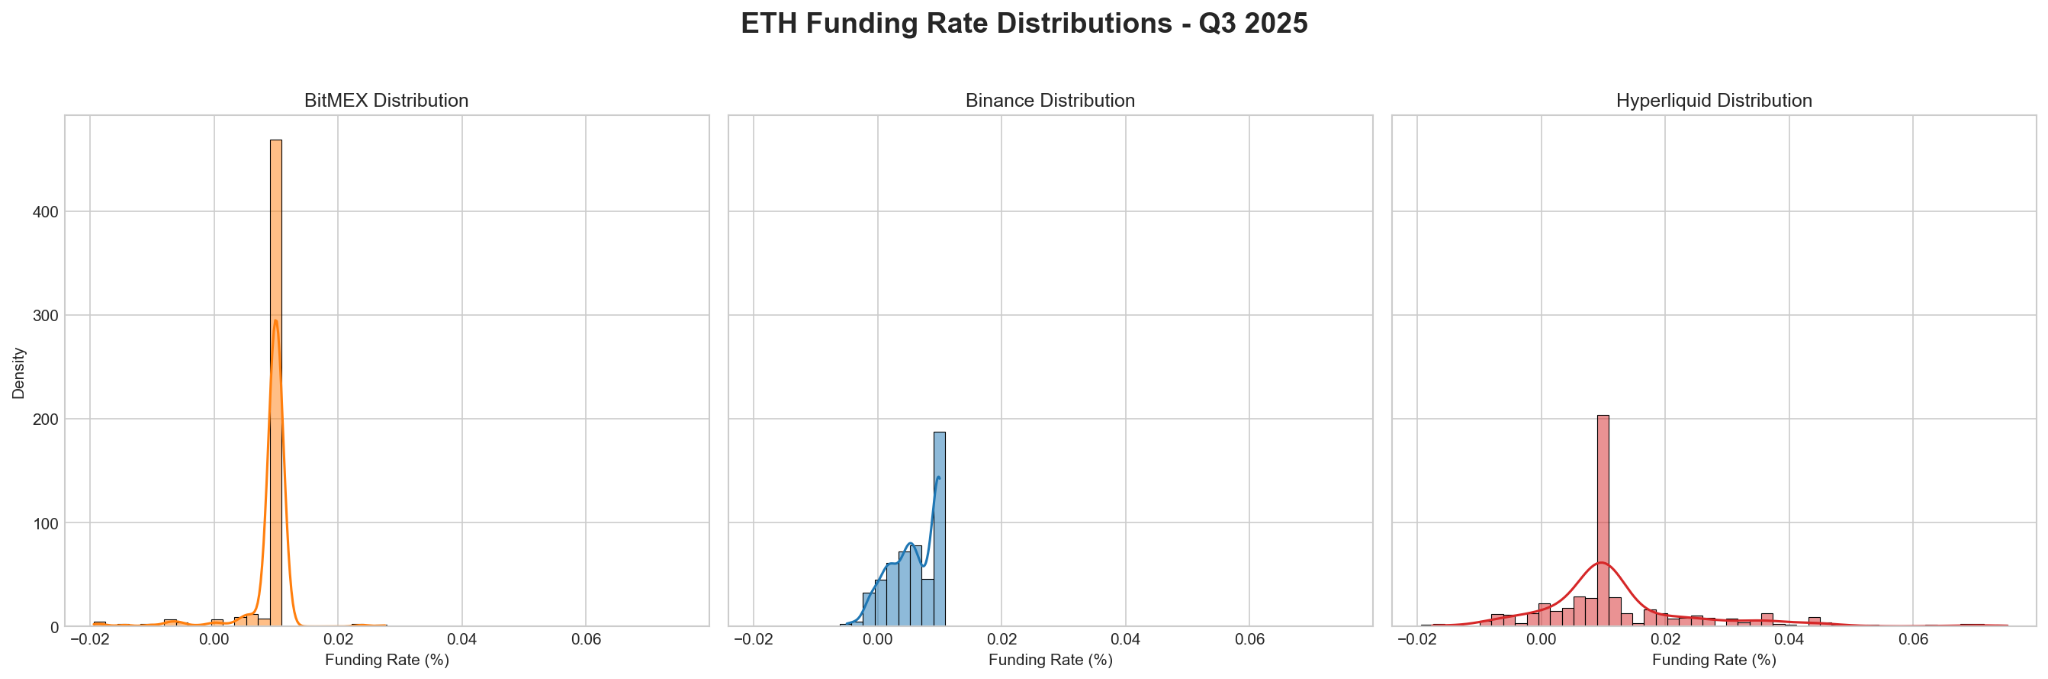
Figure 6: Distribution of Ethereum funding rates on BitMEX, Binance, and Hyperliquid in Q3 2025. This figure shows that the most common Ethereum funding rate across all three exchanges is 0.01%, with BitMEX being the most stable and Hyperliquid being the most volatile.
Funding Rate Differences Across Exchanges: Stability vs. Volatility
Bitcoin (BTC) Funding Rate Analysis on BitMEX, Hyperliquid, Binance, and Hyperliquid
$BTC Funding Rate Data (Q3 2025)
Ethereum (ETH) funding rate analysis on BitMEX, Hyperliquid, and Binance, as well as Hyperliquid
$ETH Funding Rate Data (Q3 2025)
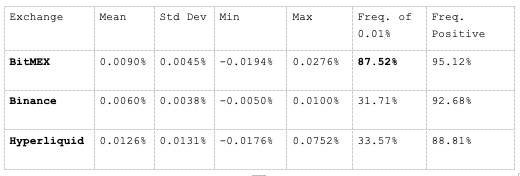
The above chart clearly shows the difference in funding rate stability between BitMEX and other exchanges like Hyperliquid and Binance.
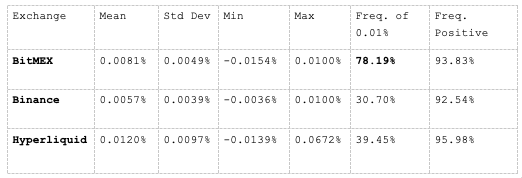
- BitMEX: As one of the oldest cryptocurrency derivatives exchanges, BitMEX serves as a benchmark. During the analysis period, BTC's funding rate was exactly 0.01% 78.19% of the time, and ETH's funding rate was exactly 0.01% 87.52% of the time. Low standard deviations indicate that its funding rates are the most predictable. This reflects the fact that premiums on BitMEX's BTC and ETH perpetual contracts remain consistent with spot prices most of the time.
- Binance: As the largest cryptocurrency exchange, Binance has the lowest average funding rates for BTC and ETH, with median rates consistently below 0.01%. This indicates sustained short selling pressure on Binance compared to BitMEX. This reflects long-term market sentiment, rather than a momentary impulse.
- Hyperliquid: Hyperliquid's funding rate volatility was the most pronounced among the three exchanges, with consistently the highest average funding rate and standard deviation. This is directly due to its one-hour funding rate calculation window and its inability to offer the same high leverage as BitMEX, which leads to an overreaction to the basis. Its highest observed BTC and ETH funding rates were 0.067% and 0.075%, respectively, significantly exceeding those of other exchanges and highlighting its tendency for funding rates to fluctuate significantly.
Bitcoin vs. Ethereum Funding Rate
While the overall trends in funding rates for both assets are similar across exchanges, the data reveals a key difference: ETH’s funding rate exhibited “higher beta” in Q3 2025.
1. Slightly higher fees: Across all exchanges, the average funding rate for ETH is slightly higher than that for BTC.
2. Significantly higher volatility: On the Hyperliquid platform, ETH's funding rate is 0.0131%, nearly 35% higher than BTC's 0.0097%. This means that ETH's funding rate is not only higher on average, but also more volatile and more prone to extreme spikes.
Key Takeaways for Traders
Understanding this market structure provides a framework for identifying high-probability trades. Instead of predicting market sentiment, traders can bet on the market executing its own rules.
1. Structural Bottom Line: Don’t Fight the Formula’s Positive Bias
A key finding is that funding rates are overwhelmingly positive—over 92% of the time, according to our data from Q3 2025. This isn't random; it's a direct result of the +0.01% interest rate component in the formula, which provides a constant tailwind. Even if you're extremely bearish, remember that a positive funding rate below 0.01% already means perpetual swaps are trading at a discount to spot prices. For rates to go negative, the market must overcome this inherent positive bias.
Therefore, if a market like Boros shows implied funding rates approaching zero, there is a structural advantage to going long rather than shorting and hoping for persistently negative rates. In this scenario, the funding rate formula is not your friend—it is actively pushing rates back into positive territory.
2. Arbitrage ceiling: Don’t expect high interest rates to persist
Just as the formula creates a soft floor, the availability of large institutional capital creates a hard ceiling. Once funding rates climb significantly above the 0.01% baseline, they offer double-digit annualized returns that are irresistible to arbitrageurs.
Billions of dollars in capital from institutions and DeFi protocols are continuously eyeing these opportunities. When premiums emerge, they simultaneously short perpetual swaps and buy spot assets, a trade that quickly compresses premiums and forces funding rates back down. This means that while interest rates may spike, these spikes are inherently volatile and short-lived. Betting on persistently high interest rates is a bet on a large, efficient, and well-capitalized segment of the market.
in conclusion
Funding rate trading is an emerging trend in the cryptocurrency industry, and at BitMEX, we're excited to witness the next evolution of crypto derivatives. Our analysis shows that success in the funding rate market stems less from predicting chaotic market sentiment and more from understanding the underlying structure of the market.
Two core factors—the allure of the 0.01% funding rate formula and the vast pool of arbitrage capital executing it—create a highly predictable market environment. By understanding why interest rates are pegged and why negative rates are an anomaly, traders can move beyond price speculation and capitalize on the high-probability opportunities inherent in the market structure pioneered by BitMEX nine years ago.
- 核心观点:资金费率由公式锚定与套利资本共同驱动。
- 关键要素:
- 公式内置0.01%利率锚定机制。
- 套利资本迅速压缩高费率溢价。
- BitMEX费率稳定性显著高于Hyperliquid。
- 市场影响:增强费率可预测性,抑制异常波动。
- 时效性标注:中期影响