Original article by: CryptoVizArt, Chris Beamish, and Antoine Colpaert
Original translation: AididiaoJP, Foresight News
In the post-FOMC rally, Bitcoin traded above $115,200, with 95% of supply in profit. Futures markets signaled a short squeeze, with open interest in options reaching a record 500,000 BTC ahead of the September 26 expiration date. Sustainability above $115,200 is key; a break below could trigger a drop towards $105,500.
summary
- Bitcoin saw modest upward momentum ahead of the Federal Open Market Committee meeting on September 17th. Derivatives markets have shifted from a risk-off stance to a more balanced positioning, as downside concerns following the FOMC meeting have eased. Spot markets showed mild selling pressure, while perpetual swaps harvested liquidity through a short squeeze.
- After peaking at 395,000 BTC, perpetual contract open interest retreated to approximately 380,000 BTC as volatility liquidated leveraged traders. The liquidation pattern confirms a short squeeze prior to the FOMC meeting, followed by long liquidations in the pullback following the decision.
- Options open interest has reached a record high of 500,000 Bitcoin, and the September 26 expiration date is expected to be the largest delivery in history. The flow of funds from expiration around the maximum pain point level of $110,000 may have a strong impact on the spot price.
- Volatility repricing ahead of the FOMC meeting pushed up the spread between 1-month implied volatility (IV) and realized volatility (RV), while market maker positioning meant that hedge flows could sustain gains and cushion losses.
- On the chain, Bitcoin is trading above the cost basis of 95% of supply ($115,200). Holding this level is crucial to sustaining the upward momentum, while a break below it could lead to a drop towards $105,500.
Bitcoin markets have shown modest upward momentum since early September, fueled by anticipation of an FOMC rate cut and optimism about its potential impact.
This article examines market dynamics in the days leading up to the meeting, as well as the structure of perpetual and options markets following the rate decision. Finally, we turn to on-chain indicators to assess the broader macro cycle and determine whether the foundations for a continued trend are forming.
Perpetual Market Analysis
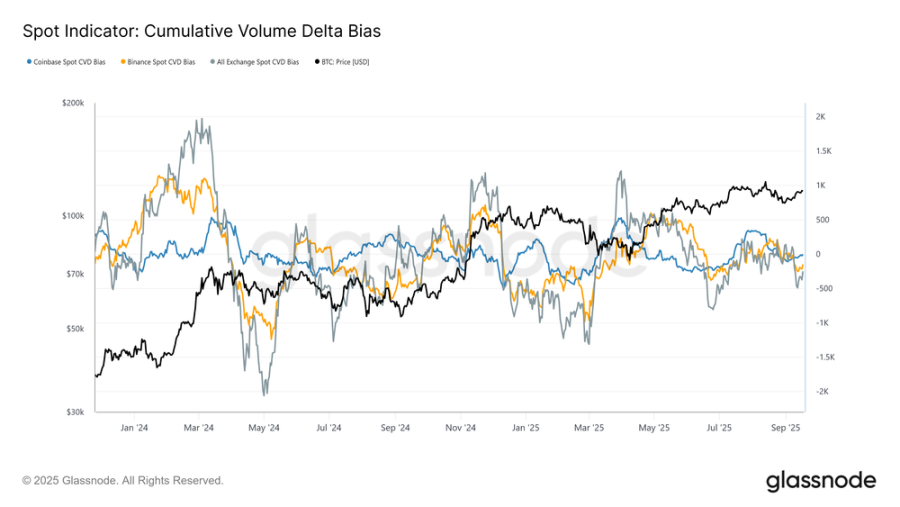
Throughout September, Bitcoin stabilized around $107,800, consistent with the cost basis of short-term holders. From this level, the market structure shifted from equilibrium to slightly seller-driven. This bias is captured by the deviation of the cumulative volume differential (CVD) from its 90-day median baseline.
In the days leading up to the FOMC meeting, CVD on Coinbase, Binance, and all major exchanges showed mild negative deviations, highlighting net selling pressure in the spot market and cautious attitude among participants.
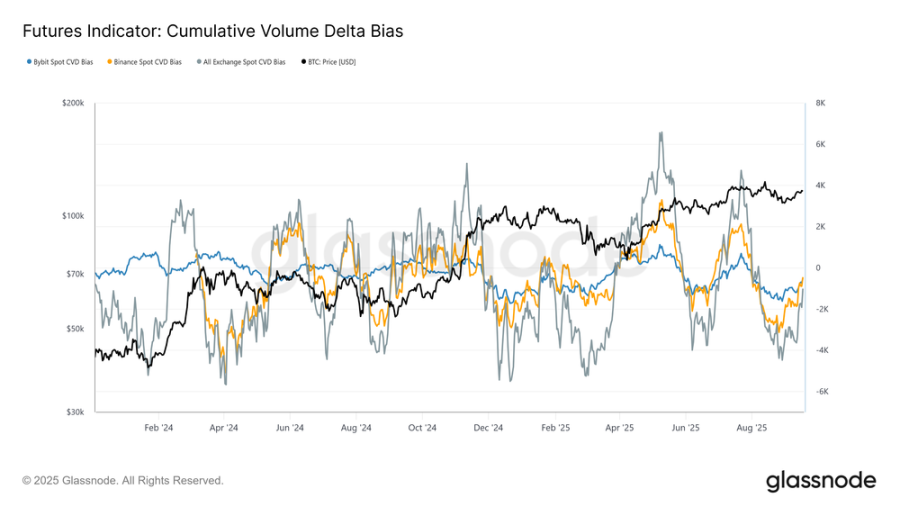
If we extend the same perspective to perpetual markets, the cumulative volume difference (CVD) bias shows a significant shift from extreme selling to a near-balanced state. This reflects a significant return of liquidity, as buy-side flows offset persistent selling pressure from late August through the FOMC meeting.
The stabilization highlights the central role of futures markets in supporting the rebound, with speculators positioning themselves ahead of rate cuts and anticipating a positive policy outcome.
Perpetual Contract Open Interest
Given the outsized role of futures in current market dynamics, perpetual swap indicators offer a clearer perspective on short-term sentiment.
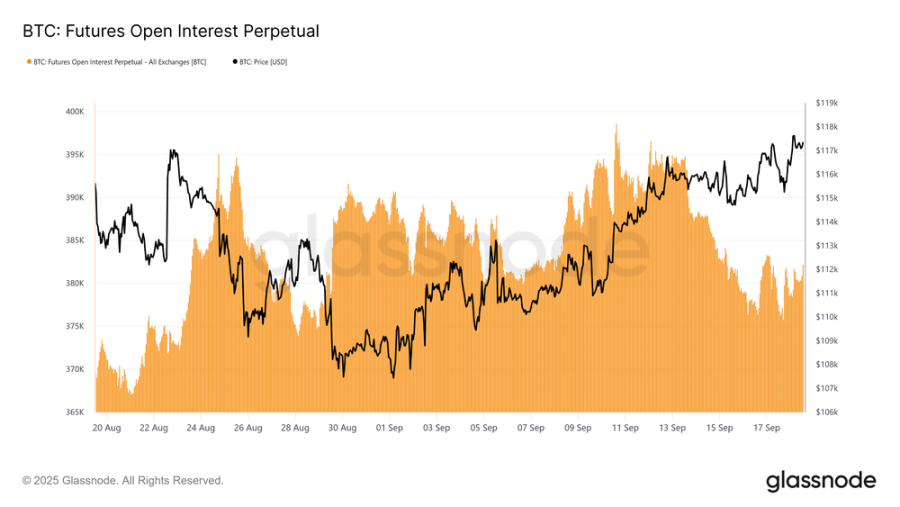
Perpetual contract open interest (OI) climbed to a cycle high of approximately 395,000 BTC on September 13, reflecting aggressive positioning. However, by Monday, September 16, volatile price action pushed OI down to 378,000 BTC, a drop of approximately 4.3%.
Since the FOMC meeting, OI has stabilized between 378,000 and 384,000 BTC, a pattern consistent with elevated intraday volatility and leveraged traders being liquidated around key macro events. This highlights the futures market’s heightened sensitivity to policy-driven catalysts.
Short Squeeze and Long Liquidation
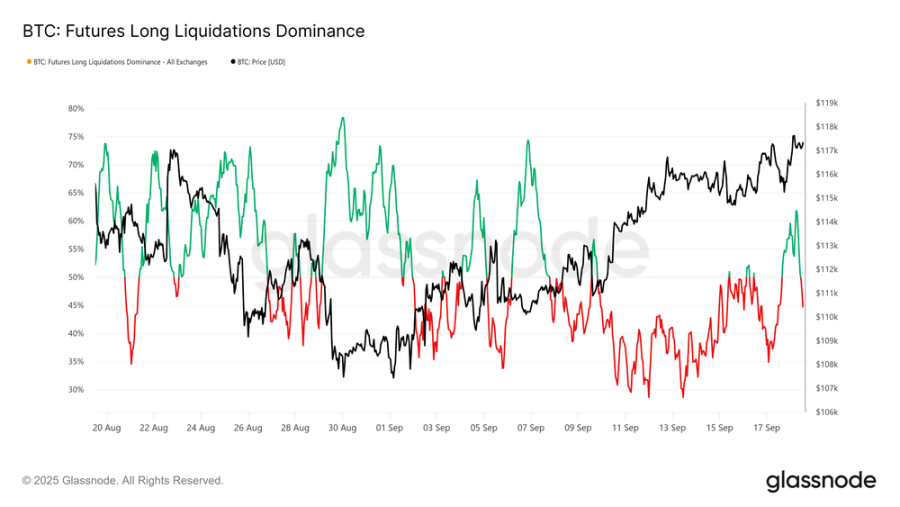
Looking at the liquidation dominance over the past 30 days shows that the decline in open interest between September 13 and 17 was primarily driven by short liquidations. This translated into a series of short squeezes ahead of the FOMC announcement, boosting momentum for perpetual contract longs.
However, this state was abruptly interrupted when the price sharply corrected to $115,000 after the rate cut, which triggered a wave of highly leveraged long liquidations and pushed the long liquidation lead ratio to 62%.
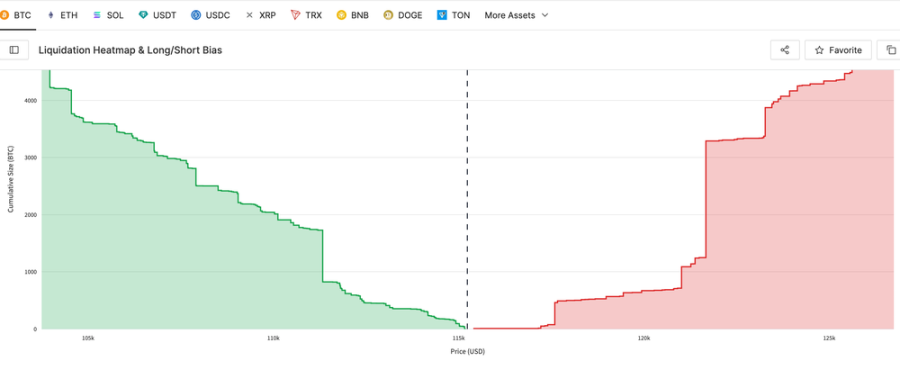
We can simultaneously highlight recent long liquidations and short-term maximum pain points. The indicators in this dashboard serve as proxies for liquidation prices, pinpointing the levels at which traders face forced liquidation risk and helping to predict potential cascading liquidations. These indicators, constructed based on the 1,000 largest Bitcoin positions on Hyperliquid, provide highly correlated proxies for broader market positions.
Biggest pain point
We begin with the Liquidation Wall to measure the most immediate maximum pain point levels for long and short positions. The latest hourly snapshot highlights potential Liquidation Walls: prices below the spot price indicate long liquidations, and prices above the spot price indicate short liquidations.
The current maximum pain point for bulls is at $112,700, while for bears it is at $121,600, with the spot price trading at $117,200. This suggests the market is in a fragile equilibrium, with a downside move potentially triggering long liquidations, while an upside breakout could trigger a short squeeze and send prices towards recent highs.
options market
Turning our focus to options markets, we use position placement and expiration dates to assess near-term volatility expectations.
Rising Option OI and Expiration Dynamics
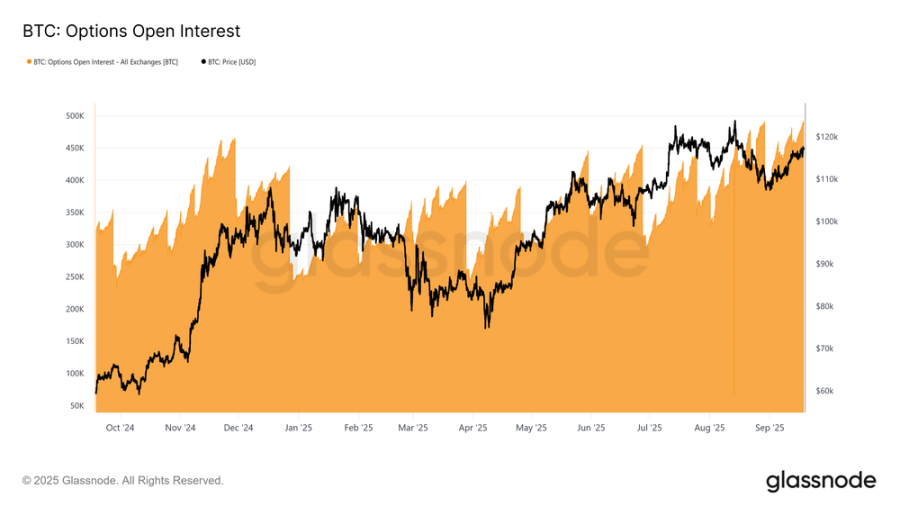
Open interest (OI) for Bitcoin options has surged to nearly 500,000 BTC, a record high, highlighting the growing adoption of options for hedging and speculation. OI typically declines at month-end, with a more dramatic drop at quarter-end, before reaccumulating. This pattern reflects the dominance of monthly expiration dates, with weekly options listed only two-three weeks in advance. Quarterly expiration dates, often referred to as "triple witching," combine weekly, monthly, and quarterly expiration dates, concentrating fund flows and liquidity.
While a rising OI doesn't reveal a directional bias, it suggests a more mature market, deploying sophisticated structures to manage risk. Importantly, as OI peaks near expiration, gamma effects can amplify spot volatility as market makers hedge more actively, making expiration increasingly influential on Bitcoin's price movements.
Record-breaking setting
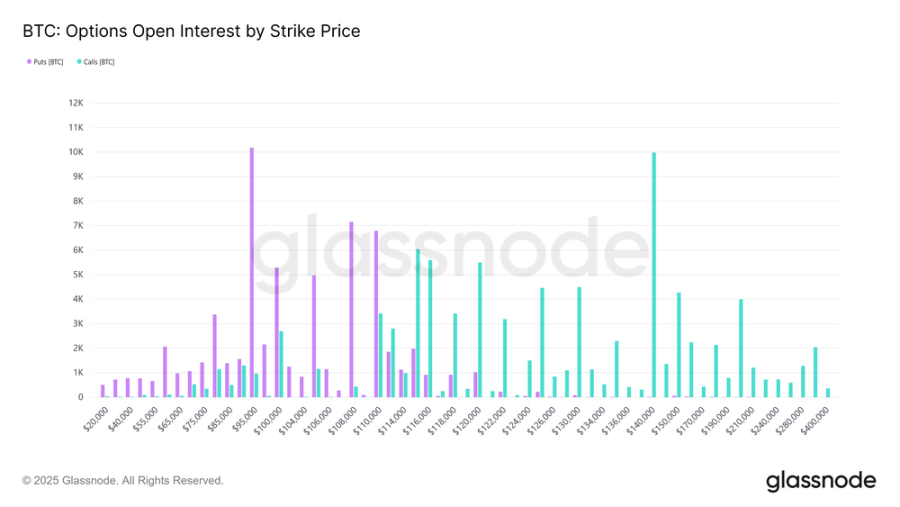
The September 26 expiration date is a key event in the options market based on rising open interest.
This expiration marks the largest in Bitcoin's history, reflecting nine months of accumulation since its listing. The strike price distribution is unusually wide, with open interest concentrated at $95,000 puts on the downside and $140,000 calls on the upside. While these levels are likely to expire out-of-the-money, they highlight where traders have been speculating or hedging throughout the year.
The biggest pain point is around $110,000, the price at which most options become worthless and which typically exerts a gravitational pull prior to expiration. Given the sheer size of the contract, hedge flows could significantly impact the spot price until the rollover at 8:00 AM UTC on Friday, September 26th. Once expiration arrives, the market could unleash even more volatility.
FOMC repricing
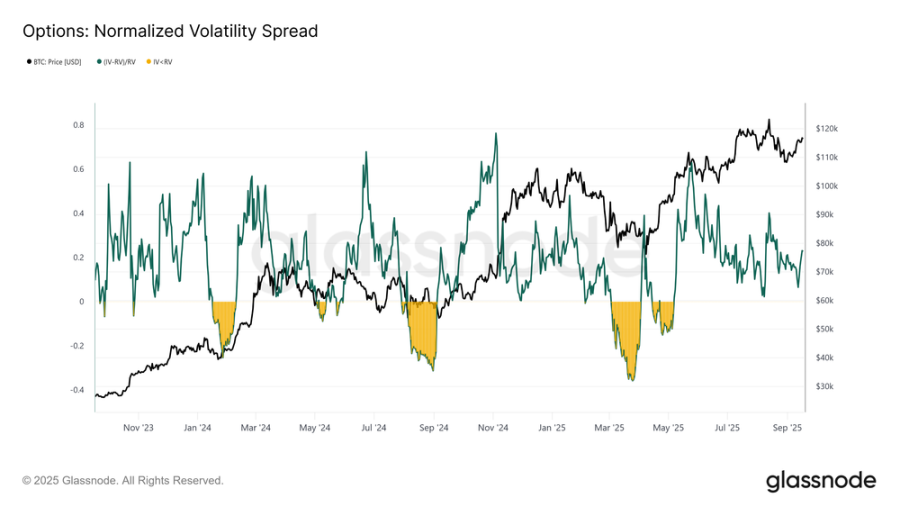
Turning to volatility, the normalized 1-month spread shows how options traders are positioning around the FOMC meeting.
Implied volatility (IV) tracked closely with realized volatility (RV) throughout most of September, but spiked ahead of the meeting as market makers repriced risk and traders rushed to buy call options. The spread is now 0.228, still within normal range but slightly elevated. This reflects the additional premium demanded by sellers to absorb risk, providing income opportunities in an otherwise subdued volatility environment.
Pay attention to market maker capital flow
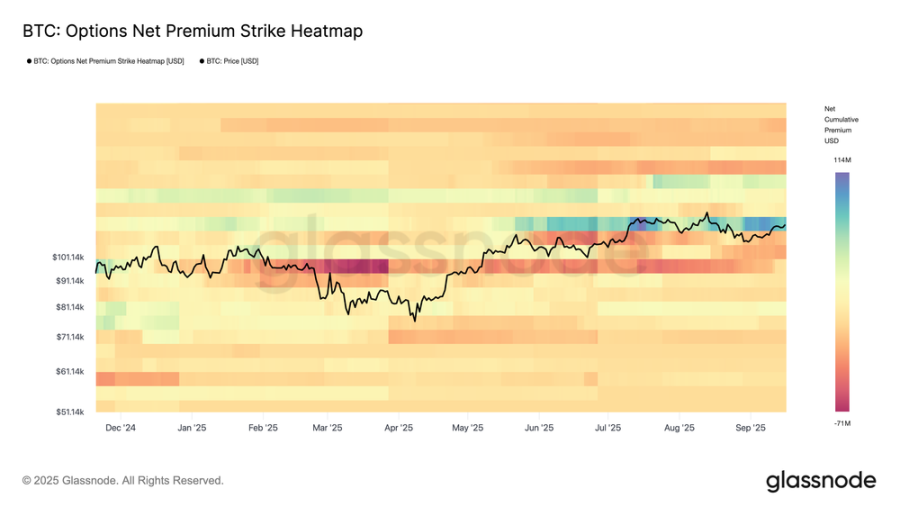
Complementing volatility spreads, option net premium strike price heat maps reveal how traders structure their positions across different strike prices.
Recent months have shown consistent selling of put options below the spot price and buying of call options above it, with upside demand intensifying in recent days. This structure positions market makers short on the upside and long on the downside, forcing them to buy hedges on both the upside and the downside. The resulting flow provides momentum for extended upside moves while cushioning downside and reinforcing stability around key strike price areas.
Using on-chain data for macro navigation
After reviewing perpetual and options metrics, we now turn to on-chain metrics to assess the market from a macro and investor behavior perspective.
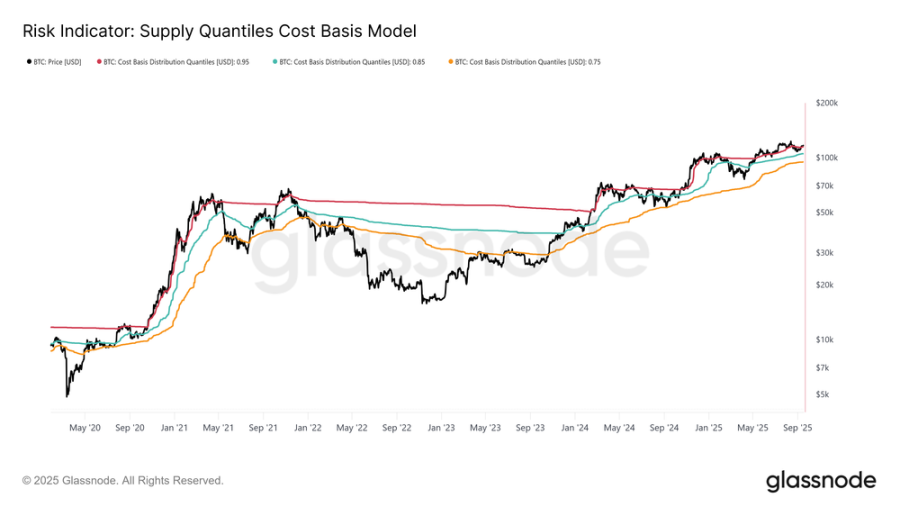
Following the FOMC meeting, Bitcoin rallied to $117,200, pushing the majority of supply back into profitability. The supply quantile cost basis model indicates that the current price is now above the cost basis for the 95th percentile of supply ($115,200). Sustaining above this level is crucial to maintaining demand-side momentum. Conversely, failure to hold above this level increases the likelihood of a price contraction back to the 85th-95th percentile range between $105,500 and $115,200, where waning conviction and renewed selling pressure could occur.
in conclusion
Following the FOMC-driven rally, the Bitcoin market remains delicately balanced. In the futures market, net selling pressure on spot contracts was offset by new liquidity in perpetual swaps, with short squeezes and liquidations playing a key role.
Options markets highlighted record open interest and historic quarterly expiries, pointing to the potential for heightened volatility, with market maker flows providing both support on dips and momentum on rallies.
On-chain, Bitcoin is trading above the cost basis of 95% of supply, a critical dividing line. Sustainability above $115,200 would maintain demand-driven momentum, while a break could trigger a decline towards the $105,500-$115,200 range. Taken together, these signals suggest the market is awaiting confirmation. Stabilization above the key cost basis level could extend upside, while fragility in fund flows keeps downside risks present.
- 核心观点:比特币市场处于关键成本基础之上的微妙平衡。
- 关键要素:
- 95%供应盈利,成本基础11.52万美元。
- 期权未平仓合约达50万枚历史新高。
- 期货市场轧空与清算交替主导。
- 市场影响:关键价位得失决定短期方向选择。
- 时效性标注:短期影响。