
30-year interest rate cut cycle reveals patterns: Where will Bitcoin, US stocks, and gold go?
- 核心观点:美联储降息周期将影响资产表现。
- 关键要素:
- 历史降息模式决定资产走势。
- 比特币涨幅依赖流动性规模。
- 黄金稳定上涨,股市分化明显。
- 市场影响:流动性增加或推升风险资产。
- 时效性标注:中期影响。
Original title: "Reviewing the Fed's interest rate cut cycle, where will Bitcoin, the stock market, and gold go? "
Written by David, TechFlow
"Take a break first and wait for the Federal Reserve's decision before taking any action." In recent days, there has been a wait-and-see mood in the investment community.
The Federal Reserve will announce its latest interest rate decision at 2:00 AM Beijing time on September 18th. This will be the fifth meeting since the rate cut in September of last year. The market expects another 25 basis point cut, from the current 4.5% to 4.25%.
This time a year ago, everyone was waiting for the rate cut cycle to begin. Now, we are halfway there.
Why are people waiting for this decision to be made? Because history tells us that when the Federal Reserve begins to cut interest rates, various assets tend to take off.
So with this rate cut, where will Bitcoin go? And how will the stock market and gold perform?
Looking back at the Federal Reserve’s interest rate cut cycles over the past 30 years, perhaps we can find the answer from historical data.
Which rate-cutting cycle are we at the beginning of?
Historically, cutting interest rates has never been an easy move for the Federal Reserve.
Sometimes, interest rate cuts are a shot in the arm for the economy, and the market surges in response; but sometimes, interest rate cuts are the prelude to a storm, meaning a bigger crisis is about to come, and asset prices may not necessarily rise in response.
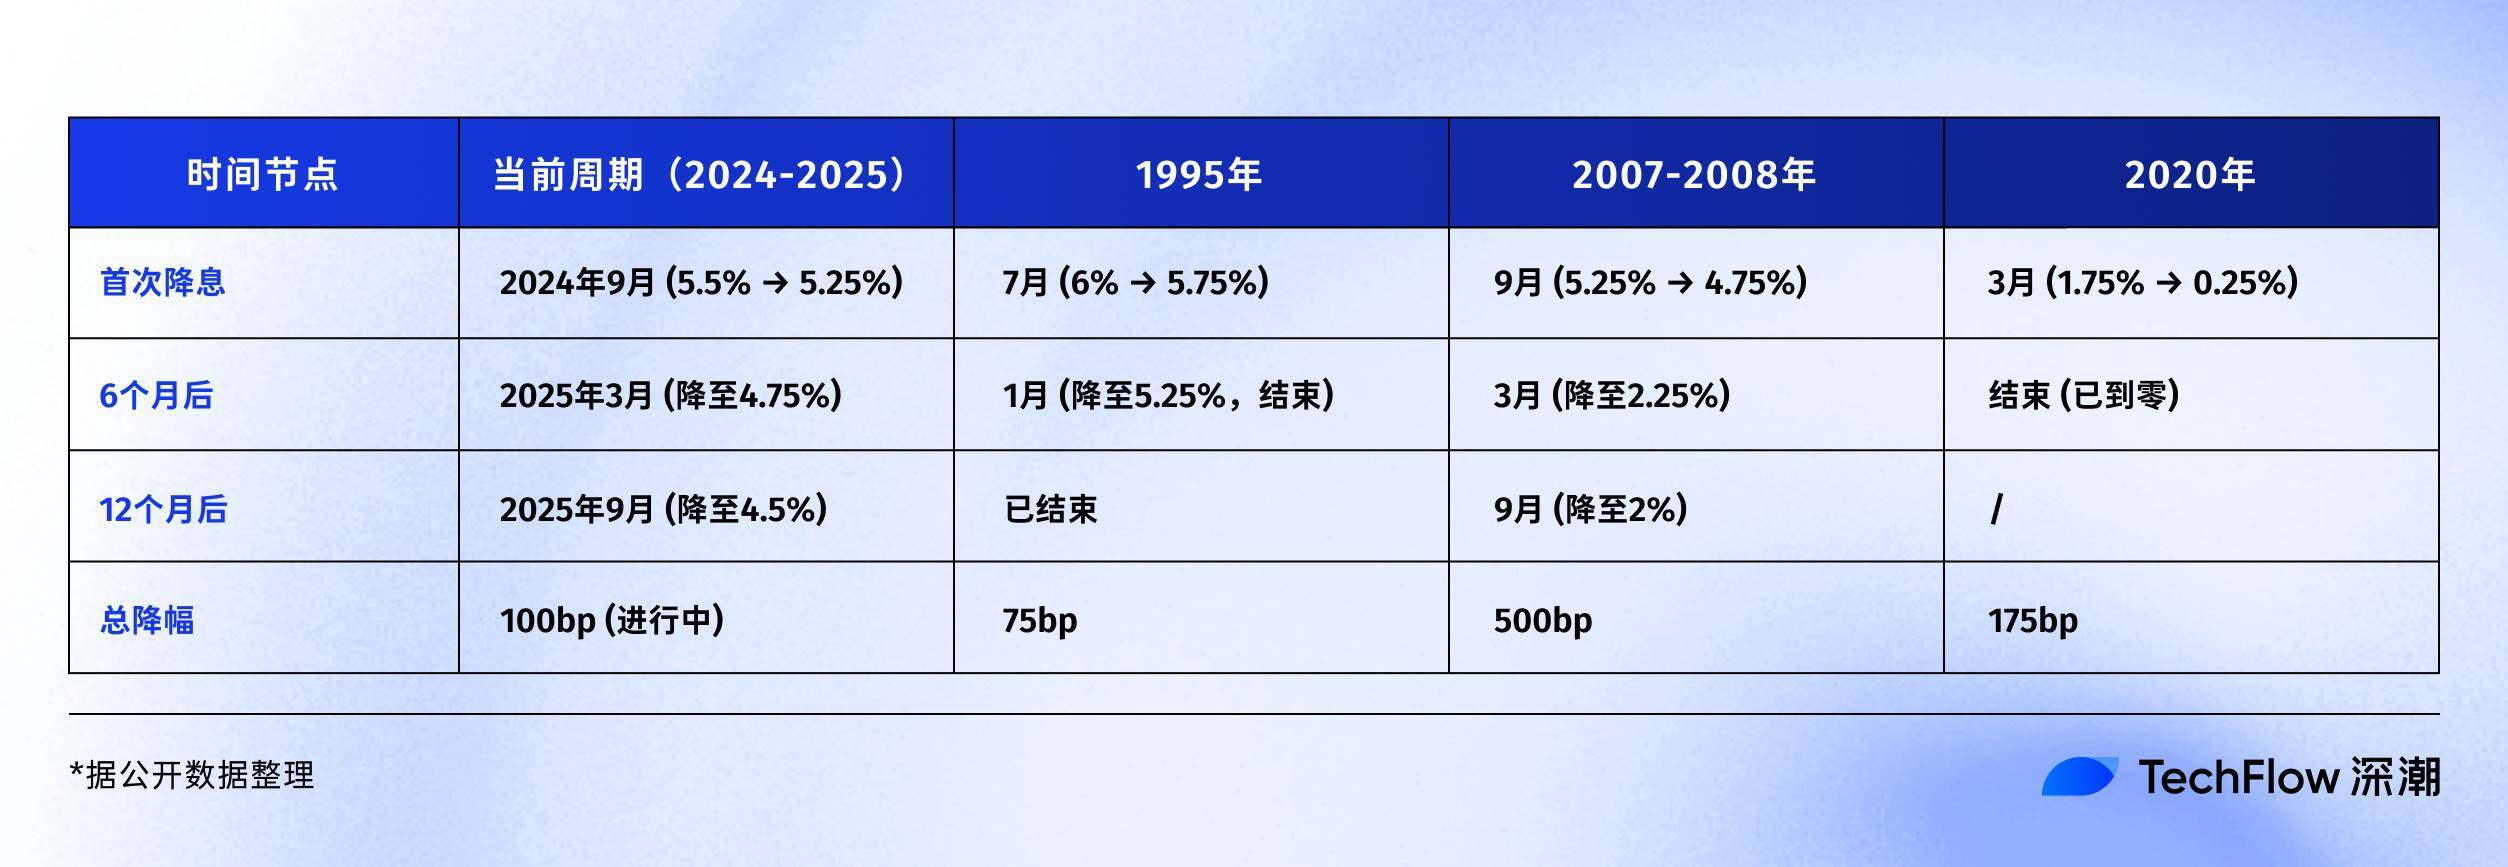
In 1995, a precautionary interest rate cut was implemented.
Then-Federal Reserve Chairman Alan Greenspan faced a "happy dilemma": economic growth was solid, but there were signs of overheating. So he opted for a "preventive interest rate cut," from 6% to 5.25%, a total reduction of only 75 basis points.
The result? The US stock market launched the most glorious five-year bull market of the internet era, with the Nasdaq index increasing fivefold over the next five years. It was a textbook soft landing.
In 2007, a bailout-style interest rate cut was implemented.
As depicted in the movie “The Big Short,” the subprime mortgage crisis was already emerging, but few people realized the scale of the storm. In September of that year, when the Federal Reserve began to cut interest rates from 5.25%, the market was still celebrating and the S&P 500 index had just hit a record high.
But everyone knows what happened next: Lehman Brothers collapsed, a global financial tsunami occurred, and the Federal Reserve was forced to cut interest rates from 5.25% to 0.25% within 15 months, a drop of 500 basis points. This rescue, which came too late, still failed to prevent the economy from falling into the worst recession since the Great Depression.
In 2020, there was a panic rate cut .
The unforeseen "black swan" COVID-19 pandemic struck. The Federal Reserve implemented two emergency interest rate cuts on March 3 and 15, dropping it from 1.75% to 0.25% in just 10 days. Simultaneously, it initiated "unlimited quantitative easing," expanding its balance sheet from $4 trillion to $9 trillion.
This unprecedented level of money injection has created one of the most bizarre moments in financial history: the real economy has ground to a halt, while financial assets are experiencing a resurgence. Bitcoin has soared from $3,800 in March 2020 to $69,000 in November 2021, a more than 17-fold increase.
Looking back at these three interest rate cut patterns, you can also see three asset changes with similar results but different processes:
- Preventive interest rate cuts : A small interest rate cut leads to a soft landing of the economy and a steady rise in assets
- Relief-style interest rate cuts : Sharp interest rate cuts, a hard landing for the economy, and asset prices falling before rising
- Panic rate cuts : Emergency rate cuts, extreme volatility, and V-shaped asset reversals
So in 2025, which script are we standing at the beginning of?
Judging from the data, the current situation is more like the precautionary rate cut in 1995. The unemployment rate is 4.1%, which is not high; GDP is still growing and there is no recession; inflation has fallen from the peak of 9% in 2022 to around 3%.
But there are a few disturbing details worth noting:
First, the stock market was already at a historic high when the rate cut took place, with the S&P 500 having risen by more than 20% this year.
Historically, the stock market had just recovered from its lows when interest rates were cut in 1995; and the stock market was at a high when interest rates were cut in 2007, but then collapsed. Secondly, the US government debt-to-GDP ratio has reached 123%, far exceeding the 64% in 2007, which also limits the government's room for fiscal stimulus.
But no matter which rate cut mode is adopted, one thing is certain: the floodgates of liquidity are about to open.
The Crypto Market’s Interest Rate Cut Playbook
This time, when the Fed opens the tap again, what will happen to the crypto market?
To answer this question, we need to first understand what the crypto market experienced during the last round of interest rate cuts.
From 2019 to 2020, when a market with a market value of only US$200 billion suddenly ushered in trillions of liquidity, the entire asset rise process did not happen overnight.
The 2019 interest rate cut cycle: more noise than action
On July 31 of that year, the Federal Reserve cut interest rates for the first time in a decade. This should have been a major positive for the crypto market at the time.
Interestingly, Bitcoin seemed to have gotten the message early. At the end of June, Bitcoin began to rise from $9,000, reaching $13,000 by mid-July. The market was betting that the interest rate cut would usher in a new bull market.
But after the rate cut actually took place, the market trend was surprising. On July 31st, the day of the rate cut, Bitcoin fluctuated around $12,000, then fell instead of rising. In August, it fell below $10,000, and by December it had fallen back to around $7,000.
Why did this happen? Looking back, there may be several reasons.
First, the 75 basis point rate cut was relatively mild, and the release of liquidity was limited. Second, the crypto market had just emerged from the 2018 bear market, and investor confidence was low.
Most importantly, traditional institutions are still waiting and watching. The funds from this round of interest rate cuts mainly flowed into the stock market, and the S&P 500 rose by nearly 10% during the same period.
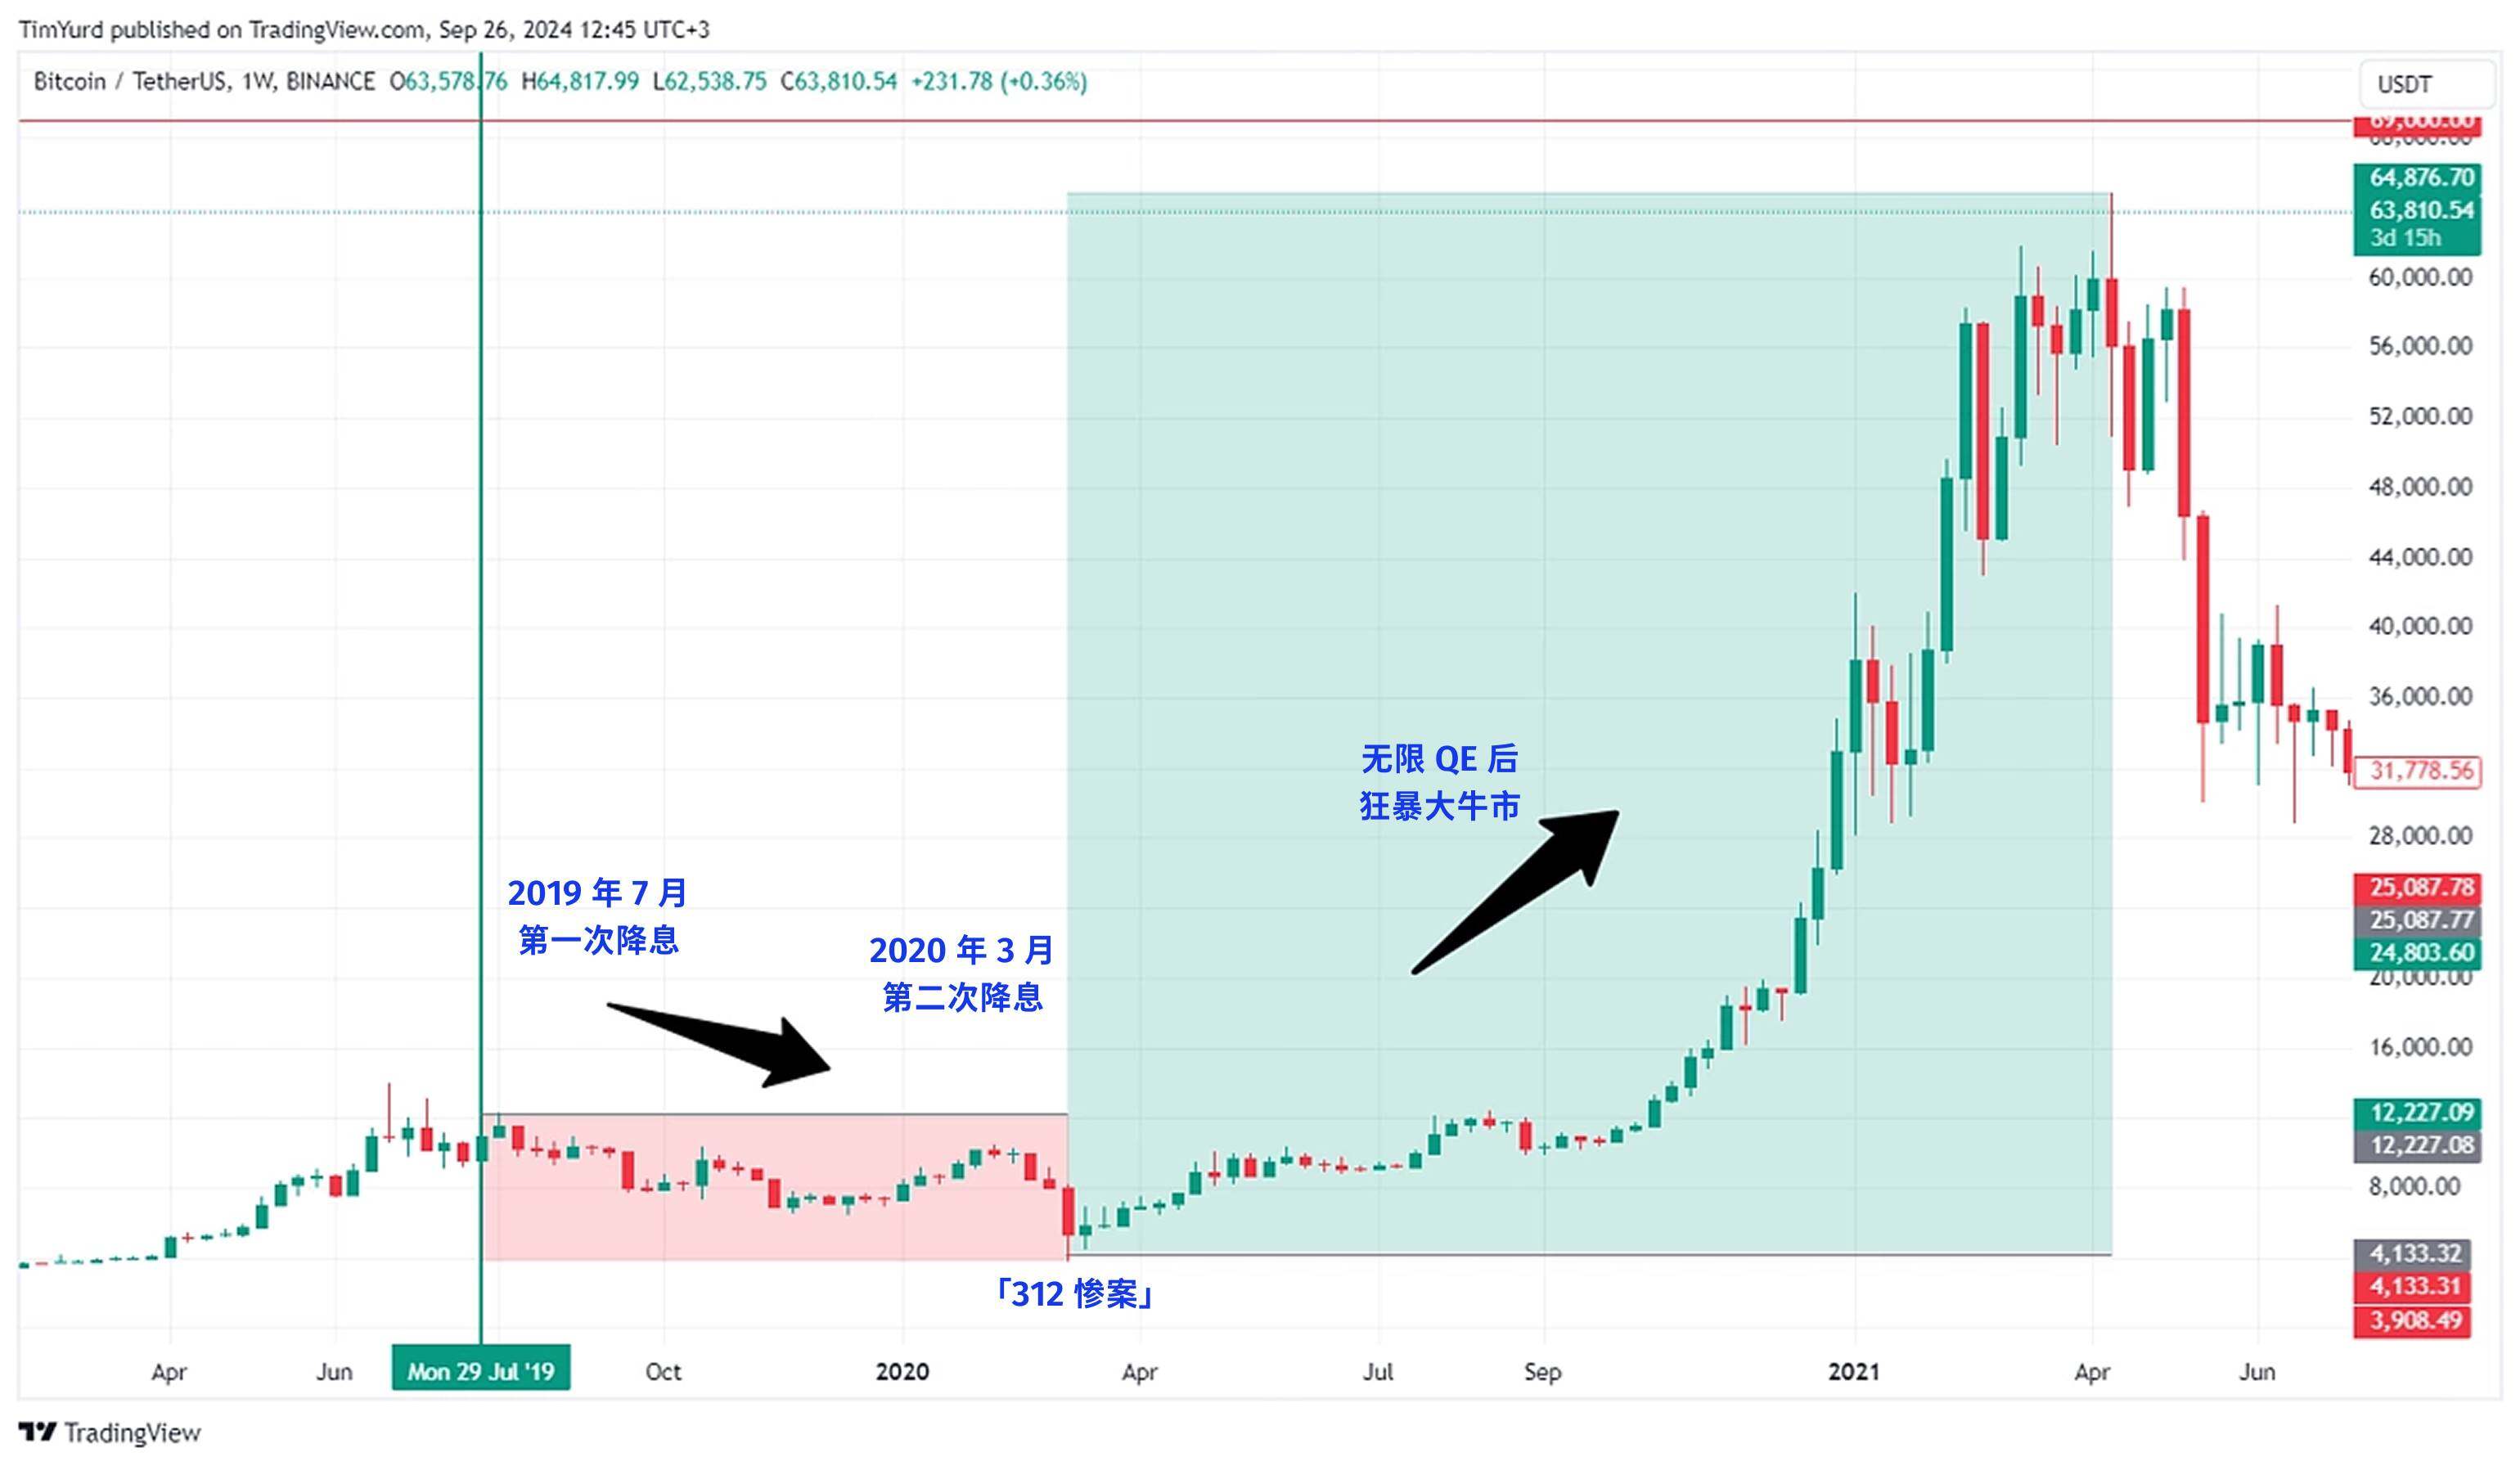
The 2020 interest rate cut cycle: a roller coaster ride after the 312 tragedy
By the first week of March, the market was already sensing a crisis. On March 3rd, the Federal Reserve implemented an emergency 50 basis point interest rate cut. Bitcoin not only failed to rise, but actually plummeted from $8,800 to $8,400. The market logic was: emergency rate cut = major economic problems = run away first.
The following week marked the crypto market's darkest hour. On March 12th, Bitcoin plummeted from $8,000 to $3,800, a drop of over 50% in 24 hours. Ethereum suffered even worse, falling from $240 to $90.
The classic "312" tragedy has become a collective traumatic memory in the crypto market.
The plunge that day was part of a global liquidity crisis. Panic over the pandemic triggered a sell-off of all assets—stock market circuit breakers, gold prices, and even US Treasury bonds—as investors frantically sold everything for cash, even Bitcoin, the "digital gold," was not immune.
Even more devastatingly, the high leverage in the crypto market amplified the decline. On derivatives exchanges like BitMEX, numerous long positions with 100x leverage were liquidated, with a chain reaction of liquidations like an avalanche. Within a few hours, the total amount liquidated across the network exceeded $3 billion.
But just when everyone thought things were going back to zero, a turning point came.
On March 15, the Federal Reserve announced an interest rate cut to 0-0.25% and launched $700 billion in quantitative easing (QE). On March 23, the Fed even launched the "unlimited QE" strategy. After bottoming out at $3,800, Bitcoin began an epic rebound:
- March 13, 2020: $3,800 (low)
- May 2020: $10,000 (up 160% in 2 months)
- October 2020: $13,000 (up 240% in 7 months)
- December 2020: $29,000 (up 660% in 9 months)
- April 2021: $64,000 (up 1580% in 13 months)
- November 2021: $69,000 (up 1,715% in 20 months)
It's not just Bitcoin; the entire crypto market is celebrating. Ethereum's price has soared 53-fold, from $90 to $4,800. Many DeFi tokens have seen their value increase by hundreds of times. The total crypto market capitalization has swelled from $150 billion in March 2020 to $3 trillion in November 2021.
Comparing 2019 and 2020, why did the market react so differently to both interest rate cuts?
Looking back, the answer is very simple: the extent of the interest rate cut determines the scale of funds.
In 2020, it was directly reduced to zero, and unlimited QE was added, which was equivalent to opening the floodgates. The Federal Reserve's balance sheet expanded from $4 trillion to $9 trillion, and the market suddenly had an additional $5 trillion in liquidity.
Even if only 1% flows into the crypto market, it would be $50 billion, which is equivalent to one-third of the total market capitalization of the entire crypto market at the beginning of 2020.
Furthermore, in 2020, players experienced a mindset shift from extreme panic to extreme greed. In March, everyone was selling everything for cash, and by the end of the year, everyone was borrowing money to buy assets. This dramatic swing in sentiment amplified price fluctuations.
More importantly, institutions have also entered the market.
MicroStrategy began buying Bitcoin in August 2020, acquiring over 100,000 coins cumulatively. Tesla announced a $1.5 billion Bitcoin purchase in February 2021. Grayscale Bitcoin Trust (GBTC) holdings grew from 200,000 coins at the beginning of 2020 to 650,000 by the end of the year.
The purchases by these institutions not only brought in real money, but more importantly, brought an endorsement effect.
2025, history repeats itself?
In terms of the magnitude of the interest rate cut, the market expected a 25 basis point cut on September 17th, which was just the beginning . If current economic data is extrapolated, the entire rate-cutting cycle (over the next 12-18 months) could result in a cumulative cut of 100-150 basis points, ultimately bringing the interest rate to around 3.0-3.5%. This range falls between the 75 basis point cuts in 2019 and the zero rate in 2020.
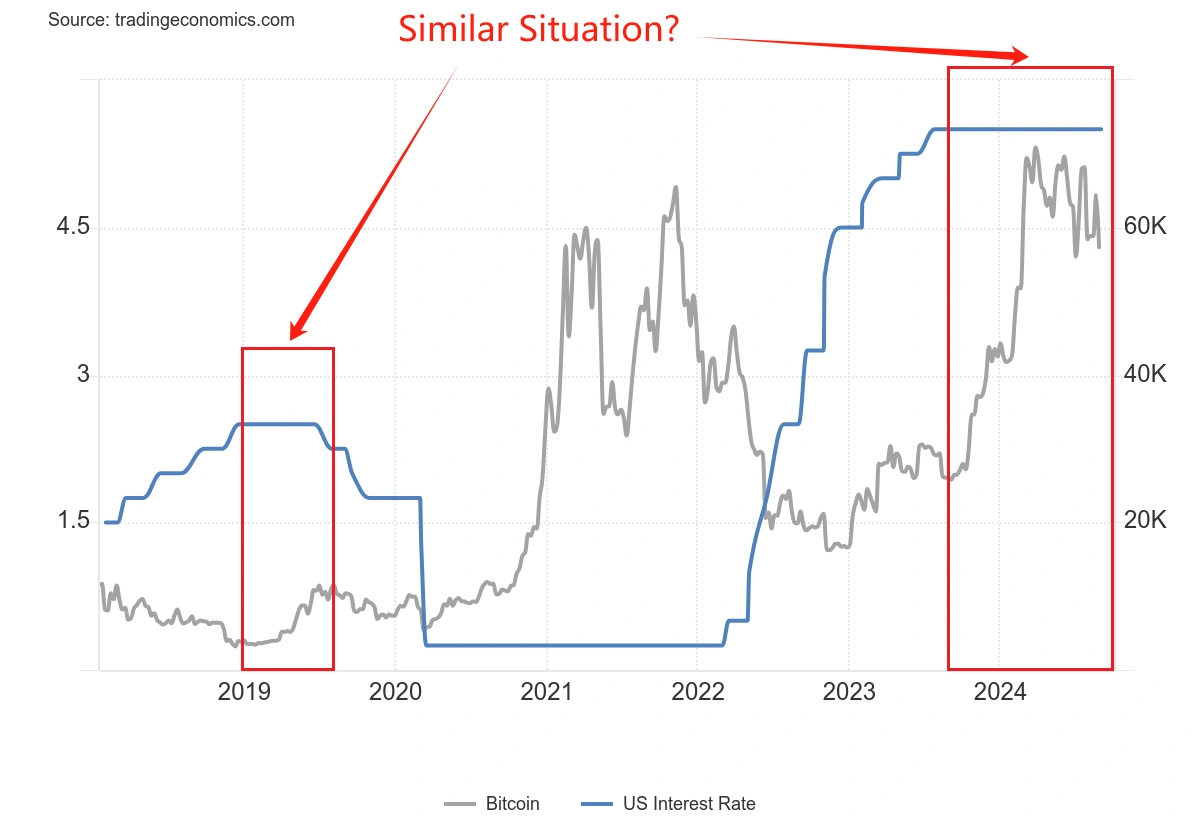
From a market perspective, Bitcoin is already near its all-time high of $115,000, and does not have the huge upside potential it did in March 2020. On the other hand, it is not like 2019, when it had just emerged from a bear market, so market confidence is relatively strong.
In terms of institutional participation, the approval of a Bitcoin ETF marks a watershed moment. While institutions were tentative in 2020, they now have standardized investment tools. However, institutions have also become more savvy and will not be driven by FOMO (fear of missing out) as they did in 2020-2021.
Perhaps, in 2024-2025, we will see a third scenario: neither the dullness of 2019 nor the frenzy of 2020, but a kind of "rational prosperity." Bitcoin may not see another 17-fold increase, but a steady rise as liquidity opens is a more convincing logic.
The key is also to look at the performance of other assets. If the stock market and gold are both rising, funds will be diverted.
Performance of traditional assets during interest rate cuts
The interest rate cut cycle not only affects the crypto market, but the performance of traditional assets is also worthy of attention.
Understanding the historical performance patterns of these assets is crucial for crypto investors, as they serve as both a source of funding and a competitor.
US stocks: Not all rate cuts lead to a bull market
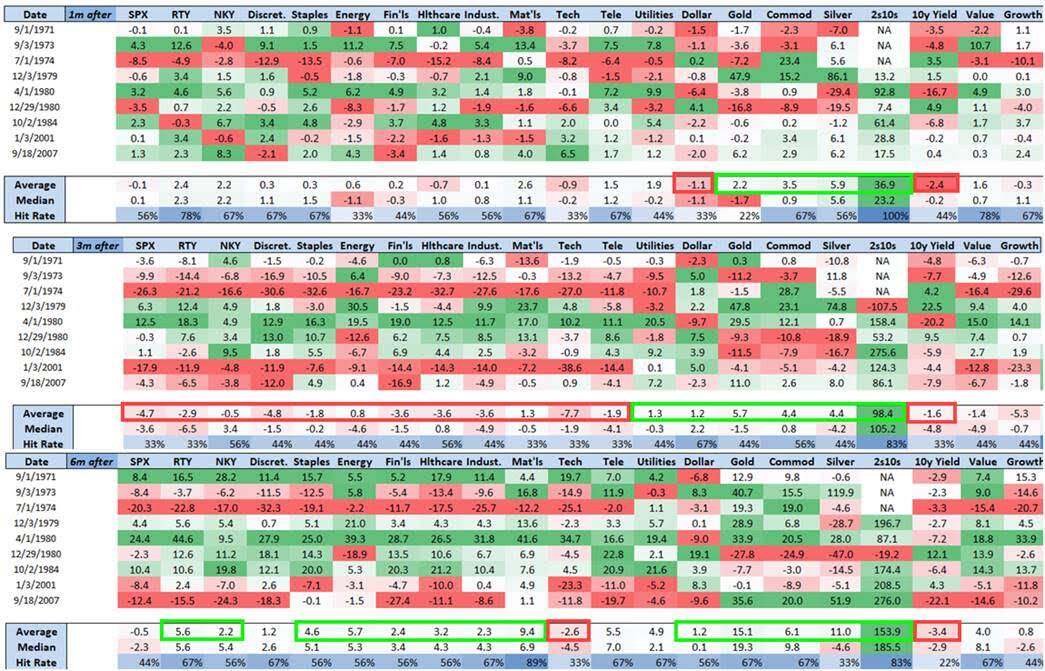
Based on BMO's research data , we can see the detailed performance of the S&P 500 during the interest rate cut cycles over the past 40 years:
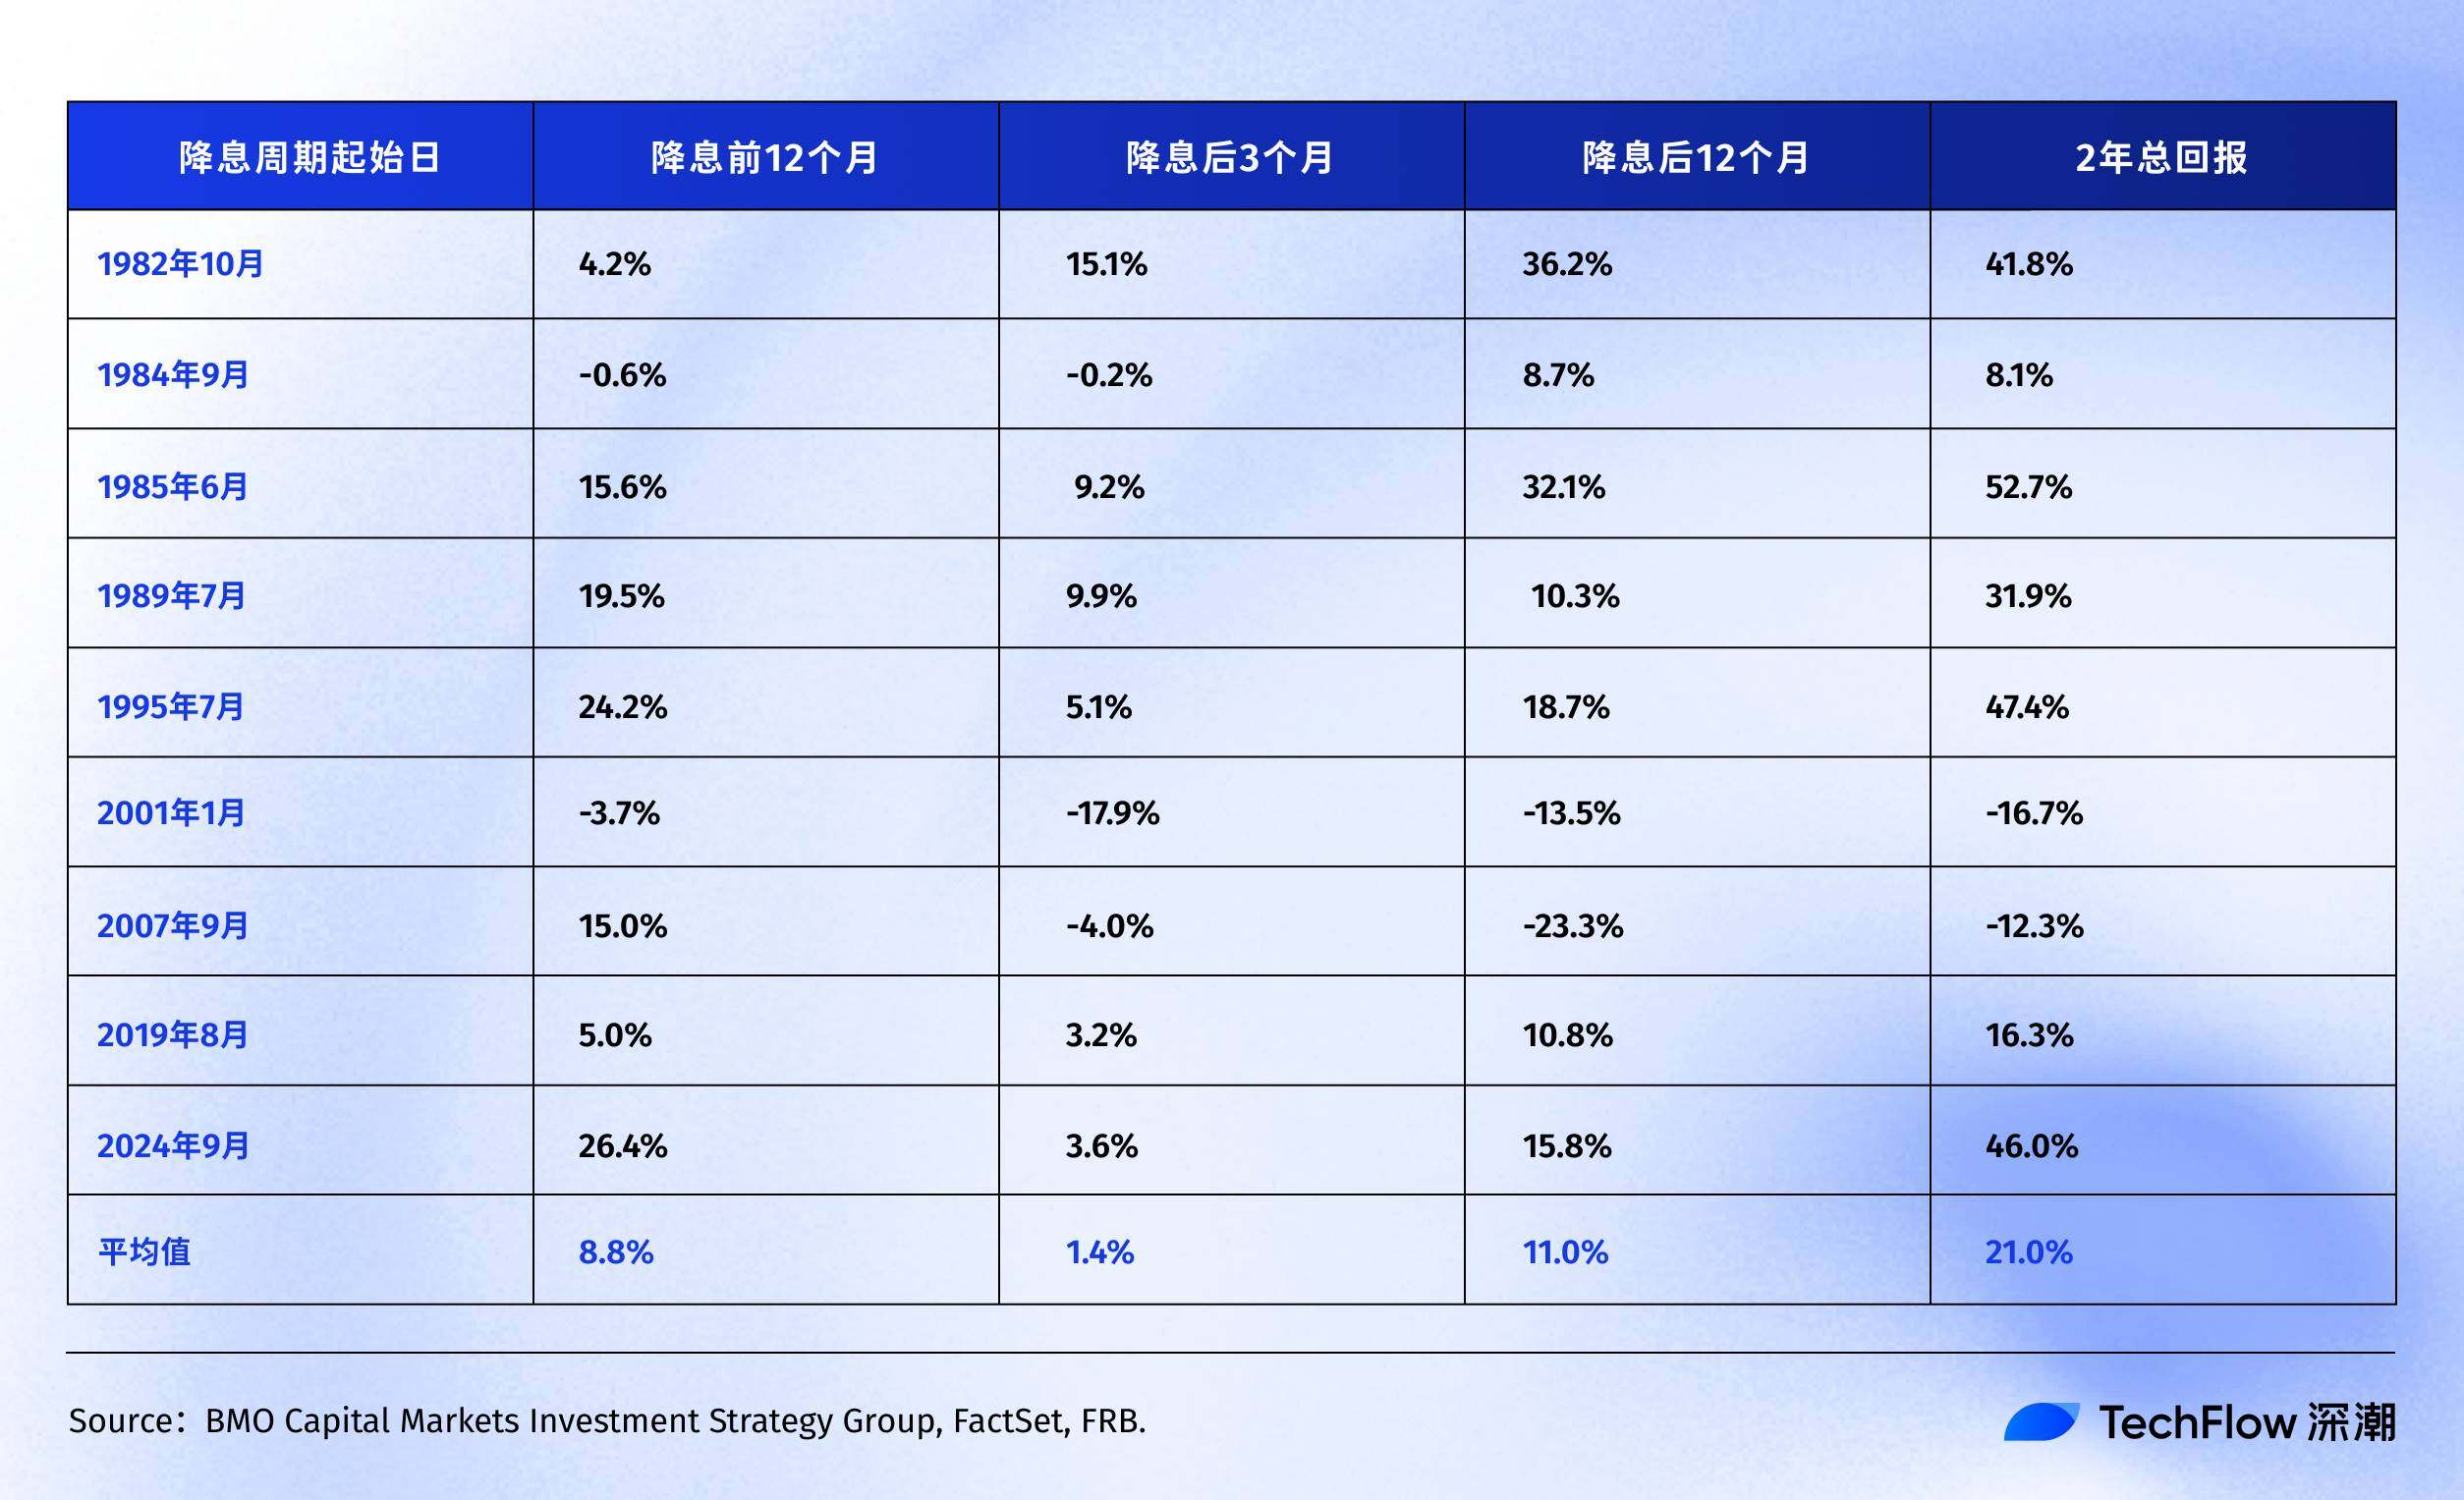
History shows that the S&P 500 has mostly delivered positive returns within 12 to 24 months following the first or renewed Fed rate cuts.
Interestingly, if the two “black swans” of the tech bubble (2001) and the financial crisis (2007) are excluded from the above table, the average return of the S&P 500 before and after the interest rate cut would be higher.
This illustrates the point perfectly. The average return of the S&P 500 is only a guide. The actual stock market performance after a rate cut depends entirely on the reason for the cut. If it's a precautionary cut, like the one in 1995, the market will be generally happy. However, if it's a firefighting cut (as during the 2007 financial crisis), the stock market will initially decline before recovering, a painful process.
Looking further at individual stocks and sector structures, Ned Davis Research shows that defensive sectors in the US stock market have performed better during previous interest rate cuts:
- In four cycles when the economy was relatively strong and the Fed resumed rate cuts with only one or two cuts, cyclical sectors such as financials and industrials outperformed the broader market.
- However, during periods of relatively weak economic conditions requiring four or more significant rate cuts, investors tended to favor defensive sectors, with healthcare and consumer staples delivering the highest median returns , at 20.3% and 19.9%, respectively. Tech stocks, on the other hand, only managed a measly 1.6%.

Furthermore, according to research by Nomura Securities, in the three months following a 50 basis point rate cut, the S&P 500 was essentially unchanged, but the Russell 2000 index of small-cap stocks rose an average of 5.6%.
This makes sense. Small companies are more sensitive to interest rates, resulting in higher borrowing costs, making rate cuts more beneficial. Furthermore, small-cap stocks often represent a risk-on environment. When they begin to outperform the broader market, it signals a shift in market sentiment toward optimism.
Back to the present, since the rate cut in September 2024:
- S&P 500: From 5,600 to 6,500 (+16%)
- Nasdaq: From 17,000 to 22,000 (+30%)
Compared to historical data, the current 16% annualized increase has already exceeded the 11% average following each Fed rate cut. More importantly, the Nasdaq's gain is nearly double that of the S&P 500. The S&P 500 was already at a historical high before the rate cut, a rare occurrence during previous rate cut cycles.
The bond market: the most stable but also the most boring
Bonds are the most compliant asset class during a rate-cutting cycle. When the Fed cuts rates, bond yields fall and bond prices rise, almost without surprise.
According to Bondsavvy’s analysis , the decline in 10-year Treasury yields has been quite stable across different interest rate cut cycles:
- 2001-2003: 129 basis points reduction
- 2007-2008: 170 basis points reduction
- 2019-2020: 261 basis points reduction (during the special period of the epidemic)
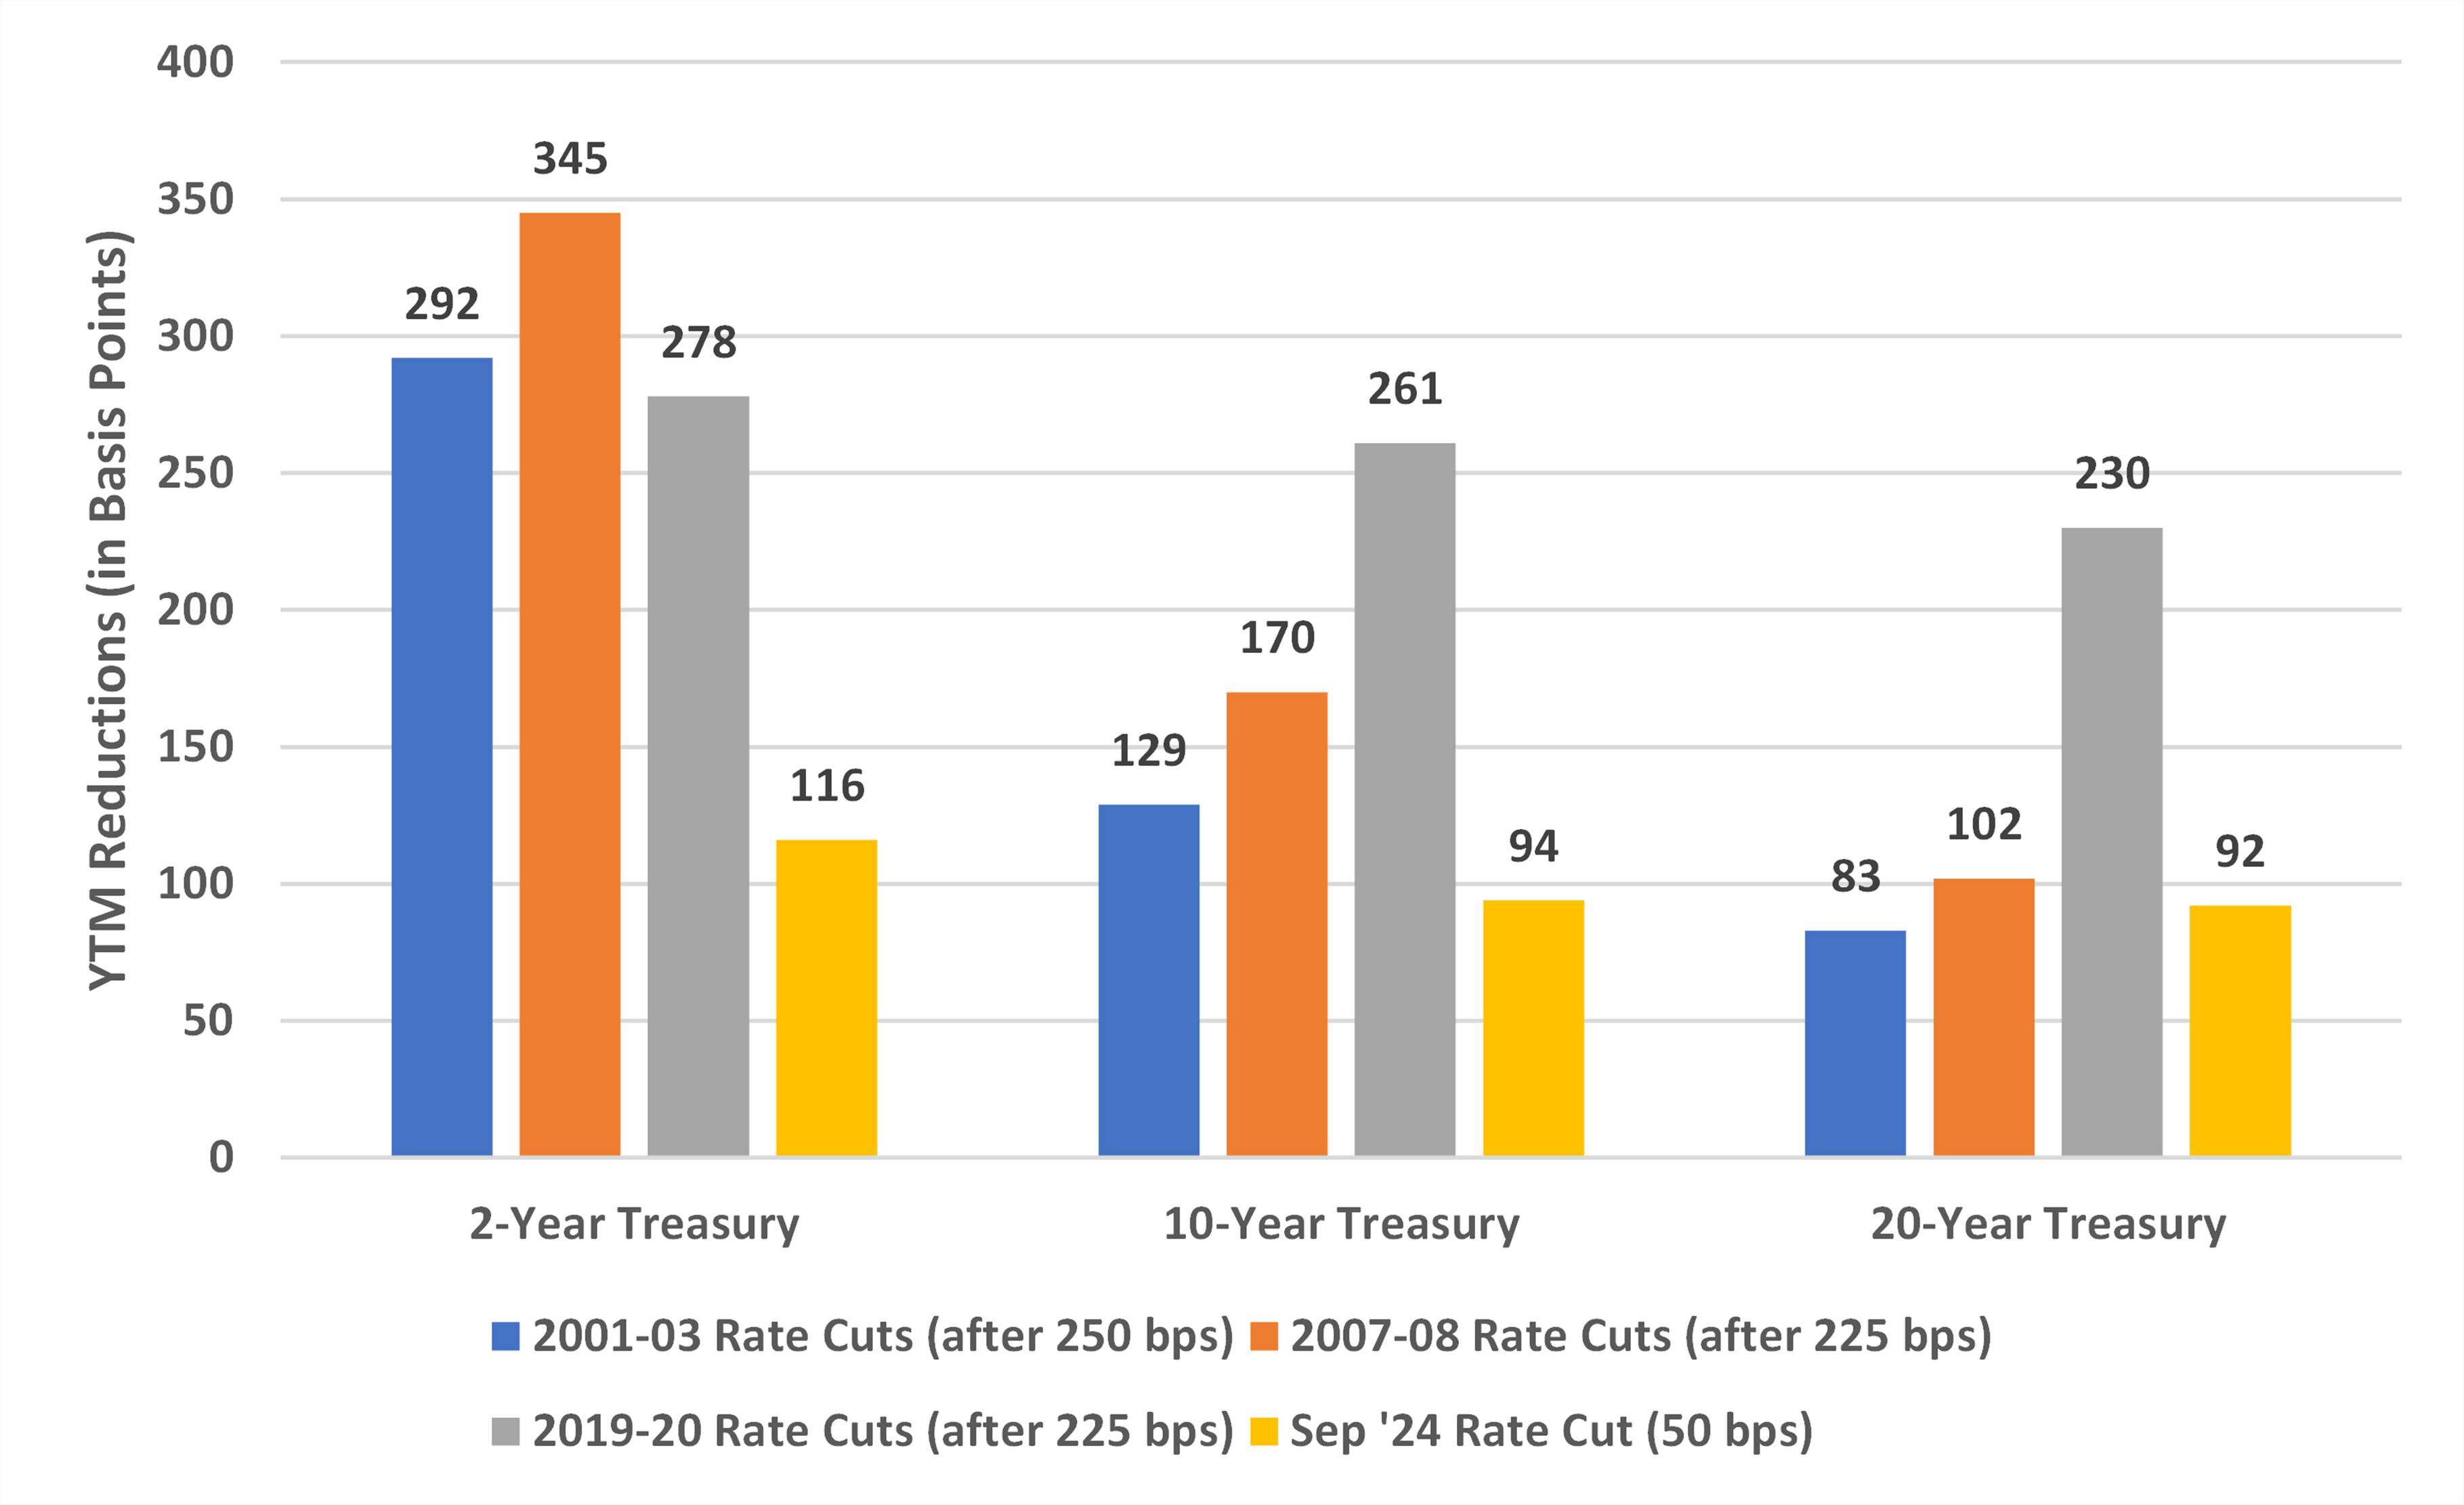
Why was the decline so significant between 2019 and 2020? This is because the Federal Reserve not only cut interest rates to zero but also implemented "unlimited quantitative easing," essentially buying bonds to artificially depress yields. This unconventional approach wouldn't occur in a normal rate-cutting cycle.
Progress of the current cycle

Based on the experience of 2001 and 2007, the total decline in the 10-year US Treasury yield should be between 130 and 170 basis points. It has already fallen by 94 basis points, and there may be room for another 35 to 75 basis points.
Converted to price, if the 10-year US Treasury yield drops another 50 basis points to around 3.5%, investors holding 10-year Treasury bonds can still achieve a capital gain of about 5%. This is good for bond investors, but for crypto investors accustomed to doubling their money, the return may seem low.
However, for investors in risky assets, bonds serve more as an "anchor" for capital costs . If government bond yields plummet while corporate bond yields rise instead of falling, it suggests the market is searching for safe assets. At this time, risky assets like Bitcoin are more likely to be sold off.
Gold: A consistent winner in a rate-cutting cycle
Gold is perhaps the asset that best understands the Federal Reserve. Over the past few decades, gold has not disappointed in almost every interest rate cut cycle.
According to Auronum's research , gold's performance during the last three interest rate cut cycles:
- 2001 rate cut cycle: 31% increase in 24 months
- 2007 rate cut cycle: 39% increase in 24 months
- 2019 rate cut cycle: 26% increase in 24 months
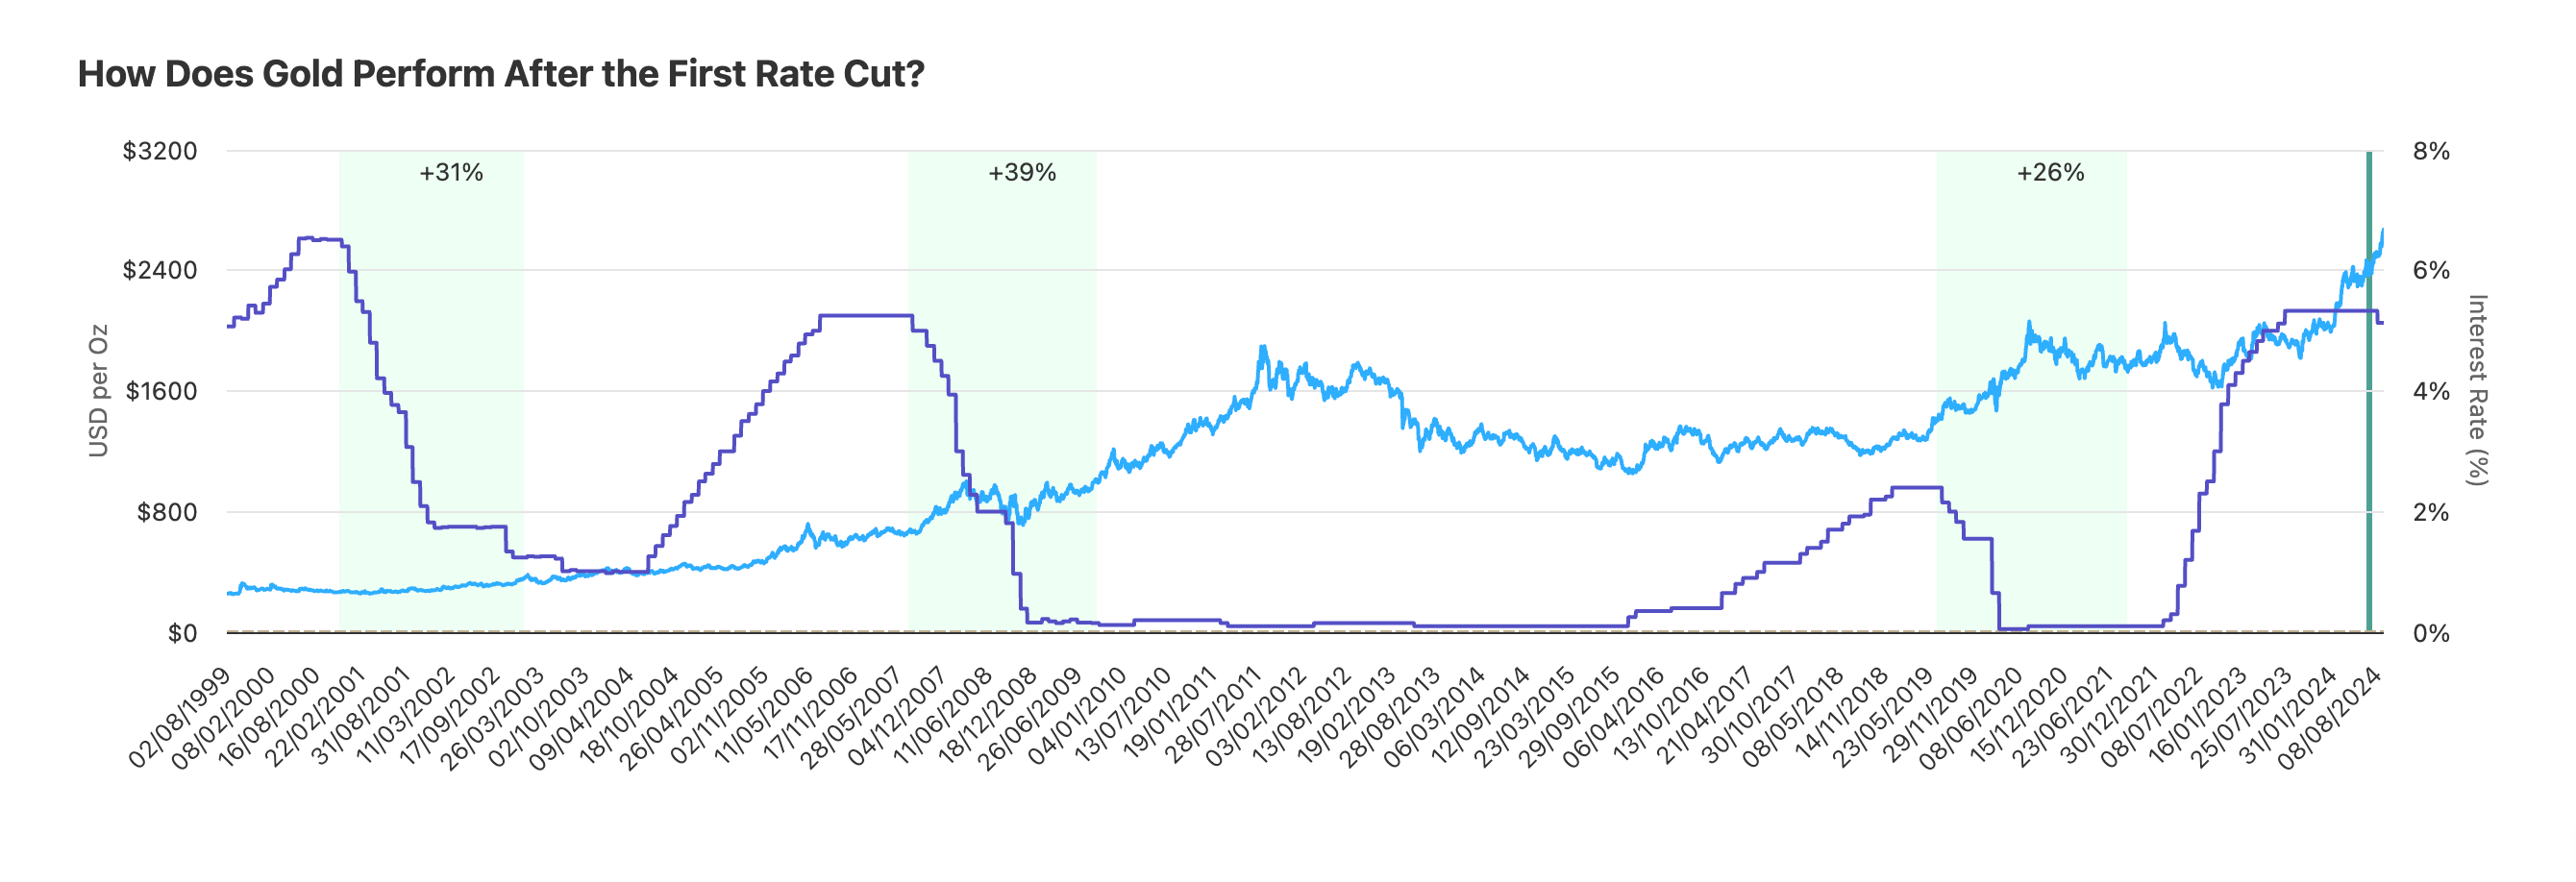
On average, gold prices rose by about 32% in the two years following the rate cut. This return isn't as stimulating as Bitcoin, but it's more stable. All three times, there were positive returns, without exception.
This cycle: performance exceeding expectations
A 41% increase in one year has already surpassed the performance of any other interest rate cut cycle in history. Why is it so strong?
First, central banks are rushing to buy gold. In 2024, global central banks purchased over 1,000 tons of gold, a record high. Countries like China, Russia, and India are all increasing their holdings. This is because they want to avoid holding all their foreign exchange reserves in the US dollar, a phenomenon known as "de-dollarization."
Second, geopolitical risks. The Ukrainian crisis and the Middle East conflict have made some parts of the world increasingly unstable, and the rise in gold prices has increasingly included a "war premium."
Third, it offsets inflation expectations. The current US government debt-to-GDP ratio exceeds 120%, and the fiscal deficit is $2 trillion annually. Where does this money come from? It can only be printed. Gold is a traditional hedge against currency devaluation. When investors worry about the purchasing power of the dollar, gold prices rise. This logic also applies to Bitcoin, but the market still trusts gold more.
Performance comparison over the past year:
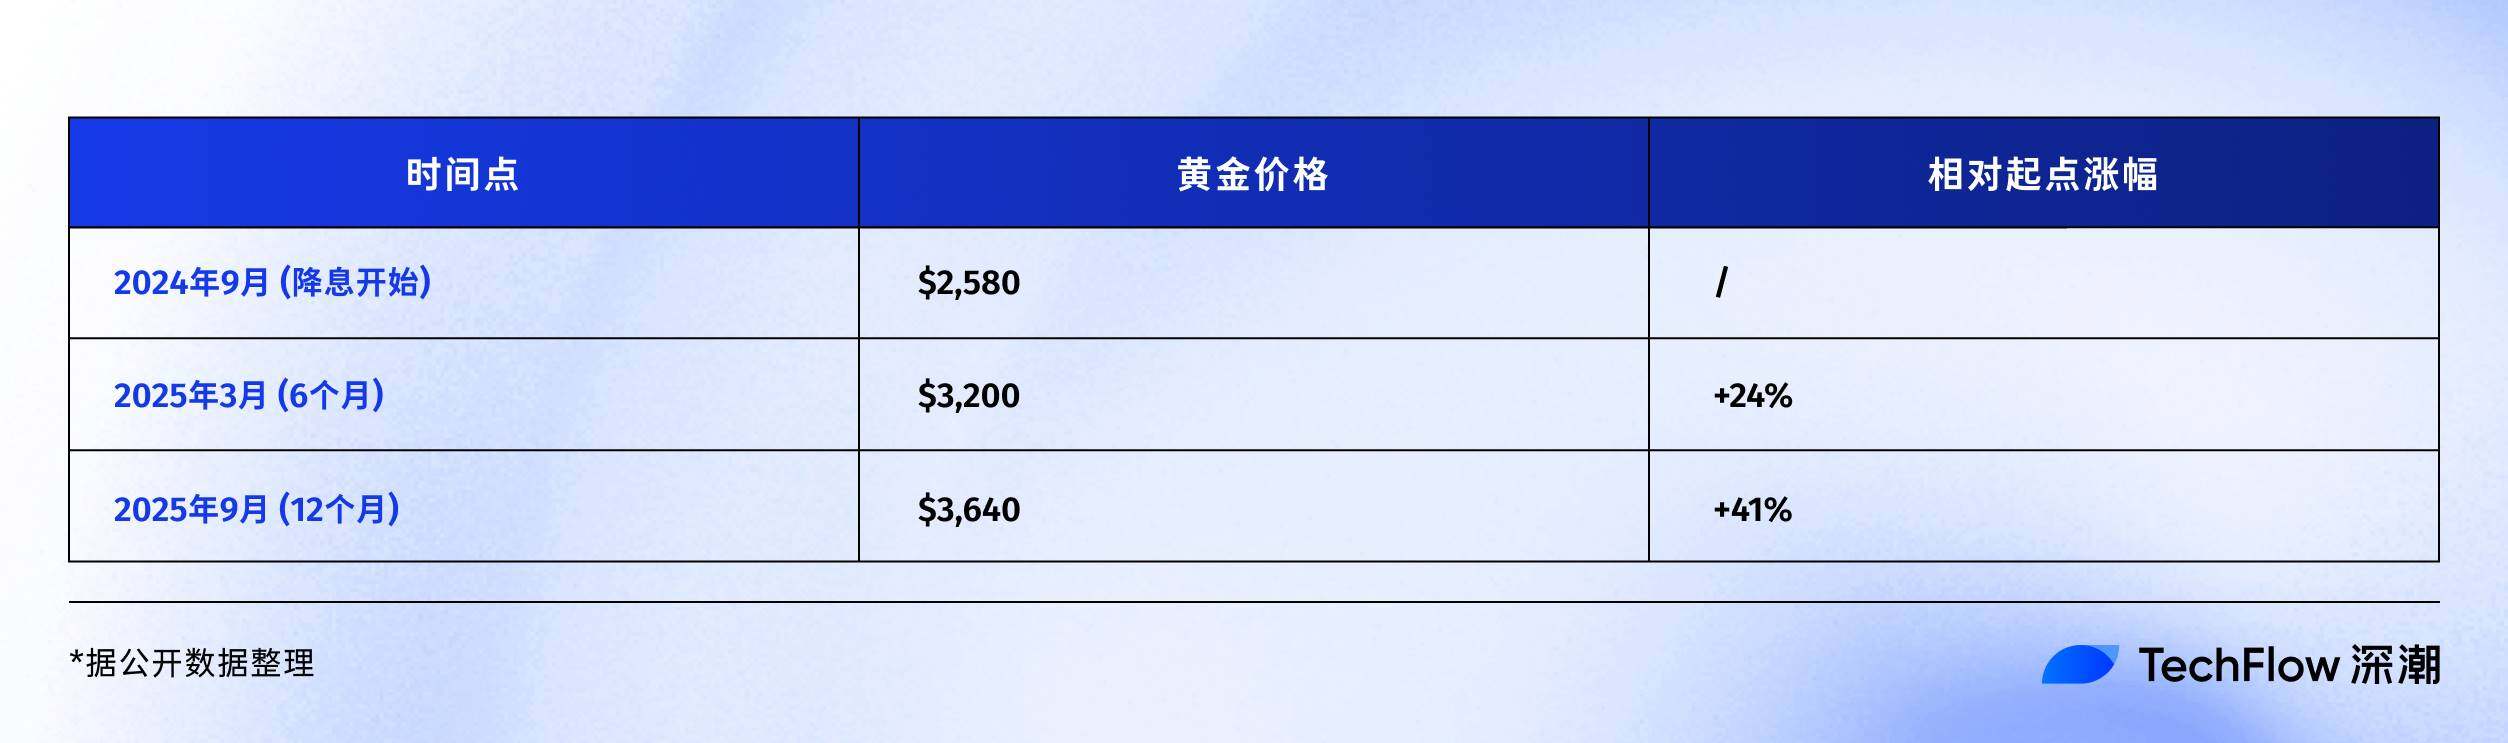
- Gold: +41% ($2,580 → $3,640)
- Bitcoin: +92% ($60,000 → $115,000)
On the surface, Bitcoin appears to be a clear winner. However, considering the market capitalization difference—gold is worth $15 trillion compared to Bitcoin's $2.3 trillion—gold's 41% gain actually absorbed a greater amount of capital. Historically, however, when gold prices rise by more than 35% during interest rate cuts, they typically enter a period of consolidation. The reason is simple: profits need to be absorbed.
Final Thoughts
In September 2025, we stand at an interesting point in time.
The interest rate cut cycle has been going on for a year, neither fast nor slow. Bitcoin is at $115,000, neither high nor low. Market sentiment is greedy but not frenzied, cautious but not panicky. This in-between state is the most difficult to judge and the most challenging to patient.
History tells us that the second half of an interest rate cut cycle is often more exciting. Following the last two rate cuts in 1995, the US stock market ushered in a dot-com bull market. Bitcoin truly took off six months after the 2020 rate cut.
If history rhymes, the next 6-12 months could be a critical window.
But history also teaches us that there are always surprises. Perhaps this time, the surprise will be an AI-driven productivity explosion, the complete elimination of inflation, and the Federal Reserve's ability to cut interest rates indefinitely. Or perhaps the surprise will be an escalation of geopolitical conflict or a new financial crisis.
The only thing we are certain of is change itself.
The dollar-dominated monetary system is changing, the way value is stored is changing, and the speed of wealth transfer is changing.
Cryptocurrency represents more than just an investment category; it's a microcosm of this changing era. So, instead of worrying about whether Bitcoin will reach $150,000 or $200,000, it's better to ask yourself:
In this changing context, am I ready?
If your answer is yes, then congratulations! The interest rate cut cycle is just the beginning, and the real drama is yet to come.


