BTC Volatility Weekly Review (May 12-19)

Key indicators: (May 12th 4pm -> May 19th 4pm Hong Kong time)
BTC/USD fell 1.5% (104.8k USD -> 103.2k USD), ETH/USD fell 5.3% (2.54k USD -> 2.405k USD)
BTC to USD spot technical indicators
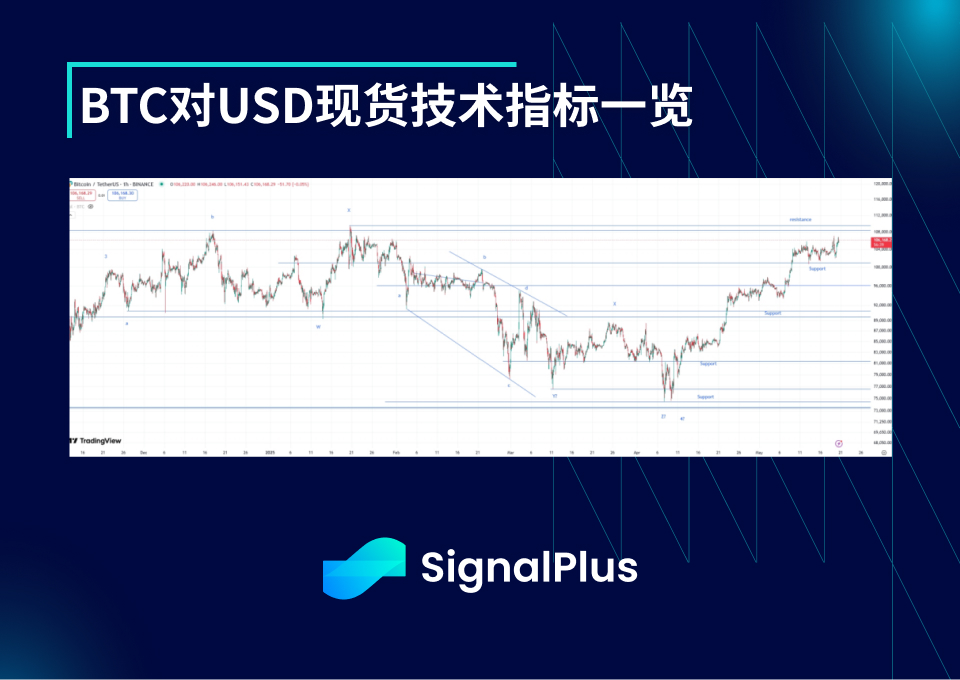
Since the price of the coin broke into the higher price range (101-110k USD), the market activity has been very low in terms of both high frequency and daily volatility. Balanced buying and selling on both sides has kept the price well within the range. Considering the market's usual volatility cycles, we found that the volatility cycles in the past year and a half are generally within 14-20 days, and rarely exceed 20 days, suggesting that the market's patience may be exhausted in the next week. We will either try to break through the all-time high again, or fall to 90-95k USD for a long-term consolidation.
While we still acknowledge that there may be pullbacks throughout the session, it is worth noting that recent support has been very strong, giving us greater confidence that the push to $125k is coming, and will arrive sooner than we initially expected. The current price trend is not clear enough, but we expect the market to follow up significantly after the price breaks $110k.
Market Theme
Last week, overall risk sentiment in the market rebounded, with the US-China tariffs adjusted back to the starting point before the increase (is this all just a nightmare?). US macro data also supported the market, including a slightly slower CPI index. US stocks have now completely flattened the sell-off caused by the trade war and are beginning to eliminate the pricing re-evaluation caused by the "US economic slowdown". Moody's downgrade of US debt from AAA to AA 1 ultimately did not cause a big splash, as the US stock market's "knee jerk reaction" to this quickly subsided, but the US dollar and long-term US bonds did lower their pricing accordingly. From a macro fundamental perspective, any further rise in US stocks will be very painful, and the market has been forced to lighten or close positions at a relatively cautious/pessimistic level for many people in the past week.
The Bitcoin market has remained well within the range as Saylor continues to actively “buy the dip” (7390 BTC were purchased at an average price of $103.5k last week). There are still a lot of sell orders at $105-107k, and the price briefly touched this level on Monday but then quickly subsided and fell to $102k, and then returned to the mid-range of $101-107k, which we have been trapped in for several weeks. Ethereum briefly peeked at the $3k figure, then hit $2.8k and then fell back, and then stabilized at the $2500 level.
BTC ATM Implied Volatility
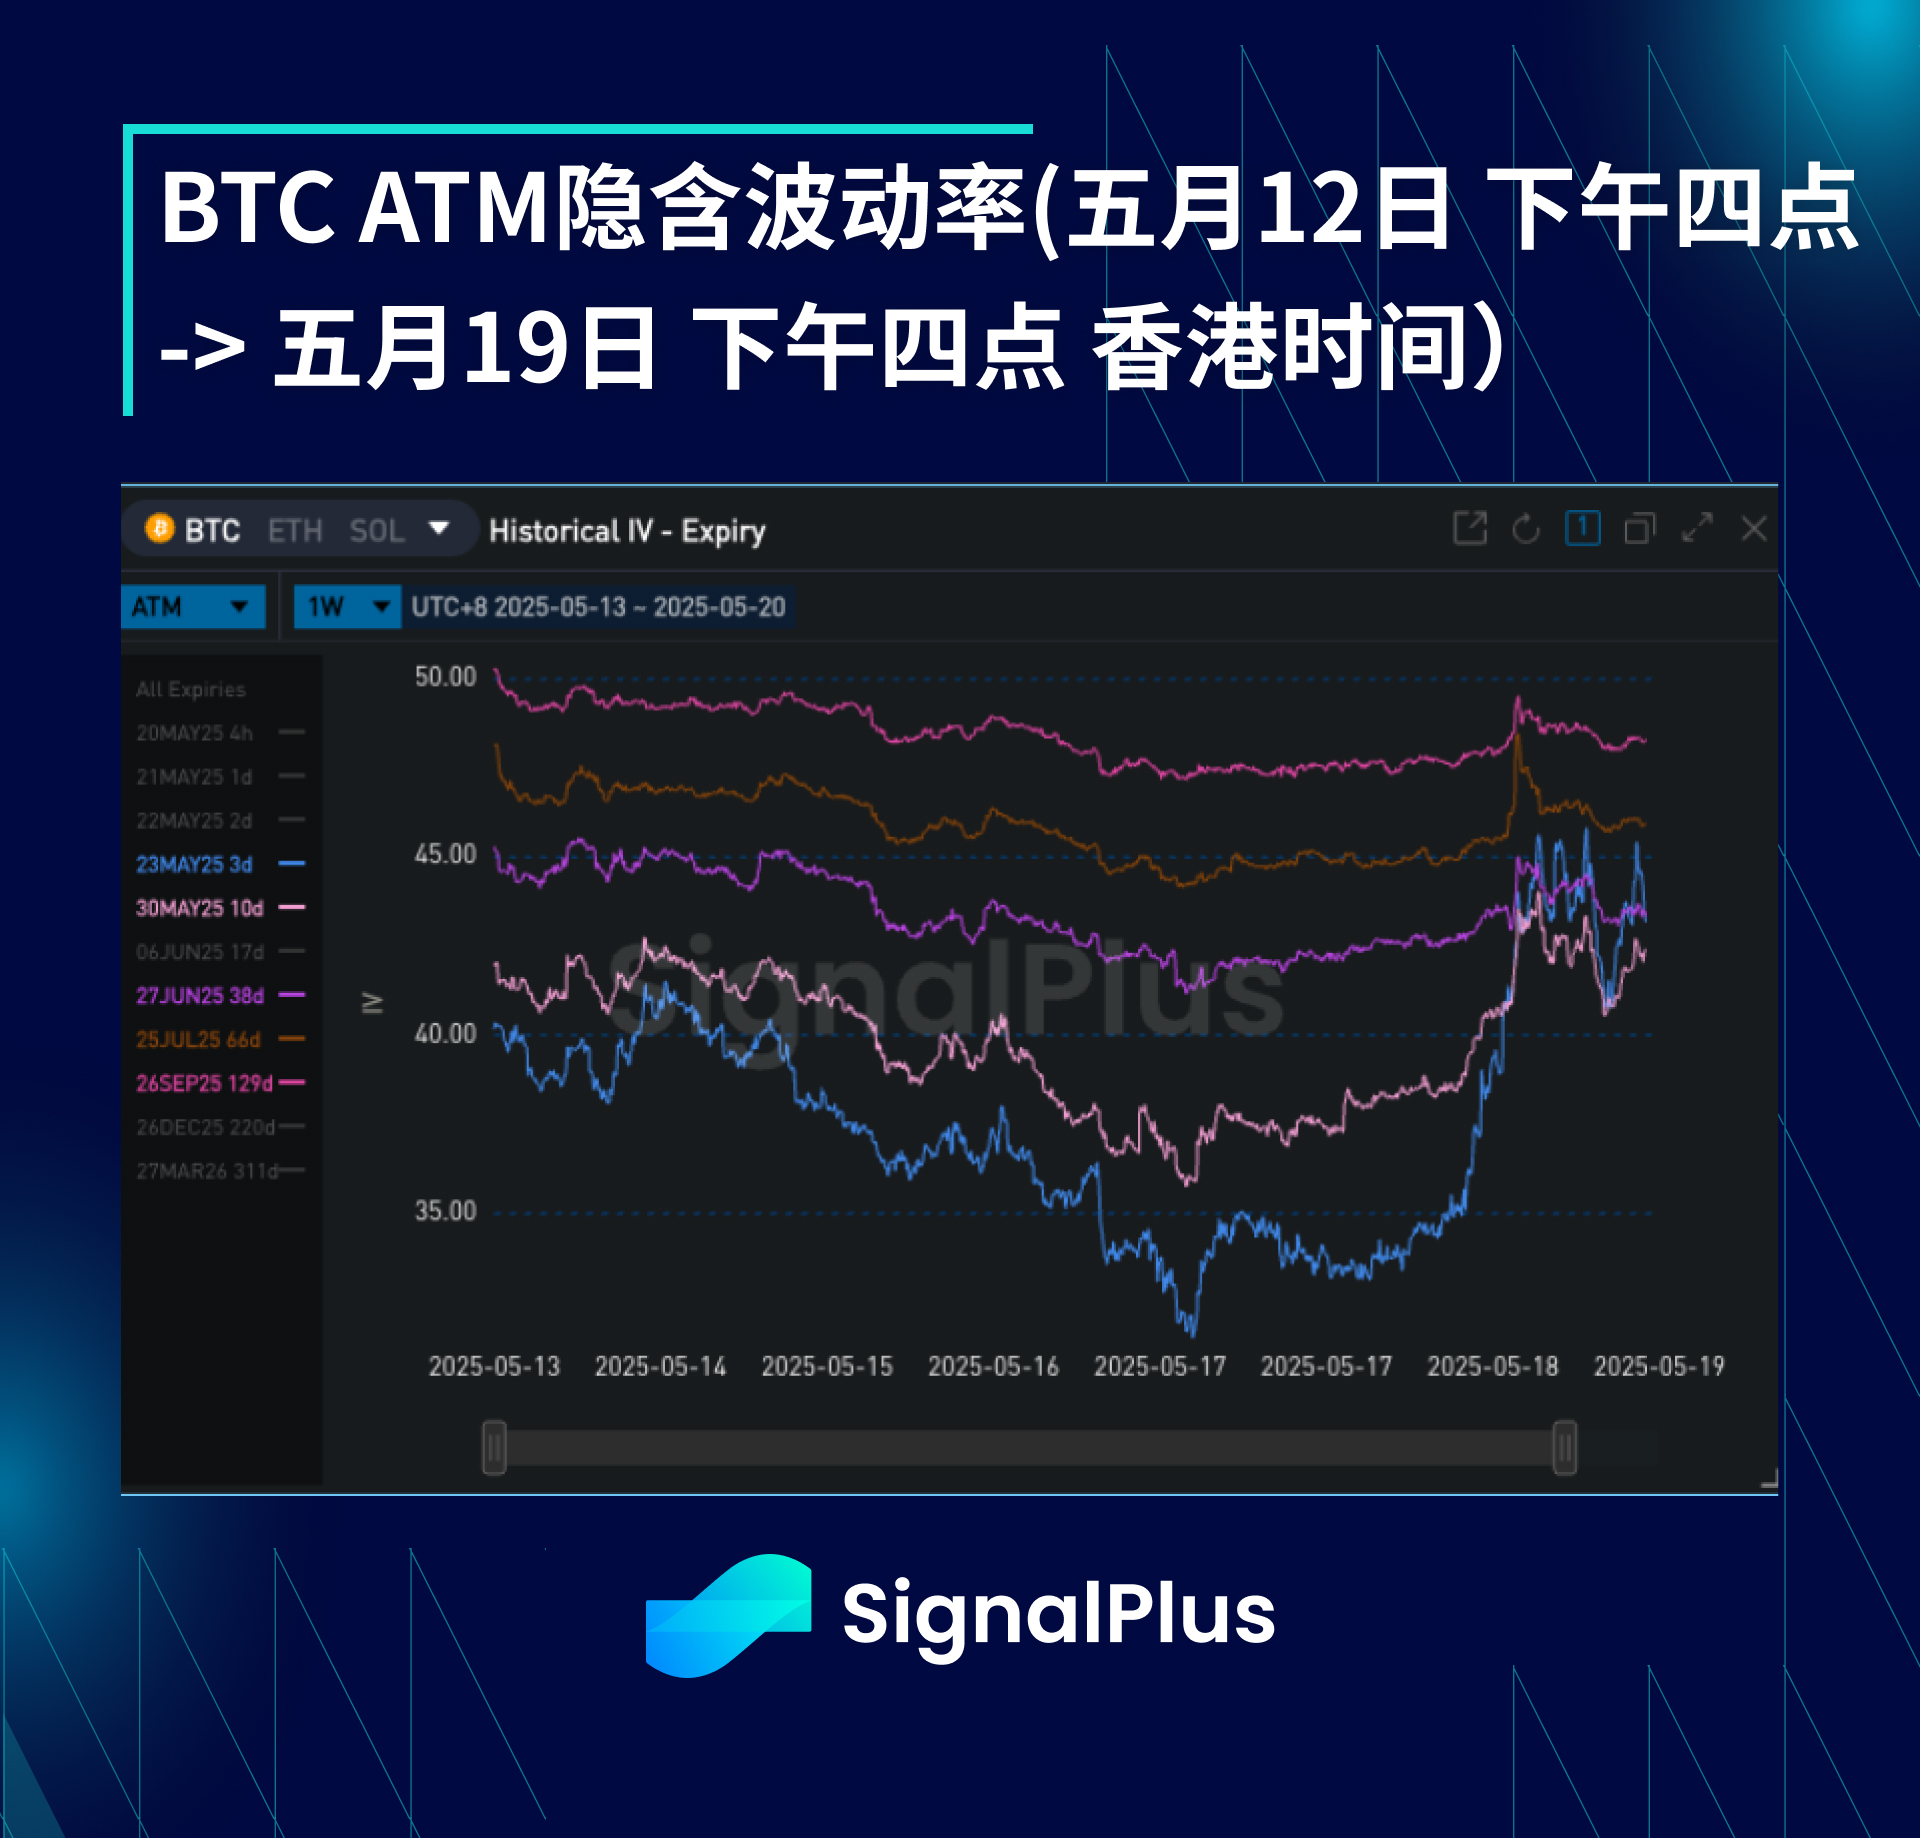
It was another week of low volatility, with volatility in the low 30s before the rapid round trip on Monday, which caused implied volatility to continue to fall last week, and the rise on Monday morning quickly disappeared. Overall, it feels like the market is still long volatility, as there is a lot of selling pressure on both sides of the price fluctuations. As we continue to suppress the range of 101-107 thousand dollars, option demand will continue to remain silent.
The volatility term structure is still very steep, with June and July expiries falling at a rate of 1-1.5 pips (not accounting for term structure changes). This means that even taking long positions at the far end is very challenging (despite low implied volatility levels on an absolute basis). Market makers appear to be holding long positions in June or July and are constantly selling the front end to support losses at the back end. This is why the front end is so depressed (almost as low as realized volatility).
BTC Skewness/Kurtosis
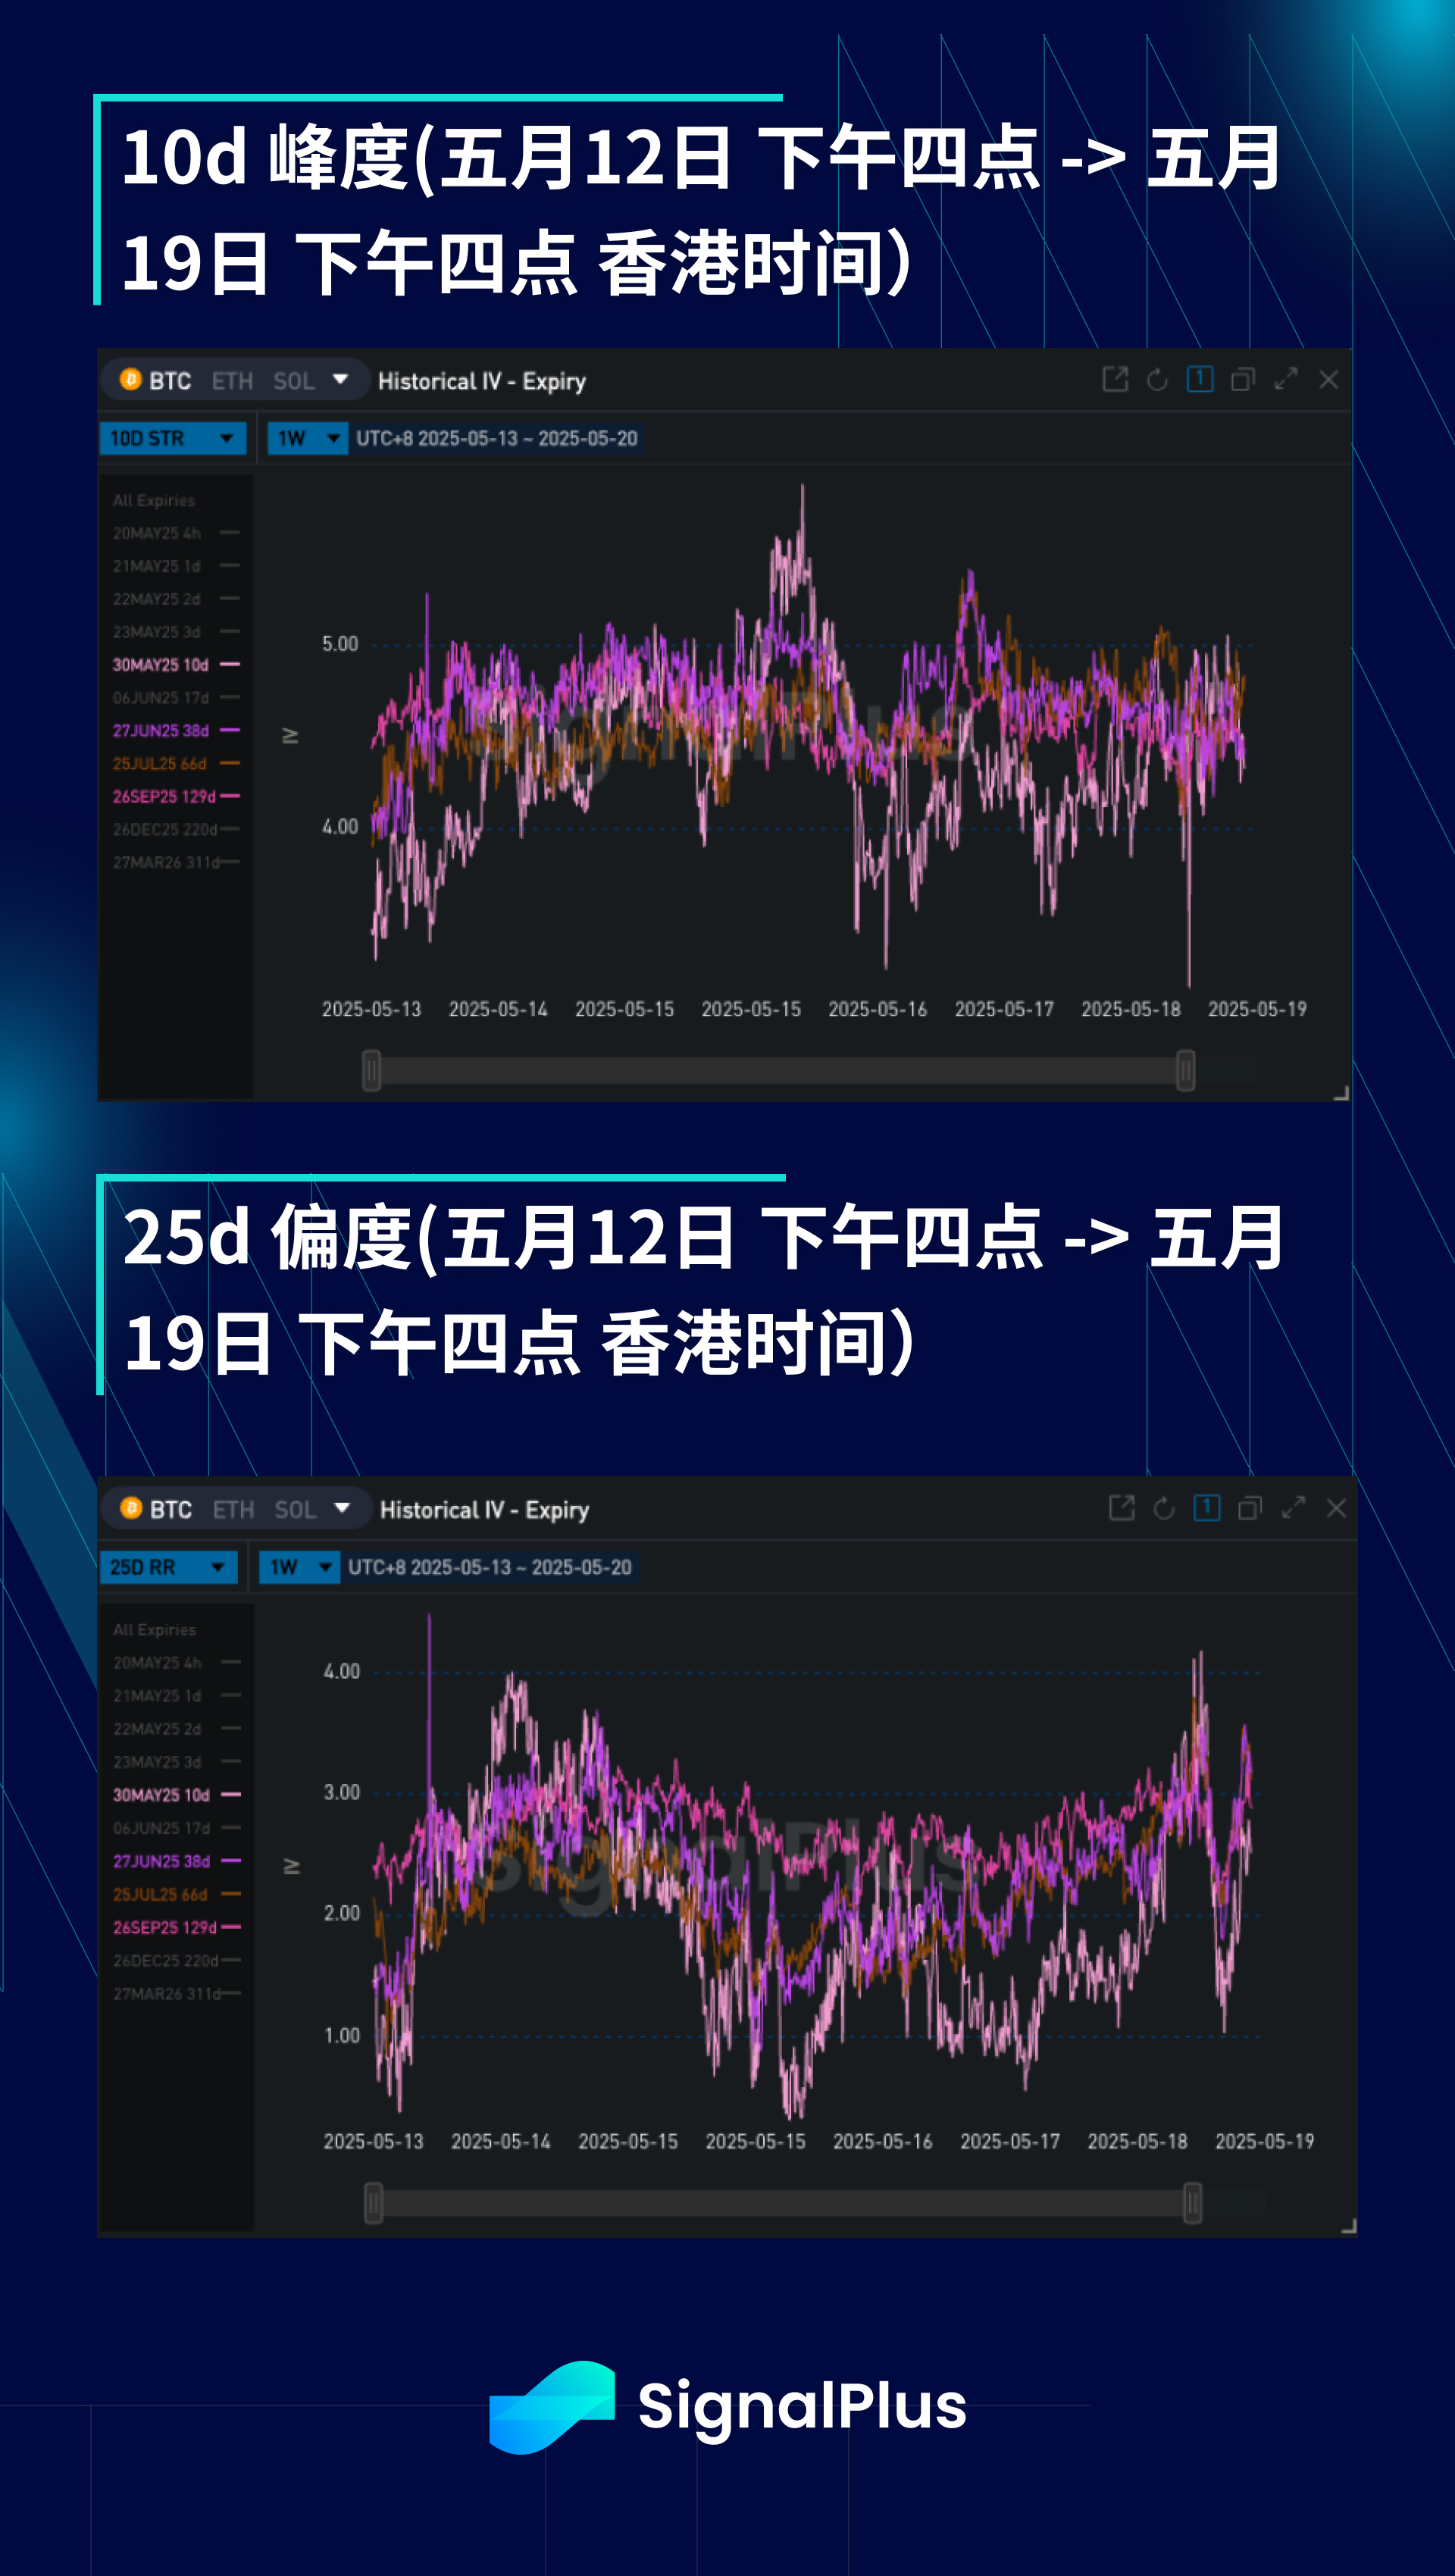
After a relatively stable week, the skewness moved sharply upwards on Monday morning as the price broke through $106k, but then was pulled back to $102k in a very volatile manner, causing the skewness to pull back. However, as there was a lot of buying demand at $100-101k, the market was increasingly worried that the price would fluctuate sharply and rise above the historical high, so the skewness price moved upwards again.
Kurtosis has remained sideways again after rebounding from the lows, and continued selling pressure is still suppressing Kurtosis. However, the market is also aware of the possibility that realized volatility will explode outside the $101-107k range, so the willingness to sell outside the range is decreasing.
Good luck to everyone this week!

You can use the SignalPlus trading vane function for free at t.signalplus.com/news , which integrates market information through AI and makes market sentiment clear at a glance. If you want to receive our updates in real time, please follow our Twitter account @SignalPlusCN, or join our WeChat group (add the assistant WeChat, please delete the space between English and numbers: SignalPlus 123), Telegram group and Discord community to communicate and interact with more friends.
SignalPlus Official Website: https://www.signalplus.com