
Macroeconomic factors affecting the crypto market in 2024
Original author: Gwen
Original source: Youbi Capital
TL;DR
Since the end of March, gold and the US dollar have decoupled and both have risen. This is mainly due to the recent excessive number of non-US geopolitical emergencies and the uncertainty factors that have led to a rapid rise in global risk aversion, and gold and the US dollar have shown their risk aversion properties at the same time.
The behavior of central banks led by China to sell US debt and support gold suggests a trend of local resistance to the hegemony of the US dollar and uncertainty in the demand for long-term US debt. As other sovereign countries have earlier expectations of interest rate cuts, such as Europe and Switzerland, if inflation continues to remain high, the dollar will continue to strengthen.
In the short term, due to the Fed's mid-year slowdown in balance sheet reduction, the growth of the Treasury's TGA balance in April exceeded expectations, which will partially offset the liquidity impact of the Treasury's bond issuance. We should pay attention to the specific bond issuance volume of the Ministry of Finance and the ratio of short-term and long-term bonds.
However, in the medium and long term, the U.S. debt crisis has not been resolved. The current U.S. government's fiscal deficit ratio has soared, and the suspension of the ceiling bill will end in January next year. The market expects that the demand for bond issuance this year will remain the same as last year. When the reverse repurchase is close to zero, the TGA account balance becomes a key indicator. At the same time, we should remain vigilant about the bank's reserve ratio.
In the two months before the election, due to the uncertainty of votes and specific policies, risk assets have historically tended to fluctuate and fall. In order to maintain its independence, the Federal Reserve will try its best to maintain economic growth and keep the market liquidity sufficient during the election year.
The US economy shows strong domestic demand, repeated inflation, and expectations of economic recession have dropped significantly compared to last year. Institutions' expectations of "preventive" interest rate cuts have collectively adjusted to the second half of the year or even after the new year. CME data shows that the market's expectations for interest rate cuts in September and November are the highest at ~45%, while expectations for the first interest rate cuts in December and January are gradually increasing. Combined with the historical performance of interest rate policies in election years, interest rate policies before election months (i.e. September) are usually more cautious. In addition, the sufficient conditions for interest rate cuts are poor employment and weak inflation, and we should remain vigilant against tightening financial markets.
Balance sheet expansion can directly affect market liquidity more than rate cuts. The Fed is currently considering slowing down balance sheet reduction in advance. By slowing down the reduction of US debt, the market generally expects that the Fed will slow down balance sheet reduction in May or June to hedge against liquidity tightening, stop balance sheet reduction at the beginning of next year, and then usher in a balance sheet expansion cycle. At the same time, history shows that there is a high probability of a short-term reversal operation after the election.
1. Gold and the U.S. dollar “decouple”
Figure 1: USD and gold price chart
In the past, the trend of international gold prices was usually negatively correlated with the US dollar index, but since the end of March, gold and the US dollar index have shown an abnormal rise in the same trend. The negative correlation can be explained by the three attributes of gold, namely commodity attributes, currency attributes and safe-haven attributes, which need to be discussed in combination.
Commodity pricing: A stronger pricing currency will reduce the price of gold (the same is true for commodities)
Financial attributes: Gold is a substitute for the US dollar and a potential substitute for the decline in the credit of the US dollar. When the US dollar is weak, investing in gold may yield higher returns;
Safe-haven property: Usually, a stronger dollar indicates strong economic fundamentals, which means that the demand for safe-haven assets decreases. However, as a world currency, the dollar also has safe-haven properties. Specific risks need to be discussed specifically.
1.1 Gold price surges
The recent unusual rise in gold prices has attracted a lot of attention, and here are 2 main reasons.
1) Market risk aversion caused by geopolitical wars. Moscow air strikes, Israel's air strikes on the Iranian embassy in Syria (the direct trigger), Iran's direct attacks on Israel, etc., are all increasing the demand for gold purchases around the world, which is one of the driving forces behind the rise in gold prices in the short term.
2) Central banks of various countries continue to buy gold, increasing demand. In order to avoid the risk of US debt, some central banks began to reduce their holdings of US debt and increase their holdings of gold, thereby pushing up the price of gold. This also indirectly reflects the crisis of confidence in the US dollar, which may evolve into de-dollarization in the future. For example, the gold reserves of the People's Bank of China increased by 10 tons in January, the 15th consecutive month of gold reserves; the current total gold reserves are 2,245 tons, an increase of nearly 300 tons from the end of October 2022 when the increase in reserves began to be announced again.
Figure 2: Global central bank gold purchase trend
https://china.gold.org/gold-focus/2024/03/05/18561
1.2 The US dollar index rose
1) The domestic demand of the US economy is stable, which has delayed the expectation of interest rate cuts. The economic data of the US in Q4 of 2023 showed that the current economy has a certain resilience, while the Q1 of 2024 showed that the domestic supply in the United States is currently insufficient to meet the demand, and it needs to rely on overseas imports. In addition, the repeated inflation data has reduced the necessity of interest rate cuts. Maintaining a tight monetary policy to stabilize the demand for the US dollar has led to the rise of the US dollar.
2) The US dollar passively rises due to the influence of international exchange rates, such as Switzerland unexpectedly cutting interest rates ahead of schedule. If other currencies adopt monetary easing policies, the interest rate differential will cause the US dollar exchange rate to rise relative to other countries, thereby pushing up the US dollar index.
3) As the world currency, the U.S. dollar undertakes some of the safe-haven demand. When the geopolitical crisis does not involve the U.S. mainland, the safe-haven property of the U.S. dollar will be partially revealed, and at this time it will have the same effect as gold.
1.3 Why are both strong?
Reason 1: Both the U.S. dollar and gold have the attributes of safe-haven assets. When sudden risk events occur in a concentrated manner, leading to the deterioration of geopolitical crises or economic crises, the market's risk aversion sentiment is too strong, which will lead to a situation where both currencies strengthen. At the same time, the commodity and financial attributes of gold have less impact than its safe-haven attributes. For the U.S. dollar, the United States maintains a tight monetary policy, while the currencies of other economies weaken, supporting the strengthening of the U.S. dollar. Similar situations have also occurred in history, such as the failure of the U.S. foreign intervention in 1993, the European sovereign debt crisis in 2009, and the instability in the Middle East.
Reason 2: Although the U.S. dollar shows a strengthening trend in the short term, the behavior of some central banks reducing their holdings of U.S. Treasuries and increasing their holdings of gold also implies resistance to the U.S. dollar hegemony. There is a trend of de-dollarization in some areas, and we should be vigilant against the U.S. dollar credit crisis.
From the perspective of gold trend, the trend of gold in the short term mainly depends on whether Iran will retaliate against Israel on a large scale. If the geopolitical situation continues to deteriorate, gold may continue to soar. From the trend of the US dollar index, some other sovereign currencies currently have earlier expectations of interest rate cuts, such as the euro and the pound, and the Swiss National Bank has already cut interest rates in advance. Among them, the US dollar still has room for interest rate differentials and may still have certain support in the future.
2. Uncertainty of liquidity risk
2.1 Market liquidity is hindered
Financial market liquidity is an important indicator for us to judge future market trends. The bull market at the beginning of the year was also due to the liquidity of traditional funds brought by the passage of BTC ETF and the short-term increase in liquidity caused by the dovish remarks of the Federal Reserve. In the end, there was a pullback due to the lack of liquidity in the overall financial market.
Financial markets often measure market liquidity through real liquidity indicators = Fed liabilities - TGA - reverse repo = financial institution deposits + currency in circulation + other liabilities. For example, in the figure, we can find that BTC and financial liquidity indicators are positively correlated in the last cycle, and even have an overfitting trend. Therefore, in an environment with abundant liquidity, the market's risk appetite will be improved, especially in the crypto market, where the impact of liquidity will be amplified.
Figure 3: BTC and financial liquidity indicators
The recent decline in the scale of reverse repurchase is mainly used to offset the decline in liquidity caused by the issuance of additional US bonds and the Fed's balance sheet reduction. The liquidity release in March was also mainly contributed by the release of reverse repurchase. However, the scale of reverse repurchase continues to decline, and the Fed currently maintains a monthly scale of 95 billion in balance sheet reduction. At the same time, in order to cope with the arbitrage space caused by low interest rates, the BTFP interest rate has been adjusted to no less than the reserve interest rate since January 25. After the arbitrage space narrowed, the use of BTFP turned to decline, and it was impossible to further increase the size of the Fed's balance sheet. In addition, April is facing the tax season, and the short-term increase in TGA accounts has reduced the overall market liquidity. Since 2010, the median TGA account in April has increased by 59.1% month-on-month, and it will gradually return to normal over time.
Figure 4: Liquidity in US Financial Markets
In summary, in the short term, the tax season ended in May, and TGA growth exceeded expectations. Institutions predict that the Fed will start to ease the QT progress in the middle of the year and ease the trend of liquidity tightening. However, in the medium and long term, the market lacks new growth momentum for liquidity. The US financial liquidity has continued to decline due to the Fed's balance sheet reduction process and the near exhaustion of reverse repurchase scale, which further affects risky assets. The adjustment of the Bank of Japan's monetary policy will increase the uncertainty of liquidity risk, which will bring certain downside risks to technology stocks, crypto assets, and even commodities and gold.
2.2 US debt risks
The excessive volatility of U.S. Treasury bonds was an important factor in the "triple kill of stocks, bonds and gold" event in March 2020. The recent surge in U.S. Treasury yields has once again exposed the potential problem of imbalance between supply and demand in the U.S. Treasury market.
2.2.1 Oversupply
The deficit rate in 2023 reached -38%, up 10% year-on-year. The soaring high deficit rate means that there is a need to continue to issue more U.S. debt this year. The high debt and high deficit caused by the pandemic are superimposed on the interest rate hike cycle. The weighted average interest rate of the total outstanding debt in fiscal year 2023 is 2.97%, which continues to increase the total interest that the United States needs to repay. In 2023, the new U.S. debt will be 2.64 trillion, and in 2024, the new U.S. debt will be 0.59 trillion, and the current total amount is 34.58 trillion.
In the short term, the refinancing expectations given by the Ministry of Finance on April 29 show an increasing trend, and the specific situation needs to be tracked by the Ministry of Finance's officially released quarterly refinancing plan. Although institutions represented by Nomura generally believe that the Ministry of Finance's tax revenue unexpectedly increased in April due to the increase in wage levels last year, the current Ministry of Finance's TGA account has increased significantly, exceeding expectations by $205 billion, and Yellen may lower the financing expectations.
In the medium and long term, the market generally expects that the United States will issue 2-2.5 trillion bonds this year, so it will issue 1.41-1.91 trillion this year, which is close to the average speed of Q1 in 2024. The bill to "suspend the U.S. debt ceiling" will be terminated on January 1, 2025. In order to prevent the recurrence of the U.S. debt crisis, the Treasury Department has the motivation to issue enough U.S. debt to ensure short-term government spending and normal operations after the suspension before ending the suspension of the debt ceiling. Wall Street expects that no matter who wins the presidential election in November, the U.S. government will continue to issue a large number of bonds.
Figure 5: U.S. Treasury issuance scale
2.2.2 Weak demand
Foreign investors and the Federal Reserve are the largest buyers of U.S. Treasuries, accounting for half of the market share of tradable U.S. Treasuries. Although the Federal Reserve is currently considering slowing down its balance sheet reduction, the two have stopped increasing their holdings of U.S. Treasuries since 2022, and the supply pressure has been transferred to domestic investors in the United States, and the amount of investment purchased by the resident sector has increased significantly. Domestic investors prefer short-term bonds, and the amount of acceptance is limited and the volatility is large. The current issuance of short-term bonds has exceeded the ideal range. Since the debt ceiling was suspended in June 2023, the Treasury Department's short-term bills accounted for 53.8% (85.9% in November 23), and the Treasury's Borrowing Advisory Committee recommends that the proportion of short-term bonds should be maintained at 15-20%.
<Long-term bond buyer>
The Fed's balance sheet reduction process is ongoing. From Q1 22 to Q4 23, it has reduced its holdings by 1016 B. In the short term, the process of balance sheet reduction may be slowed down, but there will be no sudden change. According to the March FOMC meeting, all FOMC members agreed to reduce the monthly balance sheet reduction by about half, the upper limit of MBS reduction remained unchanged, and the reduction of US Treasury bonds was reduced. If the Fed slows down the balance sheet reduction process as expected in the near future, it will offset some long-term debt demand.
Japan, China and the United Kingdom are the top three buyers, holding more than one-third of foreign investors' holdings of U.S. Treasuries. The demand of major foreign investors rebounded at the end of 2023, but has recently shown a downward trend again, especially China, which sold 20 billion U.S. Treasuries again in the first two months of 2024.
Due to changes in local monetary policies and the current strengthening of the US dollar index, the European Central Bank is expected to cut interest rates in June. The yen exchange rate has depreciated sharply again and has not reversed the trend. When the yen fell below the 150 mark in October 2023, the monetary authorities chose to sell US bonds to maintain the stability of their sovereign currency exchange rate;
The recent recurrence of inflation in the United States, and the actions of some central banks, represented by China, to sell U.S. bonds and increase their gold holdings indicate that they are de-dollarizing and reducing the risk of asset depreciation. At present, China has not reversed the trend and increased its holdings;
The uncertainty of the geopolitical crisis also affects the demand for US Treasuries.
Therefore, if the Fed slows down its balance sheet reduction ahead of schedule, the dollar starts to weaken, or geopolitical tensions ease, some demand for long-term U.S. Treasuries may be restored.
<Short Debt Buyer>
The purchase of bonds by the household sector is unstable, and individual investors and hedge funds have alleviated the current imbalance between supply and demand. However, there is an upper limit for domestic individual investors to purchase bonds, and hedge funds are sensitive to interest rates, easily affected by the market, and there is a possibility of large-scale selling, so the demand of the household sector in the future will be limited and unstable.
The liquidity buffer created by the larger short-term debt comes from money funds. The characteristics of money funds are flexible deposits and withdrawals. The demand is for overnight reverse repurchases or short-term treasury bonds with a maturity of less than six months, and there is very little demand for long-term treasury bonds. At the same time, the floating losses of money funds' assets are likely to trigger a market run, so in more cases they tend to choose overnight reverse repurchases with more stable interest rates. In the future, when the U.S. bond market fluctuates greatly, money funds are also likely to sell U.S. bonds.
Since the suspension of the US debt ceiling in Q2 2023, money market funds have increased their holdings of short-term US debt by 203 billion. By transferring ON RRP to undertake part of the demand for short-term US debt, the scale of reverse repurchase will drop by 271 billion again in 2024. Morgan Stanley expects the scale of reverse repurchase to drop to zero in August, and the Fed will start to reduce QT in June. However, it is not ruled out that the Fed will slow down the reduction of the balance sheet in advance and postpone the time point of zeroing the scale of reverse repurchase to Q4.
Figure 6: Overnight reverse repo size of the Federal Reserve
In summary, there are many medium- and long-term factors that lead to imbalances in both supply and demand. If the Fed starts to slow down the process of shrinking its balance sheet in May, the dollar starts to weaken or geopolitics is eased, there is a chance to ease the US debt crisis from the long-term debt demand side. However, the downward trend in the scale of reverse repurchase will not be reversed in the short term. After the reverse repurchase rules are close to zero, the trend of TGA will become a key indicator for releasing liquidity, and at the same time, be vigilant about changes in the reserve ratio of US deposit institutions.
III. Monetary Policy Trends
3.1 Impact of the US election on risky assets
The biggest impact of the US election on risk assets is the negative impact in the first two months (September-October) and the positive impact in the last month (December). In the first two months, due to the uncertainty of the election results, the market usually shows a risk-averse sentiment, which is particularly evident in years with fierce competition and low vote differences, such as 2000, 2004, 2016 and 2020. After the election, the market tends to rebound as the uncertainty subsides. The influencing factors of the election year need to be combined with other macro factors.
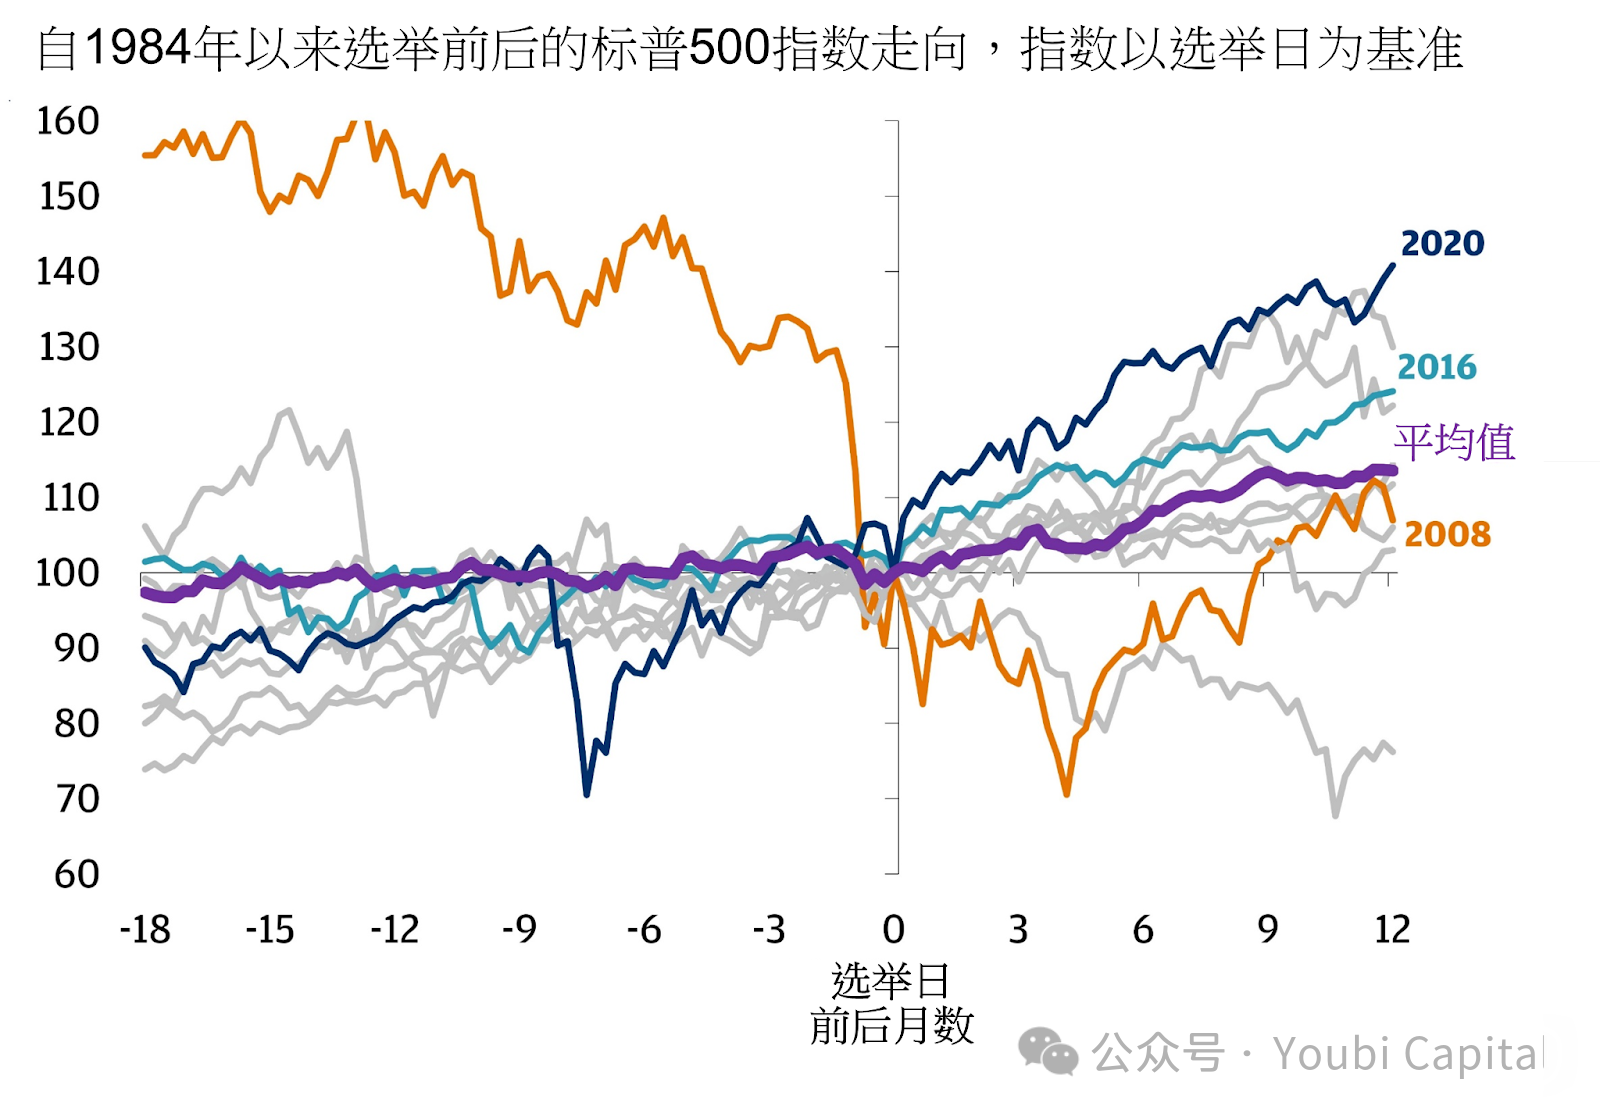
Figure 7: S&P 500 Index Trends Before and After Election Day, from JPMorgen
https://privatebank.jpmorgan.com/apac/cn/insights/markets-and-investing/tmt/3-election-year-myths-debunked
Bank of America analyst Stephen Suttmeier analyzed the average monthly returns of the S&P 500 in election years and found that the strongest month in an election year is usually August, with an average increase of just over 3% and a winning rate of 71%. Subsequently, December is usually the month with the highest profit opportunities, with a winning rate of 83%.
Figure 8: Average election year returns, from Bank of America analyst Stephen Suttmeier
https://markets.businessinsider.com/news/stocks/stock-market-2024-outlook-trading-playbook-for-crucial-election-year-2024-1
In addition to the uncertainty of the results caused by the difference in votes/party disputes, the market is also affected by the specific policy differences between the candidates. Biden and Trump are still the main candidates in 2024, and there are also major differences in their economic policies.
Biden's reelection will basically maintain the status quo, continue to impose higher corporate taxes, alleviate the deficit, but be bearish on the stock market from a fundamental perspective. At the same time, compared with Trump, Biden will retain greater independence for the Federal Reserve.
Trump advocates comprehensive tax cuts while increasing infrastructure spending. During his last term, effective corporate income taxes dropped significantly, while the deficit rate rose rapidly, further increasing pressure on U.S. debt. At the same time, the coordination between monetary and fiscal policies may increase, inflation risks will exist for a long time, and accelerate the depreciation of the U.S. dollar's credit.
3.2 Expectations of the Federal Reserve’s Rate Cut
Interest rate normalization depends on economic fundamentals (such as growth, employment and inflation) and financial conditions. Therefore, most of the market's expectations for the Fed's rate cuts are "prevention" rate cuts, judging whether a rate cut is needed by the strength or recession of the US economy, although this approach is often susceptible to the Fed's erratic expectation management.
So does the US economy need prevention? Judging from the current GDP data, the economy is stable, the possibility of recession is small, and the demand for preventive interest rate cuts has been postponed. The revised real GDP in the fourth quarter of 23 was 3.4% quarter-on-quarter, an increase of 0.2 percentage points from the previous quarter, and the actual personal consumption expenditure increased by 3.3% quarter-on-quarter, an increase of 0.3 percentage points. Consumption also continued to provide momentum for economic expansion. Even the GDP data before the revision was in a state of economic growth (GDP increased by 2.9% in Q4 2022). Although the GDP data for Q1 2024 was lowered to 1.6%, the main reason for the decline was the high growth of imports and the weakening of inventories, indicating that the current domestic demand in the United States is still stable, and there is a market situation where the internal economy is in short supply. As a result, major professional financial institutions have postponed their expectations for interest rate cuts. Goldman Sachs expects July, and Morgan Stanley also believes that after June, CICC predicts that the interest rate cut node will be postponed to Q4.
According to the latest pricing of CME interest rate futures, traders currently predict that the probability of a 25 basis point rate cut in July has dropped to 28.6%, a 25 basis point rate cut in September has reached 43.8%, and a 25 basis point rate cut in November has reached 43.6%. As a result, the market's expectations for rate cuts in September and November are close, but expectations for the first rate cuts in December and January of the following year are increasing.
Table 1: CME rate cut expectations distribution, as of April 29, 2024
However, the arrival of the interest rate cut window undoubtedly requires non-agricultural employment gap and weak inflation data as conditions, that is, the economy cools down, or financial conditions need to be tightened again. Uncertainty comes from the US election in November. First of all, the Fed's change in monetary policy before the election is suspected of affecting the election results. Therefore, the distribution range of changes in the federal funds rate in election years is smaller than that in non-election years, and the decision to cut interest rates in September will be more cautious. At the same time, it is not ruled out that some Fed officials maintain a "dovish preference" in order to maintain growth and employment, and support interest rate cuts when economic data is still resilient. But historically, the past 17 US elections and US monetary policy studies have shown that the probability of the Fed conducting a turnaround operation before the election (before November of the year) is low, and the probability of starting a turnaround operation in the short term after the election is relatively high. Only 2 times have there been changes from interest rate hikes to interest rate cuts within a year, and 4 times have there been turns in the federal funds rate or monetary policy immediately after the November election month.
In summary, the US economy has a steady domestic demand, and inflation is repetitive. Financial institutions generally postpone their forecasts of interest rate cuts to the second half of the year or even next year. CME data shows that the highest expectations for interest rate cuts are in September and November, but the probability of December and January of the following year is increasing. However, we still need to be aware that the sufficient condition for interest rate cuts is a poor economy, so there may still be a tightening of financial markets before the interest rate cut policy comes. At the same time, historically, interest rate policies and monetary policies (i.e., interest rate cuts in September) are usually more cautious before election months, and the possibility of a short-term shift after the election month is higher.
3.3 Fed’s Balance Sheet Reduction Cycle
Is expanding the balance sheet more effective than lowering interest rates?
At present, the market's attention is mostly focused on the expectation of interest rate cuts, but in fact, the direct impact of balance sheet expansion on market liquidity is greater than that of interest rate cuts. The above mentioned market liquidity indicator = Fed's debt scale - TGA - reverse repurchase scale. Balance sheet expansion means that the Fed expands its balance sheet, purchases assets such as Treasury bonds or mortgage-backed securities by means of liabilities to increase reserves in the banking system and currency in circulation, creates incremental money and directly expands market liquidity, so it is also called "printing money". Interest rate cuts, on the other hand, encourage companies and individuals to increase investment and consumption by reducing borrowing costs, and transfer funds to risk markets to improve liquidity.
When to change monetary policy?
The progress of balance sheet normalization depends on the supply and demand of reserves. According to the article "Scarce, Abundant, or Ample? A Time-Varying Model of the Reserve Demand Curve" published in 2022 by New York Fed President Williams and others: "The reserve demand curve is nonlinear. The adequacy is measured by the ratio of reserves to bank assets. 12% to 13% is the critical point between overabundance and moderate abundance, and 8% to 10% is the warning line for shortage." Financial market performance is often nonlinear, which has been reflected in the market. After approaching 13% in 2018, the reserve ratio quickly fell nonlinearly to 8%. When the Federal Reserve announced a slowdown in the balance sheet reduction, it had fallen back to 9.5%, and finally restarted the balance sheet expansion in October 2019.
Figure 10: Ratio of bank reserves to total assets of commercial banks
At present, the reserve ratio in the United States has reached 15%, which is still in an overabundant state. As liquidity tightens and the reverse repurchase scale is exhausted to zero, the reserve ratio will continue to decline. Institutions tend to predict that the balance sheet reduction will end at the beginning of next year. Goldman Sachs expects to start reducing QT in May and end the balance sheet reduction in Q1 2025. Morgan Stanley believes that when the reverse repurchase scale is close to zero, QT will be reduced and will be completely ended in early 2025. CICC predicts that it will reach the critical point in Q3. If the Fed slows down in advance in May, the critical value can be postponed to Q4. At the same time, historically, the Fed tends to turn the currency in the short term after the end of the US election month.
In summary, the Fed has signaled that it is considering slowing down its balance sheet reduction. The market generally predicts that it may slow down its balance sheet reduction in May or June, stop reducing its balance sheet at the beginning of next year and end QT, and then usher in a balance sheet expansion cycle. The current risk uncertainty still lies in the increase in the supply of US bonds, and the scale of reverse repurchase is close to zero, which has caused large fluctuations in the US Treasury market. Especially in the election year, economic stability is particularly important. The Fed may stop reducing its balance sheet in advance and advance the schedule of expanding its balance sheet to avoid the recurrence of the 2019 "repurchase crisis" in the market.
IV. Conclusion
Gold and the US dollar have both shown an upward trend recently. In addition to sudden geopolitical factors, we should pay attention to the trend of some central banks selling US bonds and increasing their holdings of gold, suggesting that de-dollarization is occurring locally.
In the short term, the increase in TGA balance and the Fed's expectation of easing balance sheet reduction will partially offset the liquidity tightening caused by the issuance of US Treasury bonds. In addition, attention should be paid to the total amount of refinancing and the ratio of short-term and long-term bonds in the second quarter. In the medium and long term, the imbalance between supply and demand of US Treasury bonds has not been cured. Due to the rising deficit ratio and the bill to stop the suspension of the ceiling next year, there will still be a large demand for US Treasury issuance in 2024. The scale of reverse repurchase will maintain a downward trend, and attention should be paid to the trend of TGA balance and the nonlinear decline of bank reserve ratio.
The US economy has a stable domestic demand but inflation is repetitive, and the expectation of interest rate cuts is generally postponed to the end of the year. The expectation of stopping balance sheet reduction remains at the beginning of next year for the time being. Combined with history, monetary policy tends to remain vigilant before the US election, and the probability of a short-term shift after the election is relatively high.


