
Meme coin value measurement: financial and social dual indicators
Original author: Andrew Hong
Original translation: TechFlow
Meme coins emerge with every market cycle. A group of people rally around a meme and temporarily drive up the price of an asset (from a day to a few months). This has become a popular market strategy in the cryptocurrency space, covering everything from the blockchain layer to the application layer - because it not only drives up the price, but also draws attention to the ecosystem. Some projects, such as Avalanche, have even gone a step further and created dedicated meme coin funds.
The line between meme coins and other tokens can sometimes blur, but the general assumption here is that there is nothing backing the token other than the meme. For example, DOGE as a token is really only backed by the image/concept of the Shiba Inu doge. Unlike the ETH token which is secured by the Ethereum blockchain, the UNI token which has the full Uniswap protocol behind it, or the MKR token which has a full collateral stablecoin service.
Farcaster's Meme Coins (like DEGEN) are the latest style, and their main advantage is that the social aspect is completely open. Therefore, I wanted to test the social and financial data with some basic analysis.
Measuring Memes
I started with the hypothesis that we could compare the social and financial health of all meme coins with a simple chart:
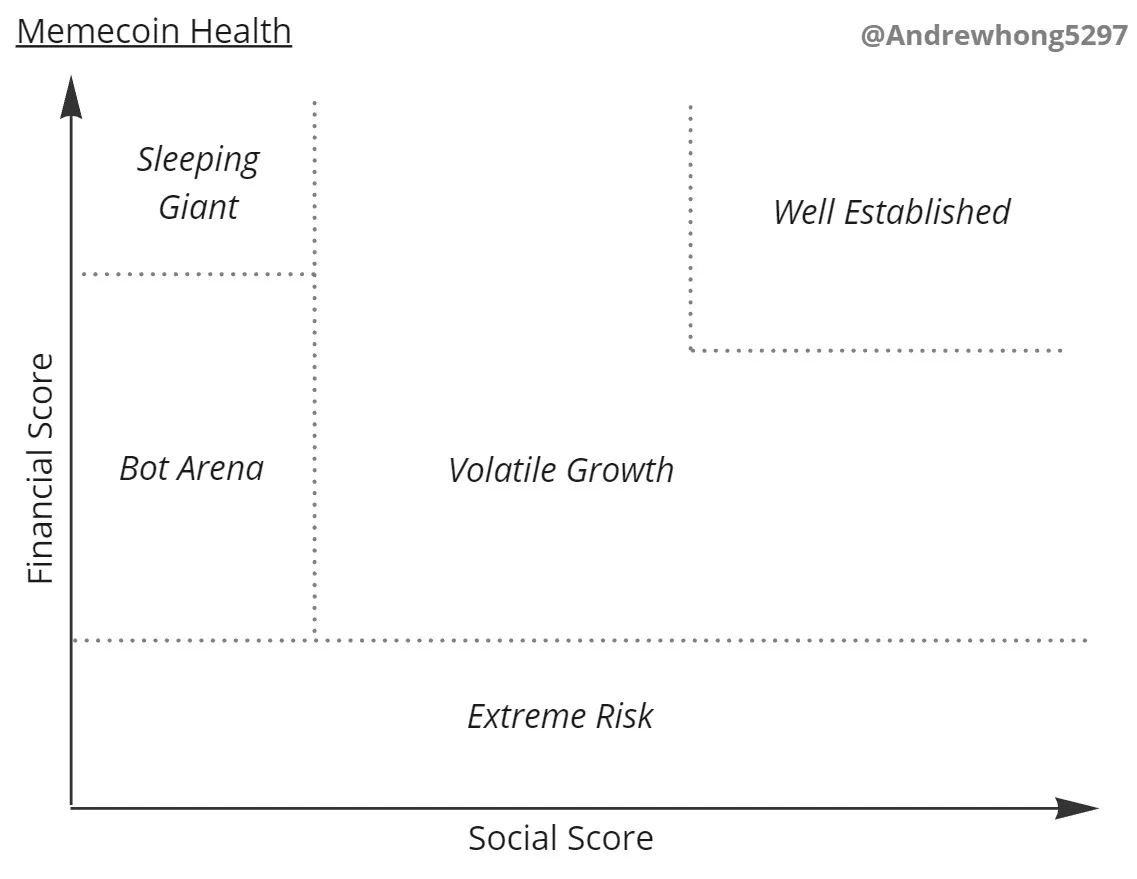
I have categorized five main areas in this chart:
Extreme Risk : Meme coins with low liquidity and trading volume are very risky and prone to sell-offs (because there may be only a few people providing liquidity)
Bot Arena : Most meme coins never make it out of this phase, where thousands of coins (many with the same token name/variants) compete for social and financial attention
Volatile Growth : Meme coins that break out of their initial circle now have to maintain their momentum and growth. You might see prices fluctuate 100-500% in a day, all in different directions, and a bunch of influencers start paying attention to this meme.
Well Established : Leaders will be at the top socially and financially for a long time and clearly differentiated from other meme coins. Week to week numbers may not fluctuate much, and attention is constant as people flow in and out of a balance.
Sleeping Giants : Meme coins that grew quickly socially and financially, but didn’t suffer a sell-off, may languish in this corner for a while. A DAO may have been formed, and they started and dealt with the community chaos. In the meantime, they hope to be in the spotlight again.
Most meme coins should be stuck in the "bot arena", with a few attractive meme coins in the "volatility growth" segment and maybe one or two reaching "established". In the process, some may lose social power and become "sleeping giants", while others may lose financial support (liquidity) and become "very high risk".
I believe that a successful meme coin will typically go through the following stages:
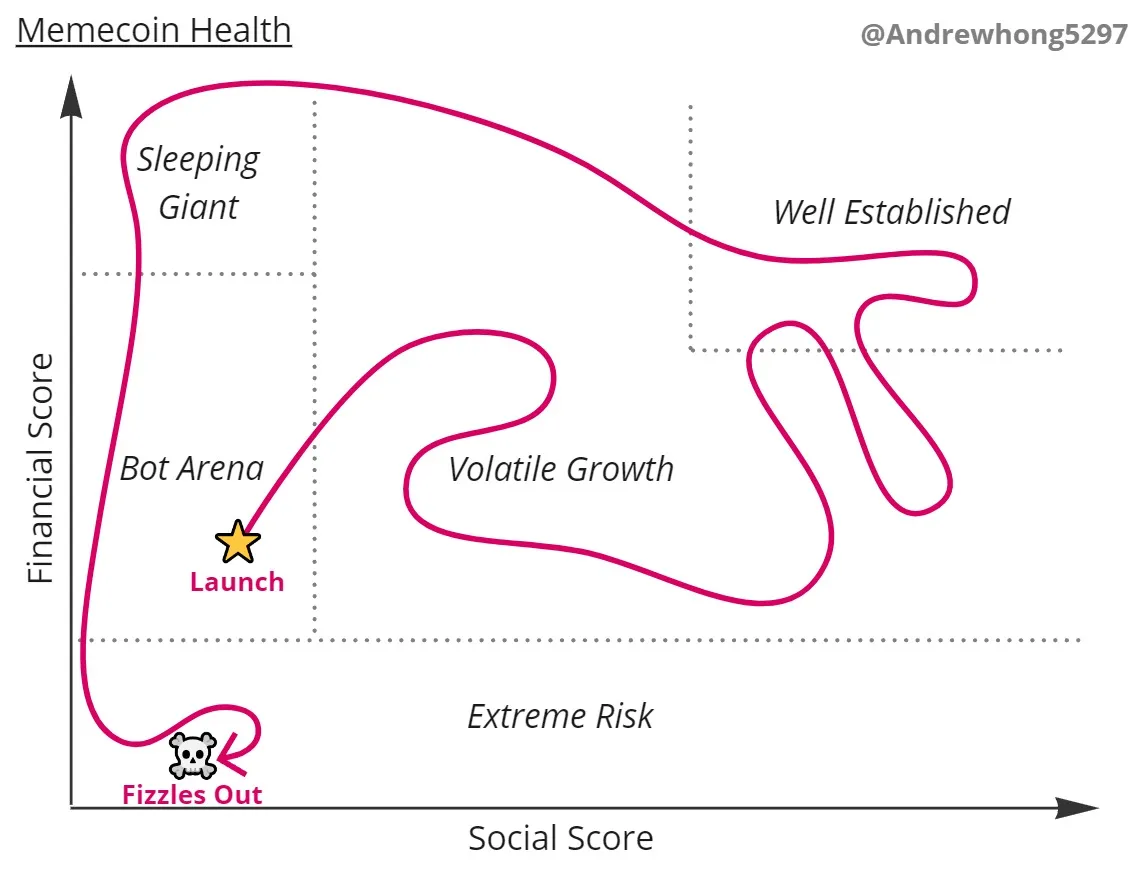
You may see many MemeCoins being pushed by bots/influencers resulting in high social scores but low financial scores (liquidity), leading to sell-offs.
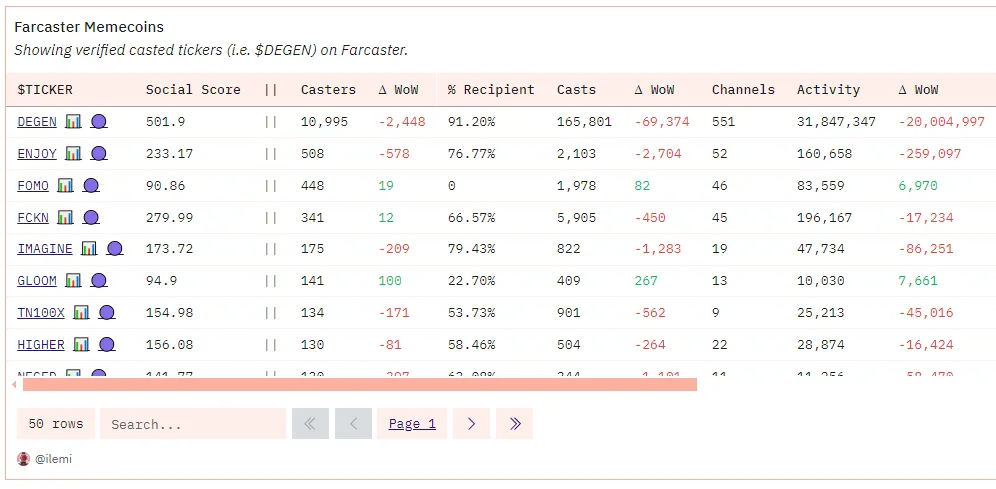
After a lot of data engineering and cleaning, I was able to produce this chart of the FarcasterMeme coin on Dune:
In fact, this is pretty much in line with what I expected, you can see DEGEN is far in the upper right corner, and then there are a few others like ENJOY, HIGHER, TN 10 0X, and EVERY in the middle. Everyone else is stuck on the left, competing for attention and liquidity.
It’s worth noting that I haven’t filtered out alts/bots here, so the social scores of some meme coins may be skewed. This is something that we can improve in the future!
Now, let’s work backwards from the final graph to explain how these two scores were created. I will also pose further research questions and detail the origins of my inquiry for those who wish to dig deeper.
Dune’s dashboard can be found here , along with a few charts I didn’t cover in this post.
Social Score
Each score is made up of a "base" component and a "growth" component. For the social score, we first measured casts (posts) and engagement for the coin mentions. So in this approach, "$DEGEN" counts, but "DEGEN" does not.
The above provides our five main columns:
Throwers: The number of people who have thrown a given code
Receivers: The percentage of senders who have previously received the token
Number of throws: The number of times a given code is thrown
Channel: The number of channels that have made a given code throw
Activity level: Engagement (likes + replies) plus the number of throws multiplied by the cube root of the number of channels.
Activity level: Engagement (likes + replies) plus the number of casts times the cube root of the caster times the cube root of the channel.
The overall social score is a "base" of activity levels, and a "growth" multiplier based on the week-to-week change in the amount of tokens being cast by both casters and recipients. The idea here is that if you see a big growth in the number of people casting a given token and the number of those people buying/acquiring tokens, that's an extremely healthy sign.
Overall, it looks like this in a table:
Financial Rating
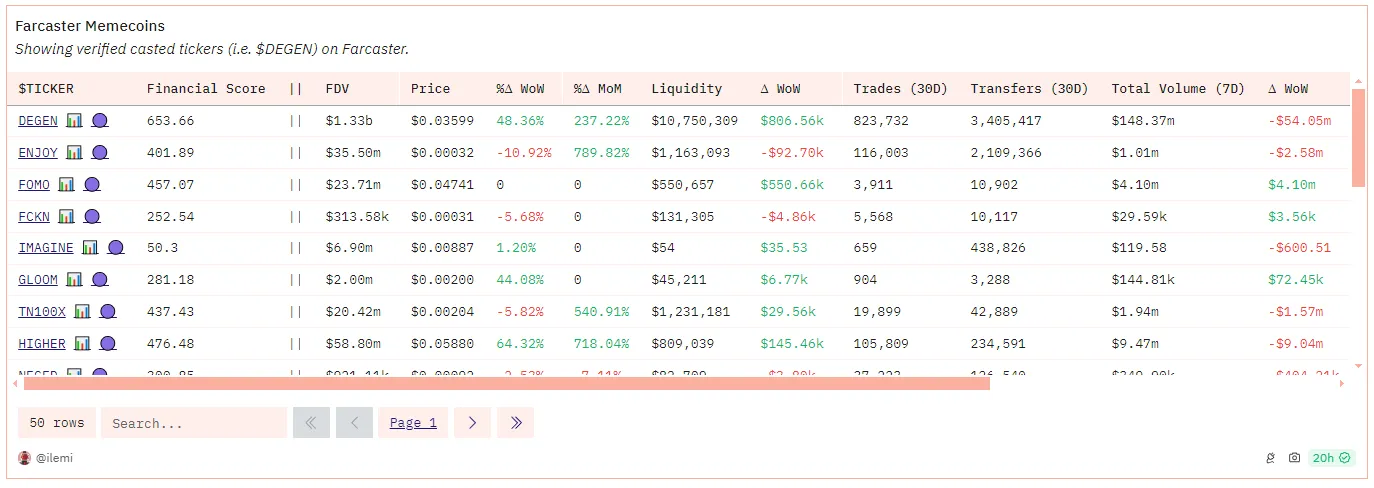
The following are the main financial indicators:
Fully Diluted Value (FDV): Total Supply multiplied by Price
Price: Latest price based on DEX transactions
Daily, Weekly, Monthly Price Change: The percentage change in price on a daily, weekly, and monthly basis
Liquidity: This is non-token liquidity, meaning that for the DEGEN-WETH pool, we only count the WETH portion of it. This gives us a more stable indication of how much good liquidity there is for a given token.
Transactions: Number of DEX transactions in the past 30 days
Transfers: Number of ERC 20 transfers in the past 30 days
Total volume: USD volume of DEX transactions over the past 7 days
The “foundation” of the financial score is its non-token liquidity and DEX trading volume, and the “growth” part is based on the week-over-week change in liquidity.
Overall, it looks like this in a table:
Follow-up Questions
Here are some brainstorming questions I’d like to see people explore further from here:
How to score throwers as alts/bots? Weighted by the value of tokens in the wallet? Grade throwers based on relationship to known clusters and/or communities?
Categorize the fluctuations in social and financial growth - how are they related? Is there a time lag or one-way dependency?
Are the same circles/types of people driving the initial wave of growth? What about early, early, and late meme adopters? Does it matter with user tiers?
What happens when a meme "transforms"? What or who drives this transformation?
How big is one's social or financial interest? Do people throw more/less at a certain token after buying/selling it?
What is the average lifespan of a meme? Socially and financially?


