
The first lesson in on-chain data analysis: Which tools are easiest for newcomers to use in the bull market?
Original|Odaily
Author|jk

Foreword: Data on the chain
Readers who are familiar with traditional financial markets know that there are various trading styles in financial markets. Traditional markets mainly use fundamental analysis and technical analysis, in addition to other methods such as algorithmic trading.Technical analysis mainly analyzes price charts through indicators and trends, and is basically the interpretation of price data. Fundamental analysis is a method of evaluating the intrinsic value of a security by analyzing relevant economic, financial and other quantitative and qualitative factors to predict its future market performance.
However, in the cryptocurrency space, a different approach to analysis has emerged – on-chain analysis. This is because unlike the closed systems of traditional financial markets, blockchain technology makes financial data open to everyone, allowing people to clearly see two core information:Ownership of Transactions and Tokens.
On-chain data, as the name suggests, is data that exists on the blockchain and tells us information about the flow and ownership of funds, i.e. where tokens flow from to where, what is purchased, and which tokens are owned by each address. How much to own.
This kind of data is not common in traditional financial markets. It is impossible for ordinary people to know how many stocks and funds the counterparty of buying and selling stocks has. therefore,On-chain analytics provides cryptocurrency market participants with a new perspective and analytical tools. Unlike technical analysis that only focuses on price data, on-chain analysis allows us to gain an in-depth understanding of the basic operating mechanisms of the market, such as trading behavior and asset distribution, thus providing a more comprehensive and in-depth basis for trading and investment decisions.
Getting started: What information is on the chain?
The information on the chain is rich and detailed, and it reveals to us the data dimensions and structure unique to the cryptocurrency market, thus contrasting with the availability and type of information in the traditional financial (TradFi) market. Data on the chain mainly consists of the following aspects:
Wallet holdings: The blockchain records the token holdings of each address or wallet, allowing us to track the asset size and changes of individuals or institutions.
transaction analysis: Every transaction is recorded on the blockchain, including both parties to the transaction, transaction amount, timestamp, etc., providing a basis for analyzing market dynamics and participant behavior.
Token owners: By analyzing on-chain data, the major holders of any token can be easily identified to assess market concentration and potential price manipulation risks.
Exchange inflows and outflows: Monitoring the flow of funds in and out of exchanges can reveal market participants’ possible selling intentions or their decisions to withdraw assets from exchanges for long-term holding or use on-chain.(Exchanges themselves often use multiple addresses to store funds, and there is a lot of off-chain accounting behavior, so transactions within the exchange are often agnostic.)
Macro/ecosystem level data: On-chain data provides a perspective to observe the overall behavior of the market and can analyze the collective actions of many market participants, such as network activities, mining dynamics, and the interaction of DeFi (decentralized finance) protocols, etc.
In contrast, information in traditional financial markets is usually more closed and limited. For example, while public market stock trading data is available for analysis, the details of private equity funds, derivatives contracts, and many other transactions are often unknown to the outside world. In addition, many data sources in traditional finance, such as credit scores, internal transaction reports, etc., are subject to strict supervision and control.
For example, inArkhamOn , you can view position analysis provided by on-chain analysts, including the positions of top private equity funds and institutions, which can reveal which entities have been bullish on which assets in the past and present. a16z’s positions are as follows:
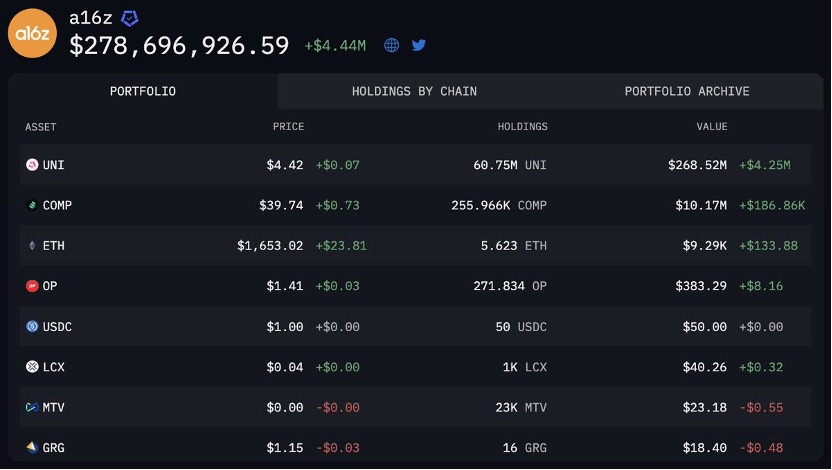
a16z position status. Source: Arkham official Twitter
Similarly, in the use case officially released by Arkham, you can even view historical positions and buying and selling records, and this information shows how the accounts positions have evolved over time. This analysis is of great value in understanding the behavioral patterns and investment strategies of market participants.
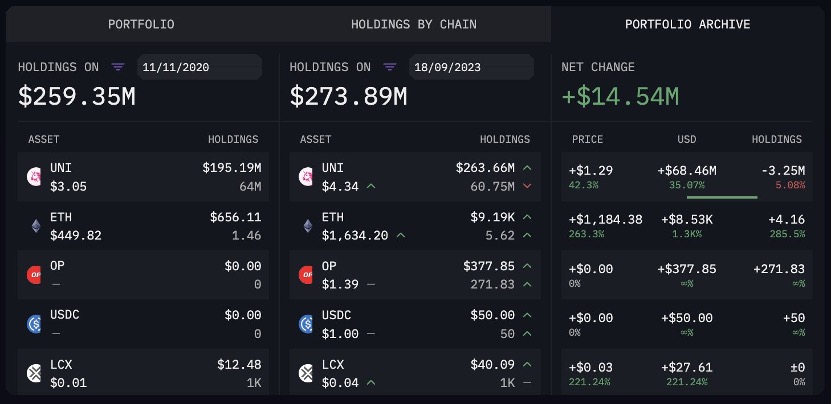
Historical position records. Source: Arkham official Twitter
In summary, the transparency and comprehensiveness of on-chain data provides a new dimension of analysis to the cryptocurrency market that is difficult to find in traditional financial markets. This openness of data not only promotes market transparency but also provides investors and analysts with unique tools to gain insights into market dynamics.
Advanced: On-chain analysis tools
Although the blockchain data itself is open and transparent, it is not easy for ordinary people to truly understand and utilize this data. The complexity and sheer volume of blockchain data means that interpreting this information is nearly impossible without the right tools and skills. Raw blockchain data requires initial access through a professional block explorer, but even then, extracting valuable insights from this data requires certain data analysis or data science skills.
Most traders or retail users do not have this expertise, so they rely on specialized tools or services to help them interpret the data and make more informed trading and investment decisions. There are some excellent free tools on the market that can help with on-chain analysis. They provide user-friendly interfaces and powerful data analysis functions, making it easy for ordinary users to obtain and understand blockchain data. Here are some free on-chain analysis tools:
Arkham: Provides a series of advanced on-chain analysis functions to help users track capital flows and identify market trends. During this Bitcoin ETF craze, Arkham identified and recorded the number, proportion, and inflows and outflows of Bitcoin held by major ETFs, thus providing a good perspective for price prediction.
DeFiIlama: Focus on the data of decentralized finance (DeFi) projects, providing users with comprehensive analysis of DeFi assets and protocols. Basically, famous DeFi protocols and projects can be queried on this website, which is very useful for the analysis of data indicators.
Dune: Allowing users to deeply analyze on-chain data through custom queries and visualizations, it is the preferred tool for data scientists and analysts.
Etherscan: As the main block browser of the Ethereum blockchain, it provides basic functions such as transaction query, smart contract analysis, and real-time gas fees. For other public chains, basically searching for public chain name + explorer will show the browser of that chain, and the functions are basically the same.
These tools lower the threshold for users to conduct on-chain analysis by simplifying the data access and analysis process, allowing even users without technical background to gain insight into market dynamics and trends, thereby making more informed decisions in the cryptocurrency market.
Practical operation: using on-chain data to guide transactions
Common strategies for using on-chain analytics to guide trading and investment strategies include a variety of methods and use cases that enable investors to better understand market dynamics, discover potential investment opportunities, and avoid risks. Here are some specific strategies and application scenarios:
Track and copy the strategies of elite traders: Through on-chain data, investors can track the trading behavior of successful traders or so-called elite traders, learn their investment strategies, and even directly imitate their trading actions. This includes not only copying their buying and selling operations, but also setting up alerts to be notified of future activity from these traders. This approach allows ordinary investors to leverage the knowledge and intuition of high-level investors to gain an advantage in their own trading.
Analyze the top holders of a specific coin: Observing and analyzing the major holders of a specific token, especially those “whale” accounts, can help investors understand whether the token supply is highly concentrated. For newly launched tokens, if a large number of tokens are concentrated in the hands of a few people, this may indicate the potential for coordinated selling, which can quickly push the token price down. By identifying these potential risks, investors can make investment decisions more carefully and avoid entering markets that may be subject to manipulation.
These strategies demonstrate how on-chain analytics can provide traders and investors with unique perspectives and data support, allowing them to make more informed decisions based on comprehensive and in-depth market insights. Using on-chain data, investors can not only identify market trends and potential investment opportunities, but also gain insight into the behaviors and intentions of other market participants, thereby occupying a favorable position in the highly competitive cryptocurrency market.
For example, according to the example officially released by Arkham, taking trader 0x456 as an example,He turned 1 Ethereum into $550,000 in less than 3 weeks, achieving a 27,500% return.By in-depth analysis of his on-chain transaction records, we can discover a lot of detailed information. 0x456 has demonstrated a highly dynamic and opportunity-driven trading strategy, starting with 1 ETH to over $550,000 in assets today. His success story includes several key steps:
Small and fast transactions:0x456 started out by making relatively small buys on tokens like BONK, CLIPPY, and ZUZU, and holding them for just a few minutes, which helped him gradually build up a small fund. This rapid buying and selling strategy allowed him to gradually increase his capital without taking on large position risks.
Invest boldly: As funds increased, 0x456 began to make bolder investments. His first notable success came with the MORRA token, which he invested in at the time of its launch and gradually sold it over the next week, realizing a 17x profit. This demonstrates his keen insight into market dynamics and his ability to seize potential profit opportunities in the early stages of listing.
Use market information: Just two days later, he invested in the P3PE token, which was mentioned in an exchange of messages between the Euler attacker and the KyberSwap hacker. 0x456 invested 3 ETH two hours after the news was published and profited as the news spread on crypto Twitter, achieving a 16x gain. This highlights the importance of trading on market sentiment and information differences.
Give it a try: His largest trade occurred 5 days later, when he invested $6,600 in GEC tokens when they were listed. So far, he has not sold any GEC tokens, which are worth over $200,000.
diversified trading: Overall, 0x456 traded over 300 token pairs, showing his broad and diverse trading strategy. His success was built not just on speculation on a single event, but by diversifying his investments broadly and taking advantage of multiple market opportunities.
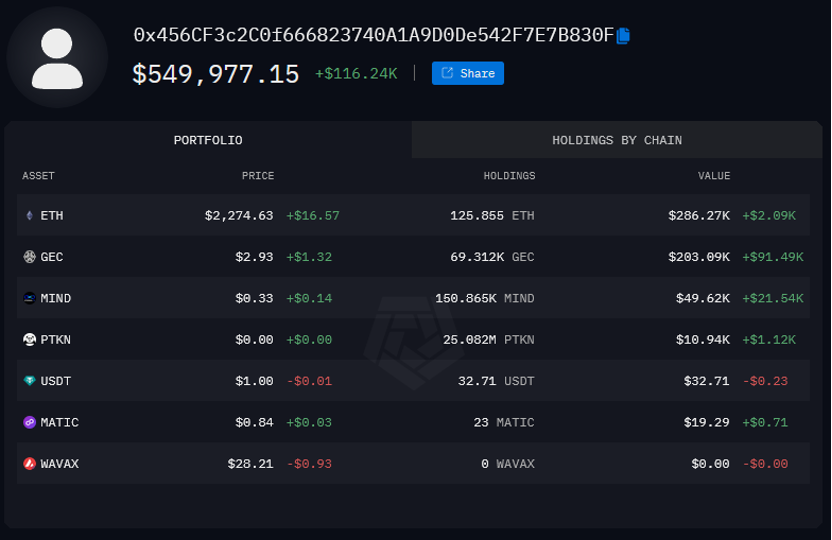
The position status of 0x456. Source: Arkham official Twitter
Imagine if you could use these tools to discover these smart addresses very early on and copy every transaction they make? Each of these transactions is visible on the blockchain, thus emphasizing analysts’ ability to gather information.
Summary: Long-term characteristics of on-chain data
Blockchain technology provides us with real-time, reliable access to transaction data that far exceeds traditional financial markets. Thanks to the rapid development of blockchain intelligence tools, leveraging this data has never been easier, giving market players a significant competitive advantage. As more people begin to realize this, this new paradigm will fundamentally change how financial data is used.
We are in the early stages of this transformation. The use of blockchain and on-chain data is gradually becoming an important watershed in the financial field. It not only changes the way we obtain and analyze market data, but also provides new dimensions and depth for trading and investment decisions. With the advancement of technology and the deepening of its application, we can foresee that the ability to utilize on-chain data will become a basic skill for financial market participants, just as important as technical analysis and fundamental analysis today.
In this ever-evolving blockchain financial world, the ability to master and apply on-chain analysis can not only help investors capture more opportunities, but also greatly improve their understanding and prediction capabilities of market dynamics. , and ultimately occupy a favorable position in the financial market. We are at a new starting point, the possibilities for the future are endless, and now is the perfect time to explore and take advantage of these new tools.
Odaily will also combine the above tools in the future to conduct practical demonstrations of data analysis and judgment on current hot topics or specific investment targets, so stay tuned.


