
Crypto Market Sentiment Research Report (2024.03.08-03.15): MicroStrategy's Bitcoin holdings hit a record high, but the current bull market has not been mutually confirmed
According to information disclosed on the SEC’s official website, MicroStrategy increased its position in Bitcoin between February 26 and March 10. The total purchase amount reached US$821.7 million, purchasing 12,000 Bitcoins at an average price of US$68,477. As of March 10, MicroStrategy and its subsidiaries held a total of approximately 205,000 Bitcoins, with a total purchase price of $6.81 billion, and an average purchase price of $33,706 per Bitcoin. Bitcoin broke through an all-time high of $69,000 on March 11, reaching a peak of $73,777.
However, it should be noted that the confirmation of a big bull market usually requires the prices of multiple currencies to verify each other, and currently ETH, BNB, and SOL, which have the largest market capitalization, have not reached all-time highs. Additionally, Bitcoin fell back below $69,000 after hitting a new all-time high. This shows that the current market is likely to be an overheated market for Bitcoin, and the real bull market may not arrive as scheduled in a short period of time. Therefore, investors need to have more patience and strategies to deal with the uncertainty and fluctuations before the big bull market arrives. On the other hand, now is a window of time for investors who intend to enter the crypto market to plan their investment portfolios and strategic allocations. When making investment decisions, it is recommended to comprehensively consider multiple price factors and pay close attention to market developments and dynamics, so that you can better grasp investment opportunities and make wise trading decisions.
The Bitcoin halving is about 38 days away from today (2024.03.15)
Countdown to halving:https://www.nicehash.com/countdown/btc-halving-2024-05-10-12-00?_360safeparam=1289146171
Market technical and emotional environment analysis
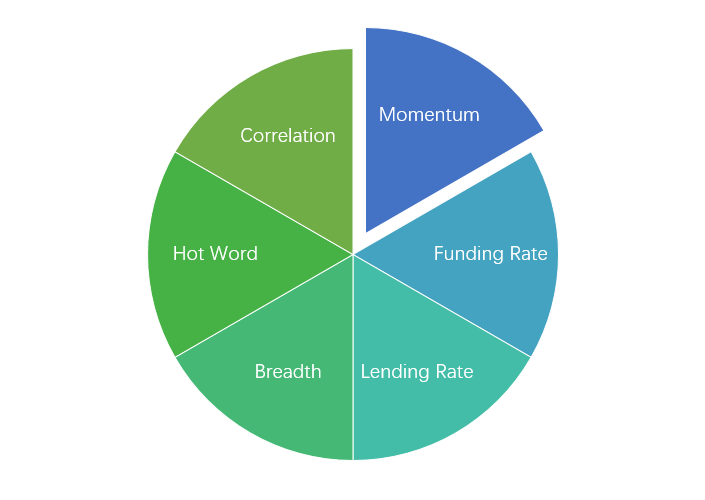
Sentiment analysis components
Technical indicators
Price trend
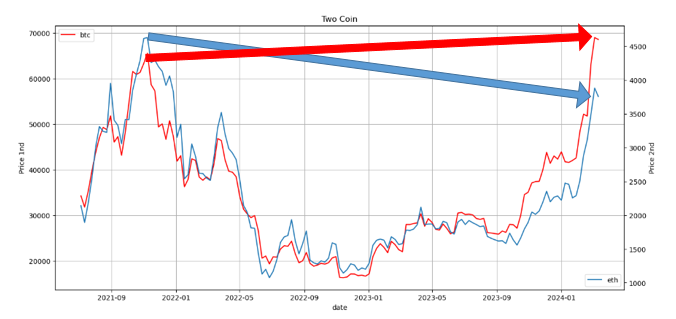
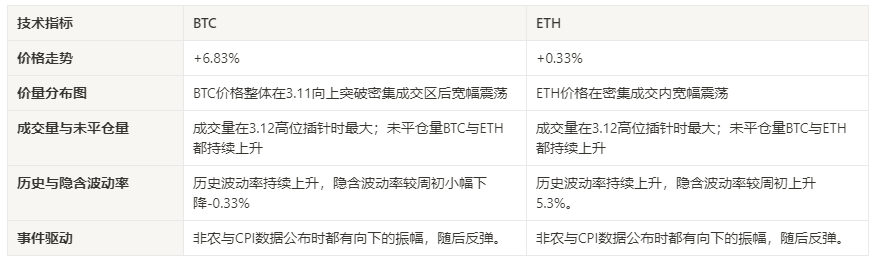
BTC price increased by 6.83% and ETH price increased by 0.33% in the past week.
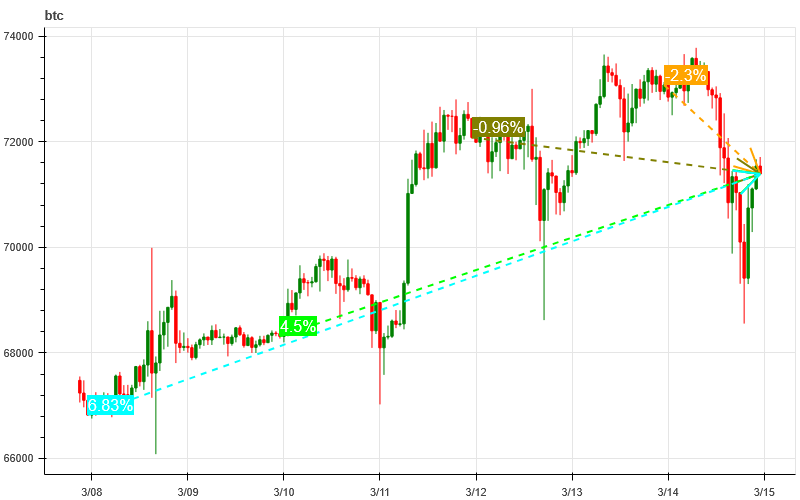
The picture above is the price chart of BTC over the past week
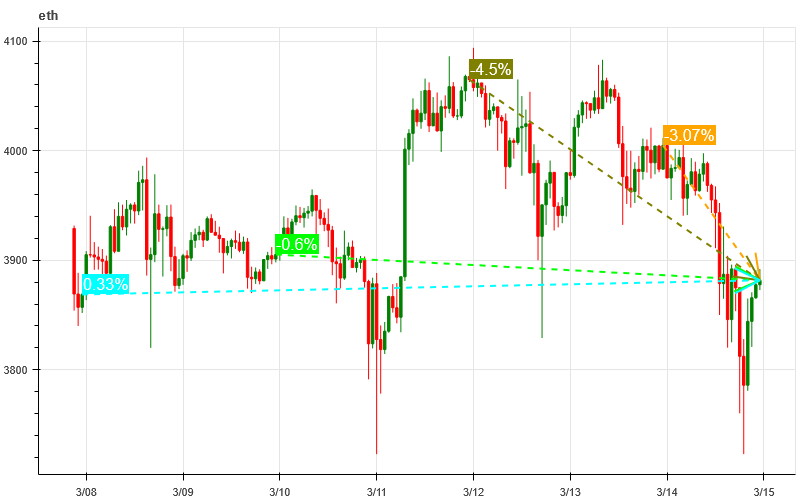
The picture above is the price chart of ETH over the past week
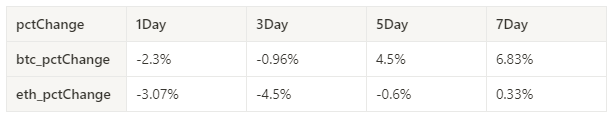
Table showing the rate of price change over the past week
Price and volume distribution chart (support and resistance)
In the past week, the BTC price as a whole fluctuated widely after breaking through the intensive trading area at 3.11, and the ETH price fluctuated widely within the intensive trading area.
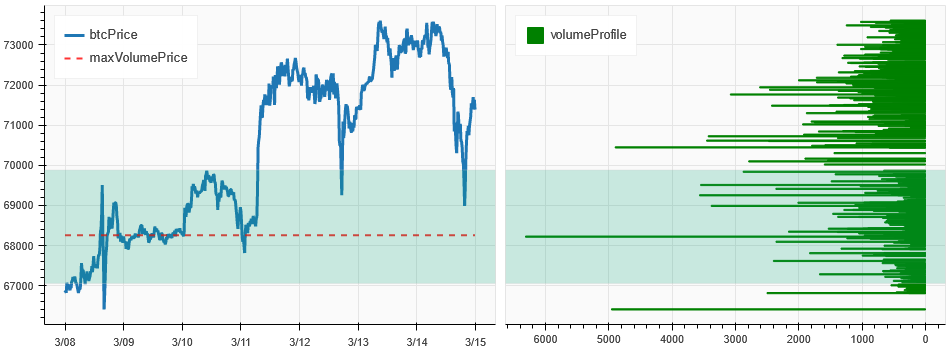
The picture above is the distribution map of BTC’s intensive trading areas in the past week.
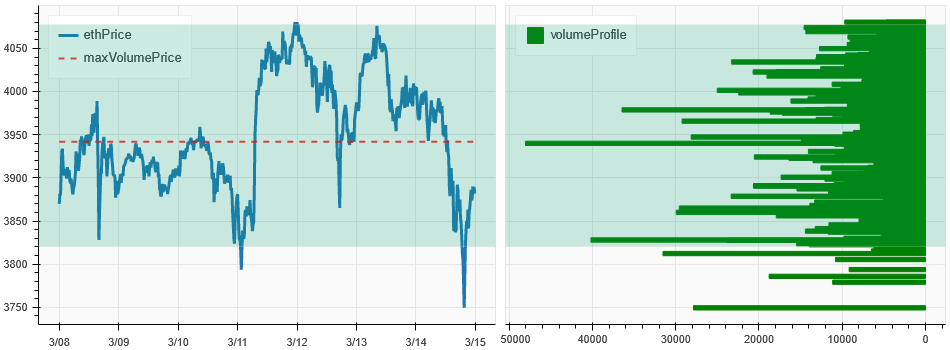
The picture above is the distribution map of ETH’s intensive trading areas in the past week.
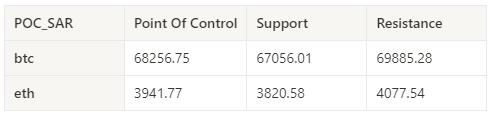
Table showing the intensive weekly trading ranges for BTC and ETH over the past week
Volume and Open Interest
In the past week, the trading volume of BTC and ETH was the largest when the pin was pinned at the high of 3.12; the open interest of both BTC and ETH continued to rise.
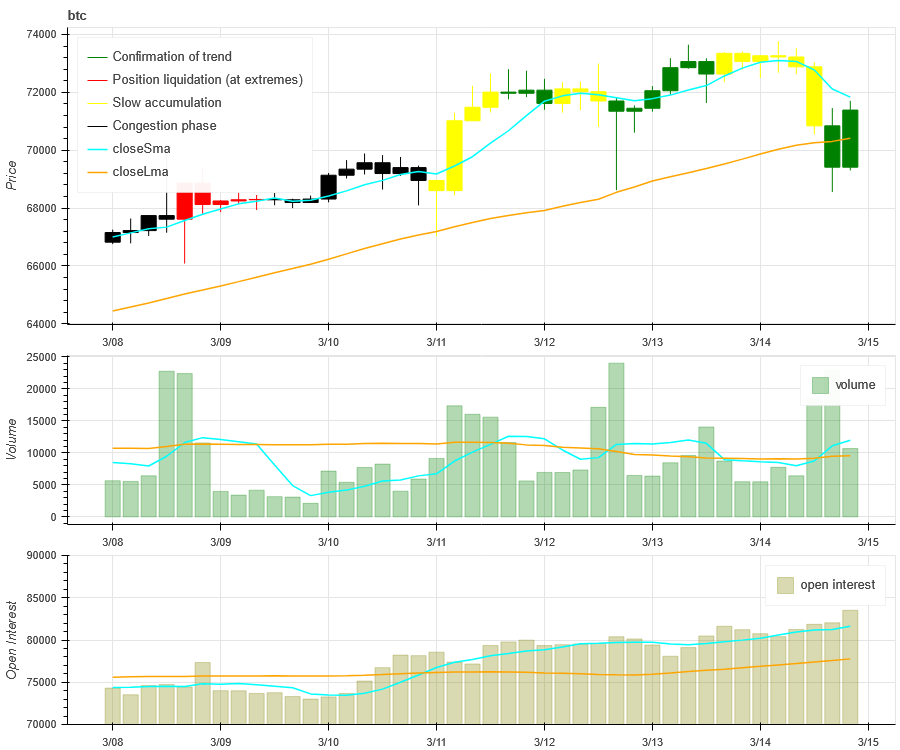
The price trend of BTC at the top of the picture above, the middle is the trading volume, the bottom is the open interest, the light blue is the 1-day average, and the orange is the 7-day average. The color of the K line represents the current status. Green means that the price rise is supported by trading volume, red means positions are being closed, yellow means positions are slowly accumulating, and black means congestion.
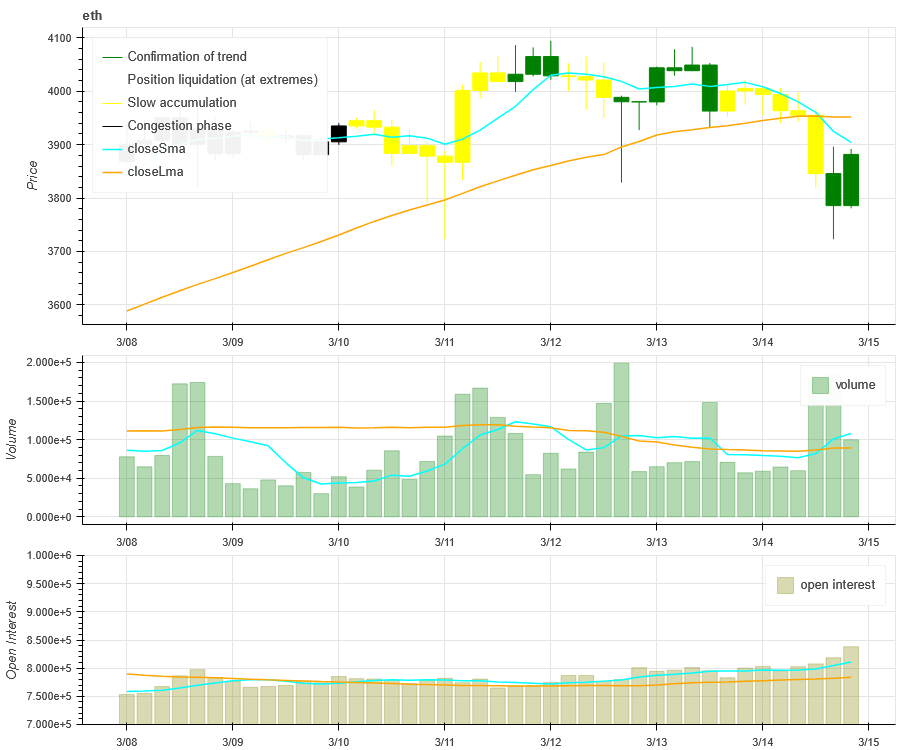
The price trend of ETH at the top of the picture above, the middle is the trading volume, the bottom is the open interest, the light blue is the 1-day average, and the orange is the 7-day average. The color of the K line represents the current status. Green means that the price rise is supported by trading volume, red means positions are being closed, yellow means positions are slowly accumulating, and black means congestion.
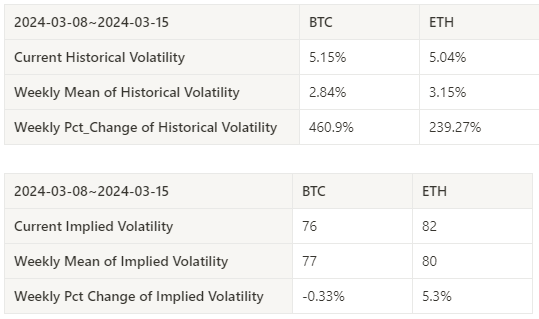
Historical Volatility vs. Implied Volatility
The historical volatility of BTC and ETH has continued to rise in the past week; the implied volatility of BTC fell slightly by -0.33% from the beginning of the week, while ETH increased by 5.3% from the beginning of the week.
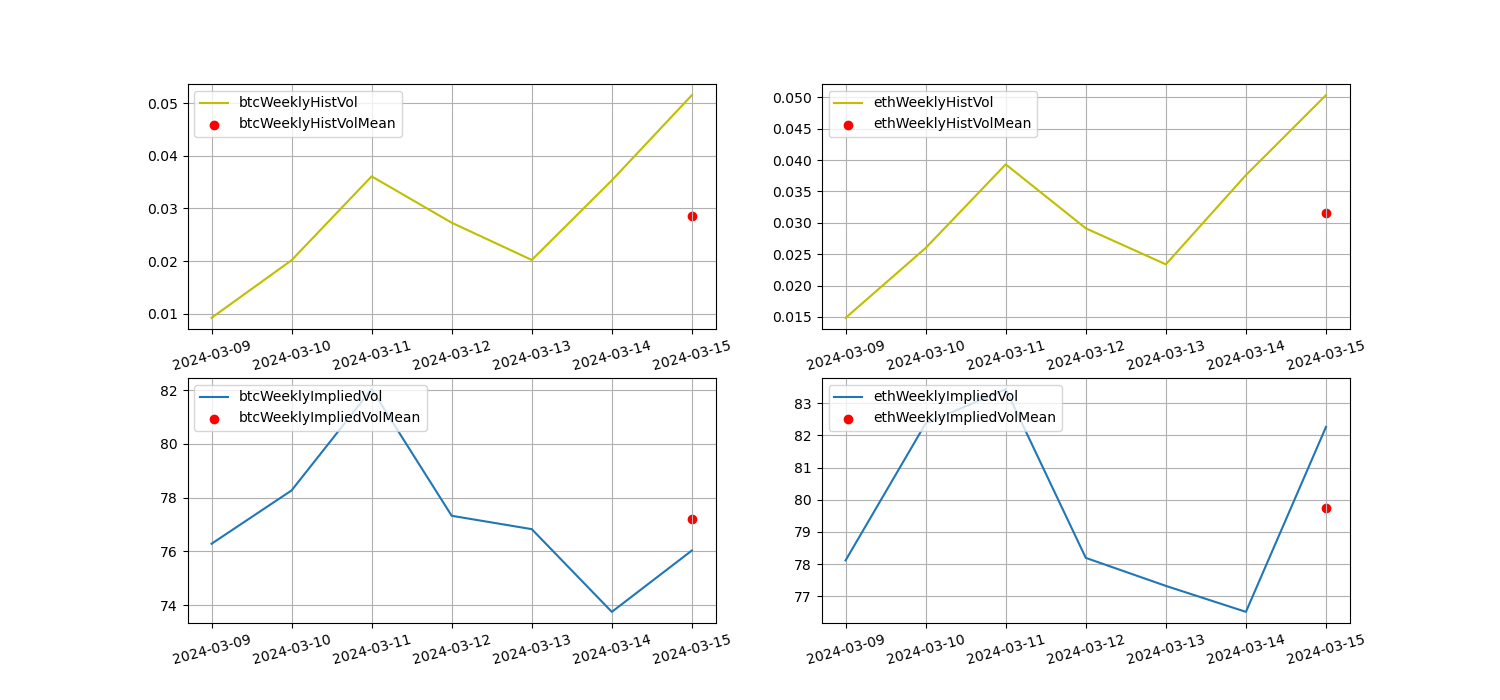
The yellow line is historical volatility, the blue line is implied volatility, and the red dot is its 7-day average
event driven
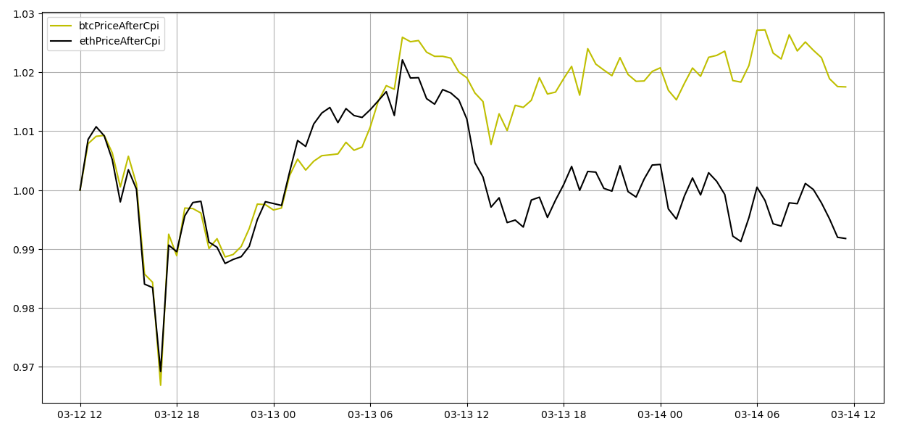
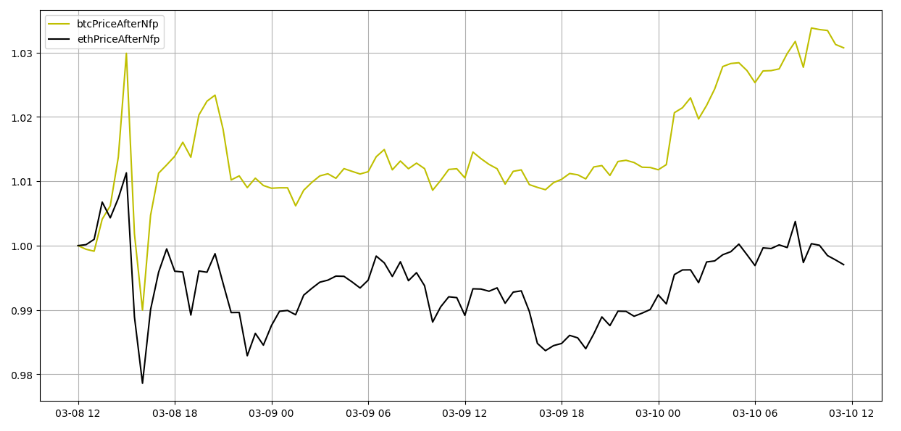
This weeks non-agricultural data was released at 21:30 on March 8, 2024, while the CPI was released at 21:30 on March 12, 2024. Both data had downward amplitudes when they were released, and then rebounded.
Price trends after the release of non-agricultural data
Price trends after CPI data release
sentiment indicator
momentum sentiment
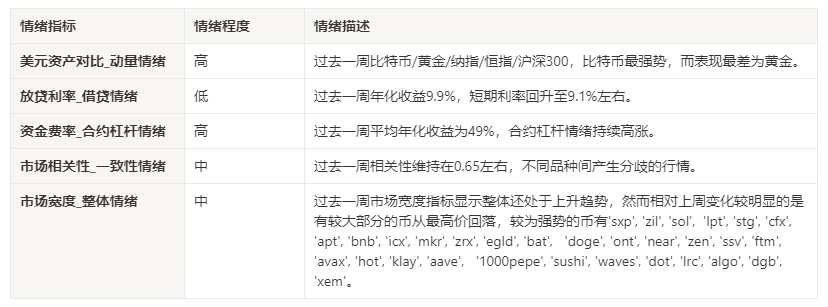
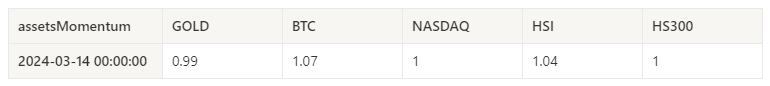
Among Bitcoin/Gold/Nasdaq/HSI/CSI 300 over the past week, Bitcoin was the strongest, while gold was the worst performer.
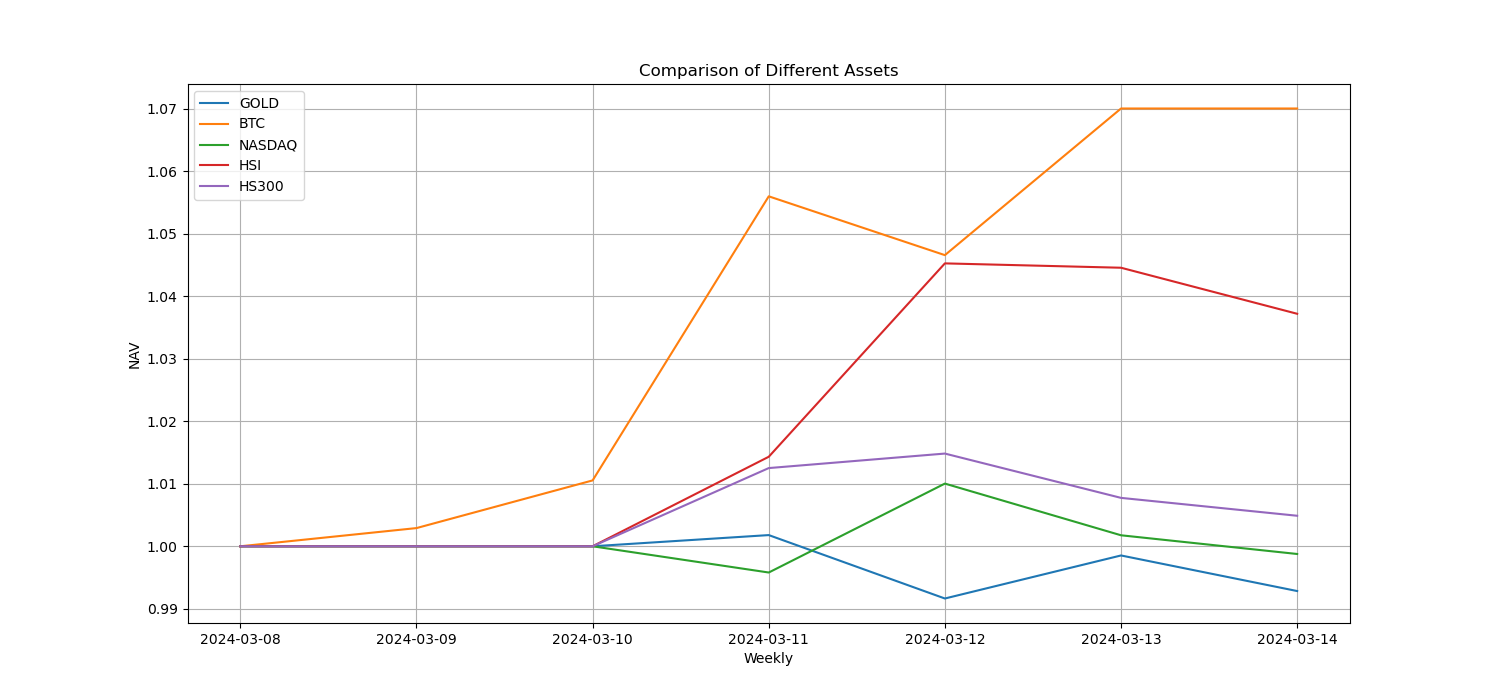
The picture above shows the trends of different assets over the past week.
Lending interest rate_Lending sentiment
The annualized return on USD lending averaged 9.9% in the past week, and short-term interest rates rose back to around 9.1%.
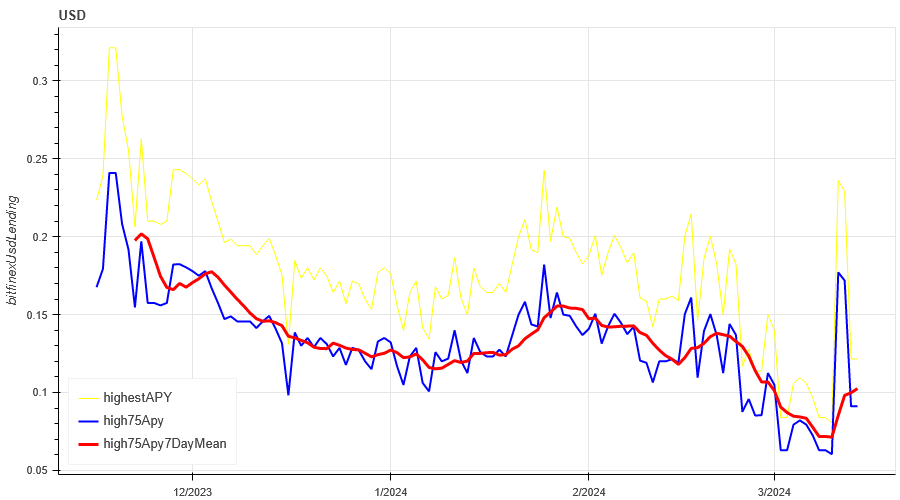
The yellow line is the highest price of the USD interest rate, the blue line is 75% of the highest price, and the red line is the 7-day average of 75% of the highest price
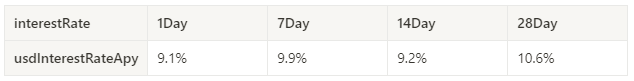
The table shows the average return of USD interest rate for different holding days in the past
Funding Rate_Contract Leverage Sentiment
The average annualized return on BTC rates in the past week was 49%, and contract leverage sentiment continues to be high.
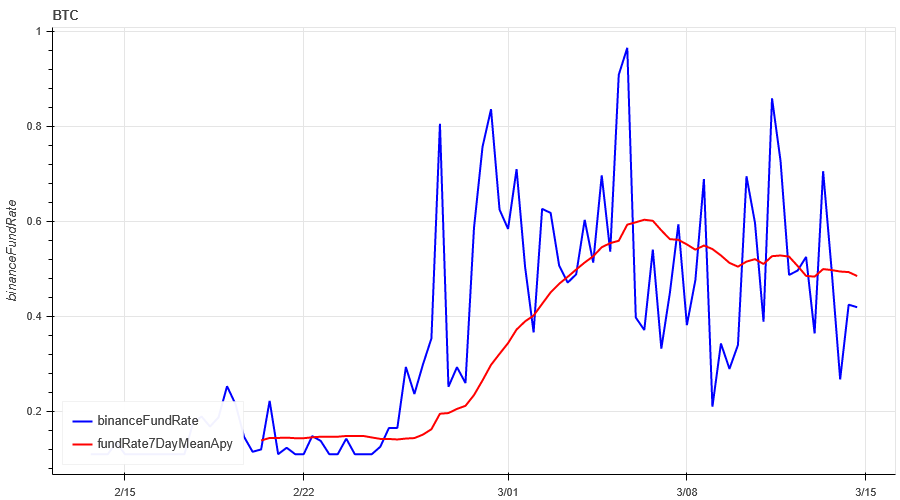
The blue line is the funding rate of BTC on Binance, and the red line is its 7-day average
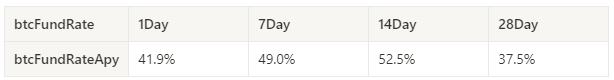
The table shows the average return of BTC fees for different holding days in the past
Market Correlation_Consistent Sentiment
Among the 129 coins selected in the past week, the correlation remained at around 0.65, resulting in divergent prices among different varieties.
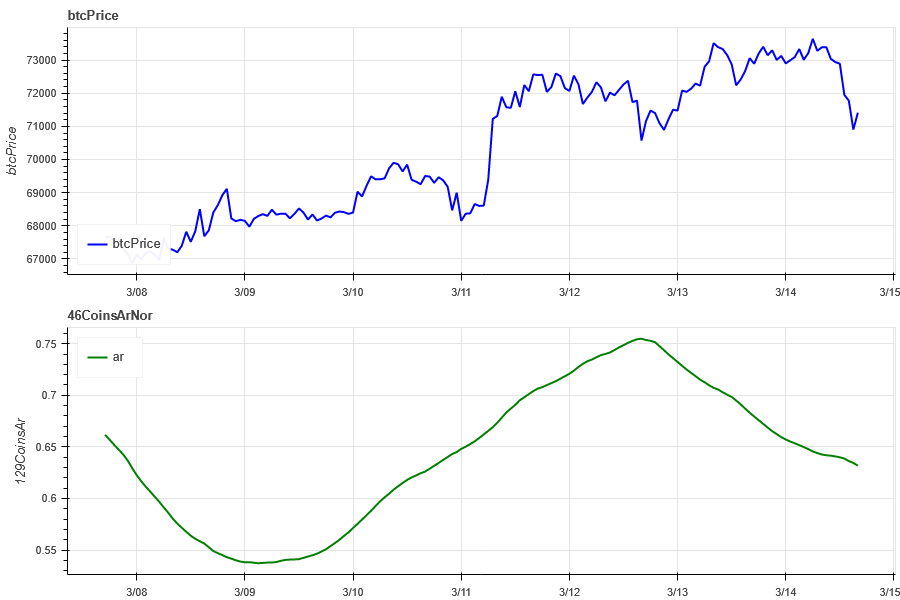
The blue line in the above picture first shows the Bitcoin price, and the green line is [1000 floki, 1000 lunc, 1000 pepe, 1000 shib, 100 0x ec, 1inch, aave, ada , agix, algo, ankr, ant, ape, apt, arb, ar, astr, atom, audio, avax, axs, bal, band, bat, bch, bigtime, blur, bnb, btc, celo, cfx, chz, ckb , comp, crv, cvx, cyber, dash, dgb, doge, dot, dydx, egld, enj, ens, eos,etc, eth, fet, fil, flow, ftm, fxs, gala, gmt, gmx, grt, hbar , hot, icp, icx, imx, inj, iost, iotx, jasmy, kava, klay, ksm, ldo, link, loom, lpt, lqty, lrc, ltc, luna 2, magic, mana, matic, meme, mina, mkr, near, neo, ocean, one, ont, op, pendle, qnt, qtum, rndr, rose, rune , rvn, sand, sei, sfp, skl, snx, sol, ssv, stg, storj, stx, sui, sushi, sxp, theta, tia, trx, t, uma, uni, vet, waves, wld, woo, xem , xlm, xmr, xrp, xtz, yfi, zec, zen, zil, zrx] overall correlation
Market Breadth_Overall Sentiment
Of the 129 coins selected in the past week, 81% had prices above the 30-day moving average, compared with 46.5% of BTC prices above the 30-day moving average, and 76% had prices greater than 20% from the lowest price in the past 30 days. , the proportion that is less than 10% from the highest price in the past 30 days is 40%. The market width indicator over the past week shows that the overall market width indicator is still in an upward trend. However, the more obvious change compared to last week is that a larger part of the coins have fallen back from the highest price.
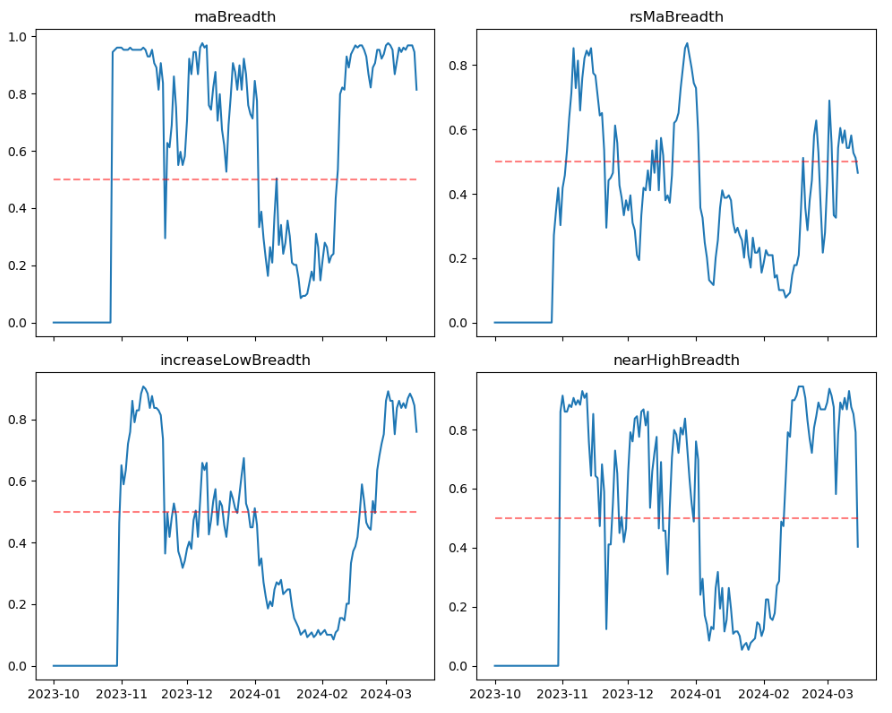
The picture above is [1000 floki, 1000 lunc, 1000 pepe, 1000 shib, 100 0x ec, 1inch, aave, ada, agix, algo, ankr, ant, ape, apt, arb, ar, astr, atom, audio, avax, axs, bal, band , bat, bch, bigtime, blur, bnb, btc, celo, cfx, chz, ckb, comp, crv, cvx, cyber, dash, dgb, doge, dot, dydx, egld, enj, ens, eos,etc, eth , fet, fil, flow, ftm, fxs, gala, gmt, gmx, grt, hbar, hot, icp, icx, imx, inj, iost, iotx, jasmy, kava, klay, ksm, ldo, link, loom, lpt , lqty, lrc, ltc, luna 2, magic, mana, matic, meme, mina, mkr, near, neo , ocean, one, ont, op, pendle, qnt, qtum, rndr, rose, rune, rvn, sand, sei, sfp, skl, snx, sol, ssv, stg, storj, stx, sui, sushi, sxp, theta , tia, trx, t, uma, uni, vet, waves, wld, woo, xem, xlm, xmr, xrp, xtz, yfi, zec, zen, zil, zrx] The proportion of each width indicator on the 30th day
Summarize
In the past week, the price of Bitcoin (BTC) has experienced wide fluctuations after the rally on March 11, while Ethereum (ETH) has continued to fluctuate at high levels. This has caused the markets historical volatility to continue to rise, with trading volume reaching its maximum during multiple rebounds from high declines. Open interest in Bitcoin and Ethereum continues to rise. In terms of implied volatility, Bitcoin is down slightly, while Ethereum is up 5.3%. In addition, funding rates remain high and slowly decline, indicating that contract trading sentiment remains high. Binance’s market breadth indicator shows that the overall market is still in an upward trend, but compared to last week, some coins have retreated from their highest prices.
On the event front, the past week saw the release of non-farm payrolls and CPI data, both of which had a downward swing upon release before rebounding. The current market situation shows that a real bull market may not arrive as expected in a short period of time. Therefore, investors need to have more patience and strategies to deal with the uncertainty and fluctuations before the big bull market arrives.
Twitter: @DerivativesCN
Website: https://dcbot.ai/


