
加密市场情绪研究报告(2024.02.09-02.16):BTC在CPI数据公布短暂下跌后向上突破50000大关
BTC surges above 50,000 mark after brief dip after CPI data
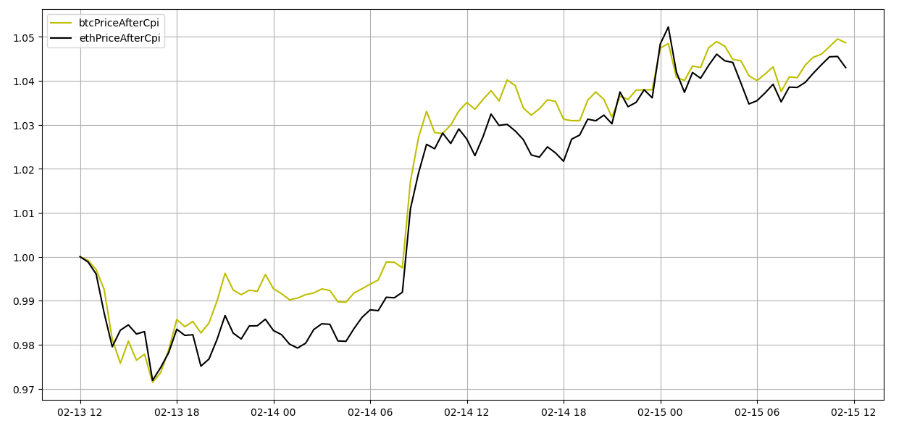
The price trend 2 days after the announcement of CPI, the yellow line is BTC and the black line is ETH.
U.S. CPI data time (2024.02.13 21:30 Beijing time), the announced value (3.1%) was 0.2% higher than the predicted value (2.9%). Both BTC and ETH rebounded after falling sharply by -2.8% after the data was released, and then Breaking a new high on 2024.02.14, BTC broke through the 50,000 mark, while ETH broke through the 2,700 mark.
Bitcoin halving is about 65 days away from today (2024.02.16)
Countdown to halving:https://www.nicehash.com/countdown/btc-halving-2024-05-10-12-00?_360safeparam=1289146171
Market technical and emotional environment analysis
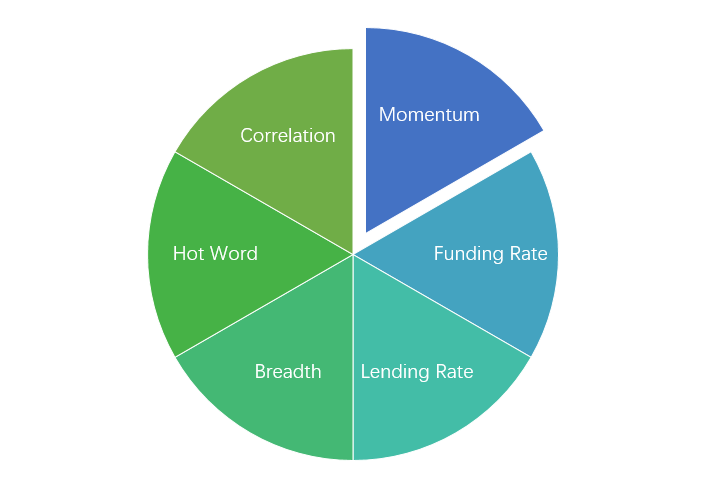
Sentiment analysis components
Technical indicators
Price trend
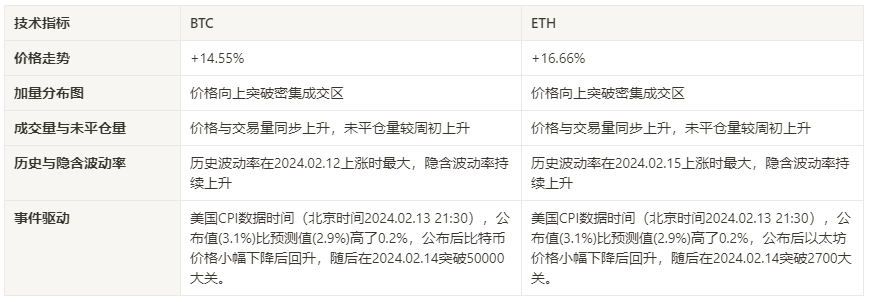
BTC price increased by 14.55% and ETH price increased by 16.66% in the past week.
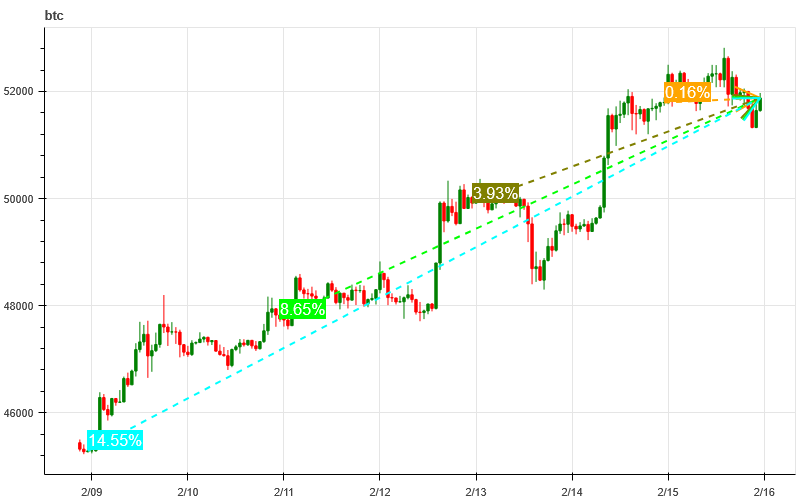
The picture above is the price chart of BTC over the past week
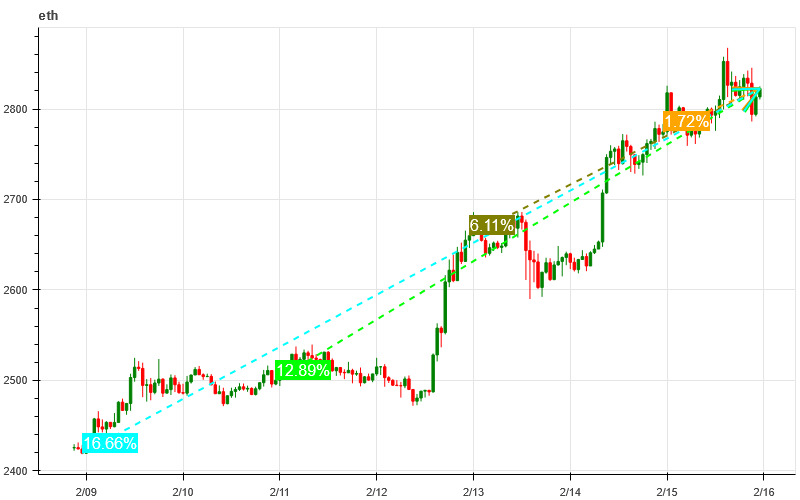
The picture above is the price chart of ETH over the past week
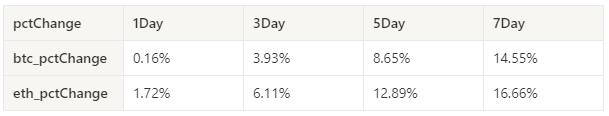
Table showing the rate of price change over the past week
Price and volume distribution chart (support and resistance)
In the past week, BTC and ETH prices broke through intensive trading areas upward.
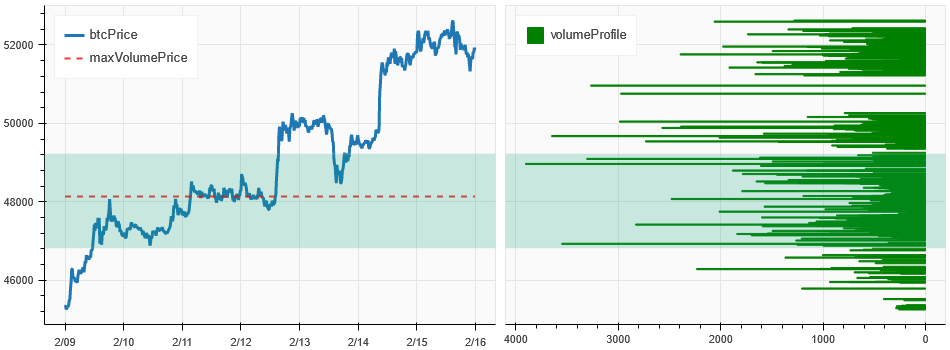
The picture above is the distribution map of BTC’s intensive trading areas in the past week.
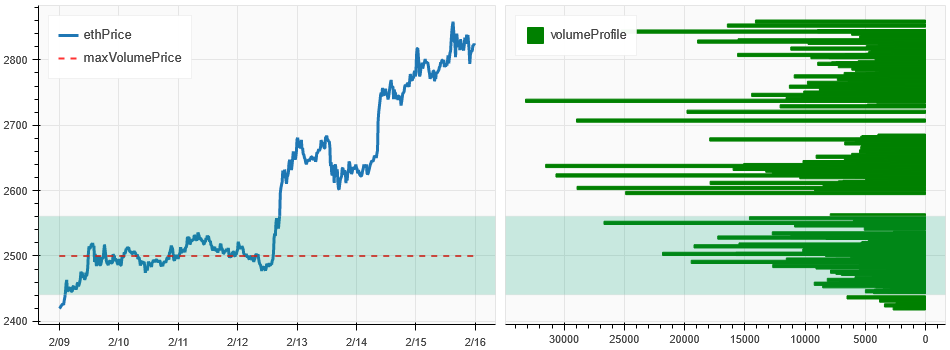
The picture above is the distribution map of ETH’s intensive trading areas in the past week.
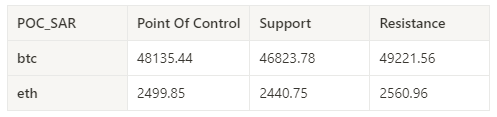
Table showing the intensive weekly trading ranges for BTC and ETH over the past week
Volume and Open Interest
In the past week, the price and trading volume of BTC and ETH have increased simultaneously; the open interest of BTC and ETH has increased compared with the beginning of the week.
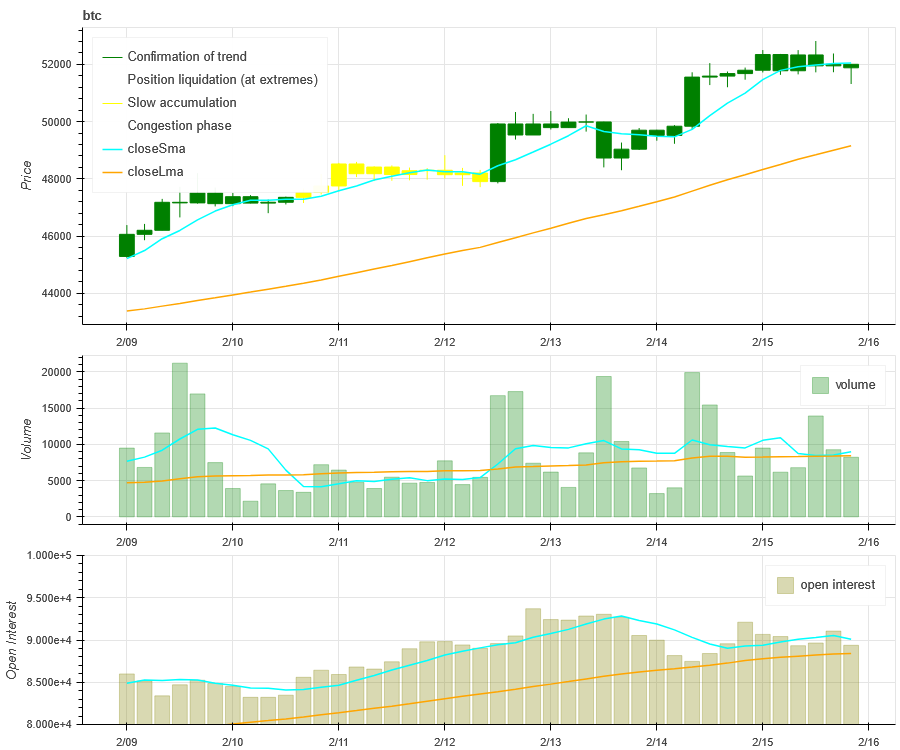
The price trend of BTC at the top of the picture above, the middle is the trading volume, the bottom is the open interest, the light blue is the 1-day average, and the orange is the 7-day average. The color of the K line represents the current status. Green means that the price rise is supported by trading volume, red means positions are being closed, yellow means positions are slowly accumulating, and black means congestion.
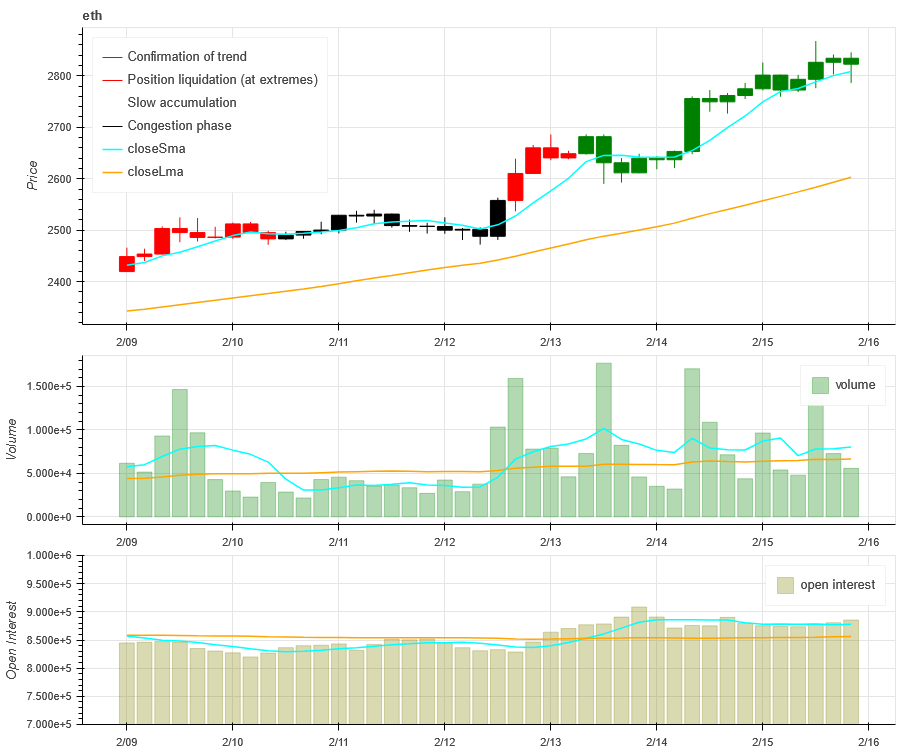
The price trend of ETH at the top of the picture above, the middle is the trading volume, the bottom is the open interest, the light blue is the 1-day average, and the orange is the 7-day average. The color of the K line represents the current status. Green means that the price rise is supported by trading volume, red means positions are being closed, yellow means positions are slowly accumulating, and black means congestion.
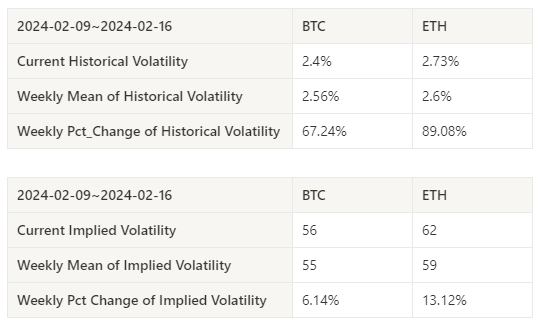
Historical Volatility vs. Implied Volatility
The historical volatility of the past week was the largest for BTC when it rose on 2024.02.12, and for ETH when it rose on 2024.02.15; both implied volatilities continued to rise.
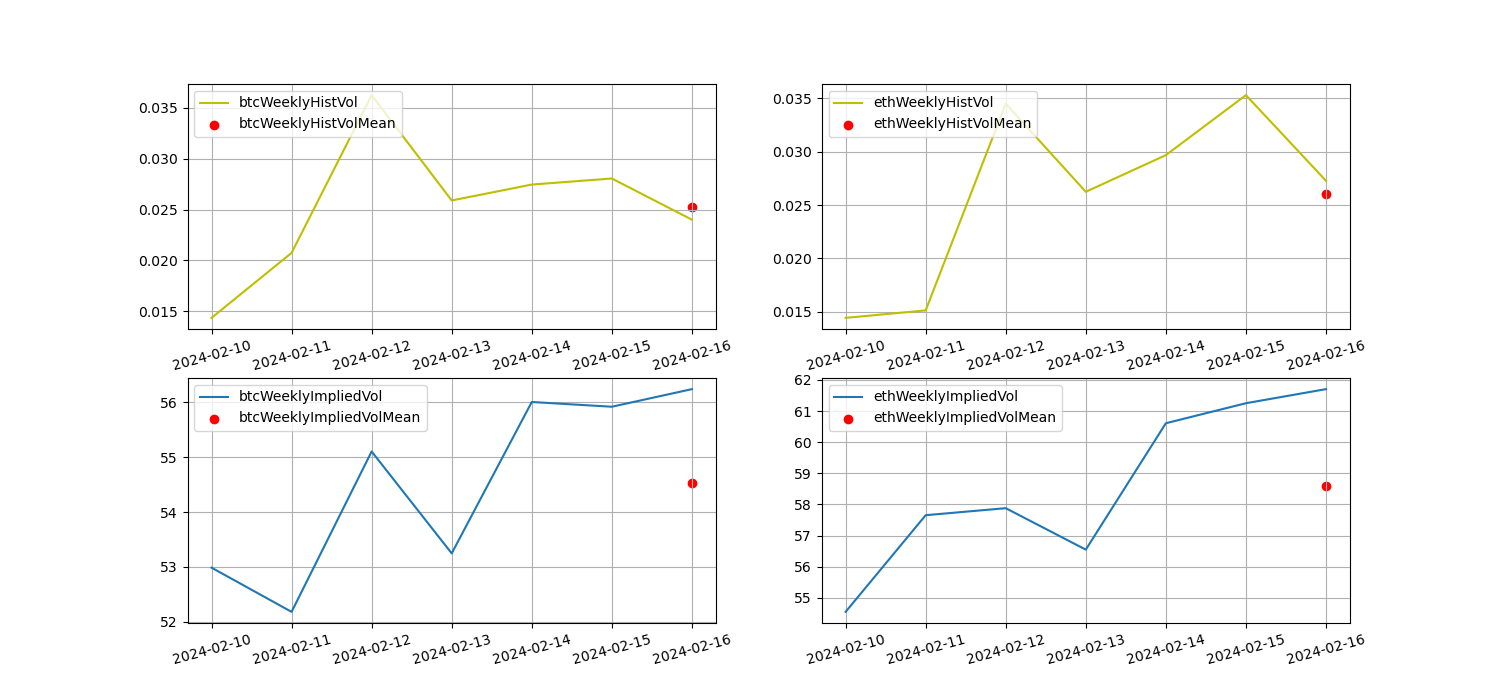
The yellow line is historical volatility, the blue line is implied volatility, and the red dot is its 7-day average
event driven
This weeks US CPI data time (2024.02.13 21:30 Beijing time), the announced value (3.1%) was 0.2% higher than the predicted value (2.9%). After the announcement, the Bitcoin price fell slightly and then rebounded, and then rebounded on 2024.02.14 Breaking through the 50,000 mark.
sentiment indicator
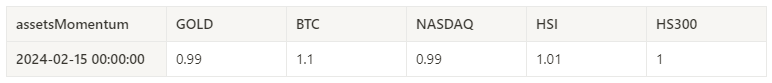
momentum sentiment
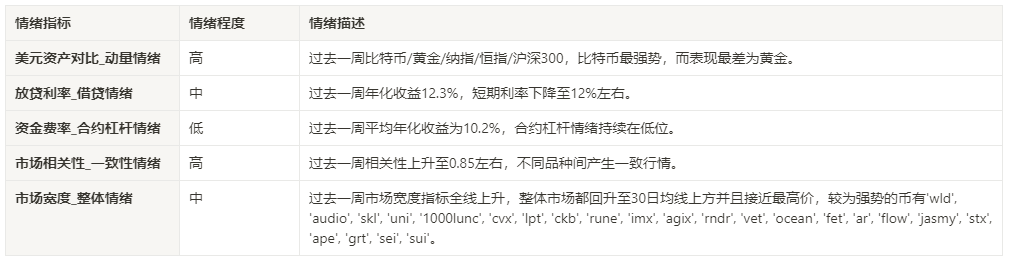
Among Bitcoin/Gold/Nasdaq/HSI/CSI 300 over the past week, Bitcoin was the strongest, while gold was the worst performer.
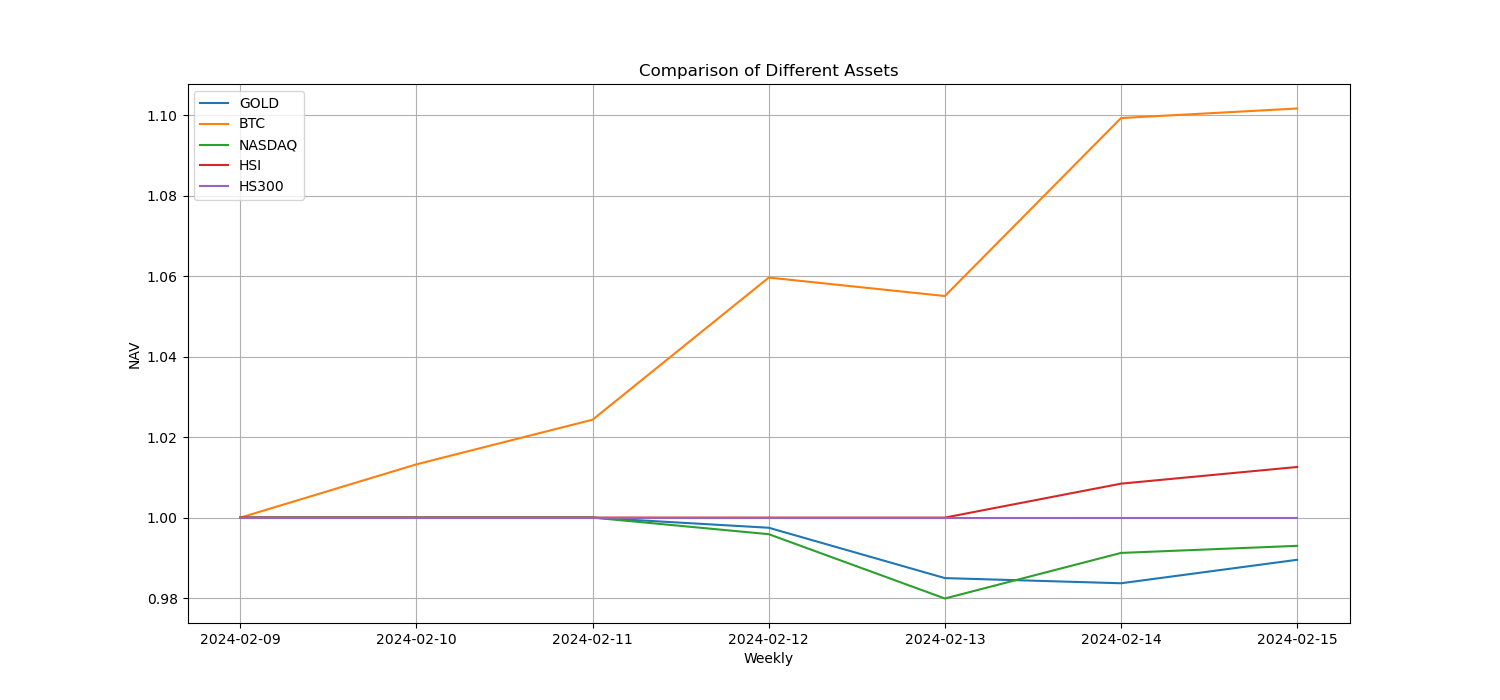
The picture above shows the trends of different assets over the past week.
Lending interest rate_Lending sentiment
The annualized return on USD lending averaged 12.1% in the past week, and short-term interest rates continued to fall to around 12%.
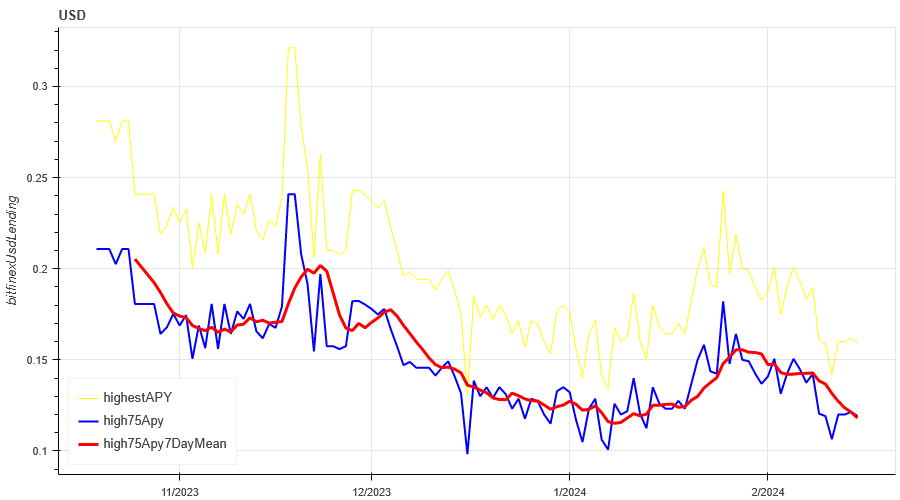
The yellow line is the highest price of the USD interest rate, the blue line is 75% of the highest price, and the red line is the 7-day average of 75% of the highest price
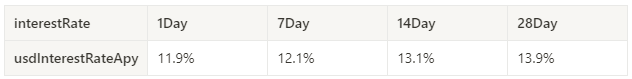
The table shows the average return of USD interest rate for different holding days in the past
Funding Rate_Contract Leverage Sentiment
The average annualized return on BTC tariffs in the past week was 10.2%, and contract leverage sentiment continues to be low.
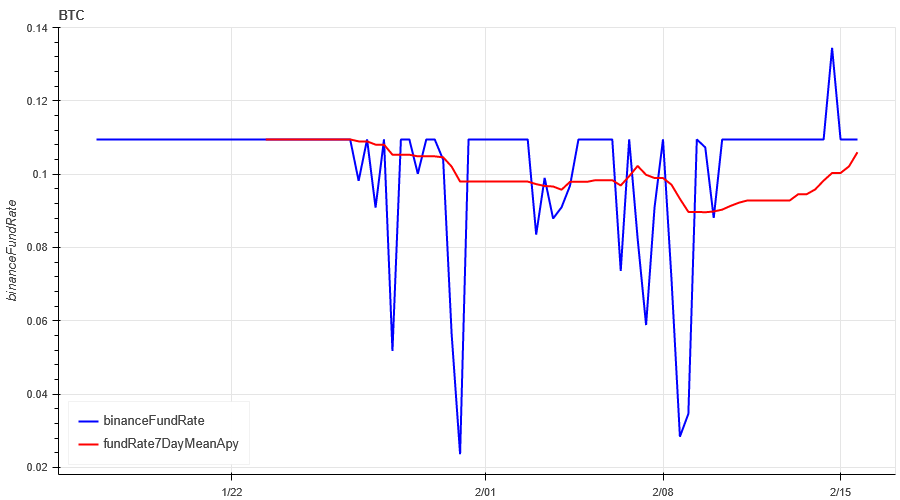
The blue line is the funding rate of BTC on Binance, and the red line is its 7-day average
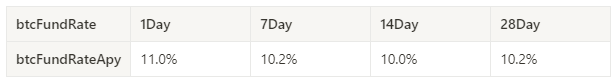
The table shows the average return of BTC fees for different holding days in the past
Market Correlation_Consistent Sentiment
Among the 129 coins selected in the past week, the correlation has increased to around 0.85, resulting in consistent prices among different varieties.
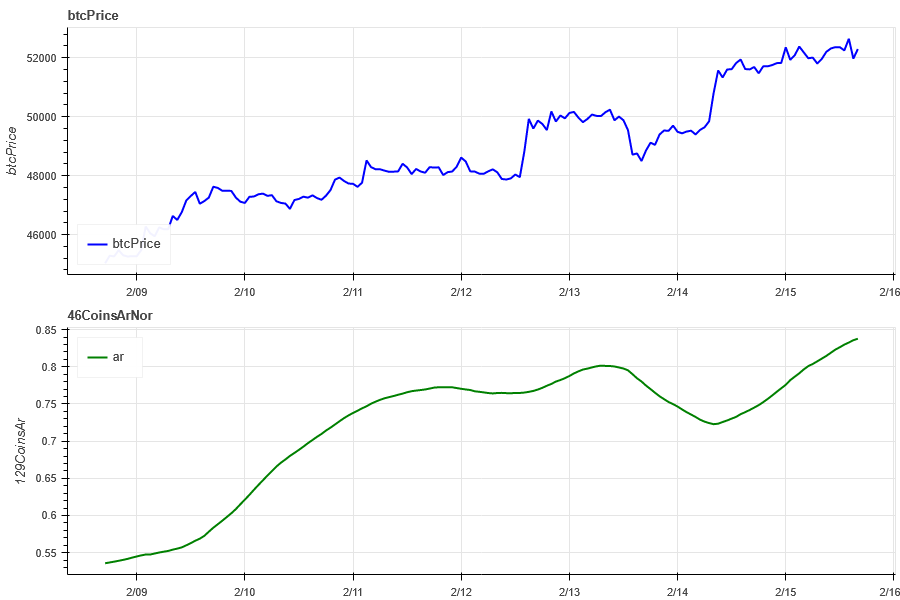
The blue line in the above picture first shows the Bitcoin price, and the green line is [1000 floki, 1000 lunc, 1000 pepe, 1000 shib, 100 0x ec, 1inch, aave, ada , agix, algo, ankr, ant, ape, apt, arb, ar, astr, atom, audio, avax, axs, bal, band, bat, bch, bigtime, blur, bnb, btc, celo, cfx, chz, ckb , comp, crv, cvx, cyber, dash, dgb, doge, dot, dydx, egld, enj, ens, eos,etc, eth, fet, fil, flow, ftm, fxs, gala, gmt, gmx, grt, hbar , hot, icp, icx, imx, inj, iost, iotx, jasmy, kava, klay, ksm, ldo, link, loom, lpt, lqty, lrc, ltc, luna 2, magic, mana, matic, meme, mina, mkr, near, neo, ocean, one, ont, op, pendle, qnt, qtum, rndr, rose, rune , rvn, sand, sei, sfp, skl, snx, sol, ssv, stg, storj, stx, sui, sushi, sxp, theta, tia, trx, t, uma, uni, vet, waves, wld, woo, xem , xlm, xmr, xrp, xtz, yfi, zec, zen, zil, zrx] overall correlation
Market Breadth_Overall Sentiment
Of the 129 coins selected in the past week, 95% had prices above the 30-day moving average. Compared to BTC, 20% had prices above the 30-day moving average, and 40% had prices greater than 20% from the lowest price in the past 30 days. , 95% are less than 10% from the highest price in the past 30 days. The market width indicators have risen across the board in the past week, and the overall market has rebounded above the 30-day moving average and is close to the highest price. The stronger coins include wld, audio , skl, uni, 1000 lunc, cvx, lpt, ckb, rune, imx, agix, rndr, vet, ocean , fet, ar, flow, jasmy, stx, ape, grt, sei, sui.
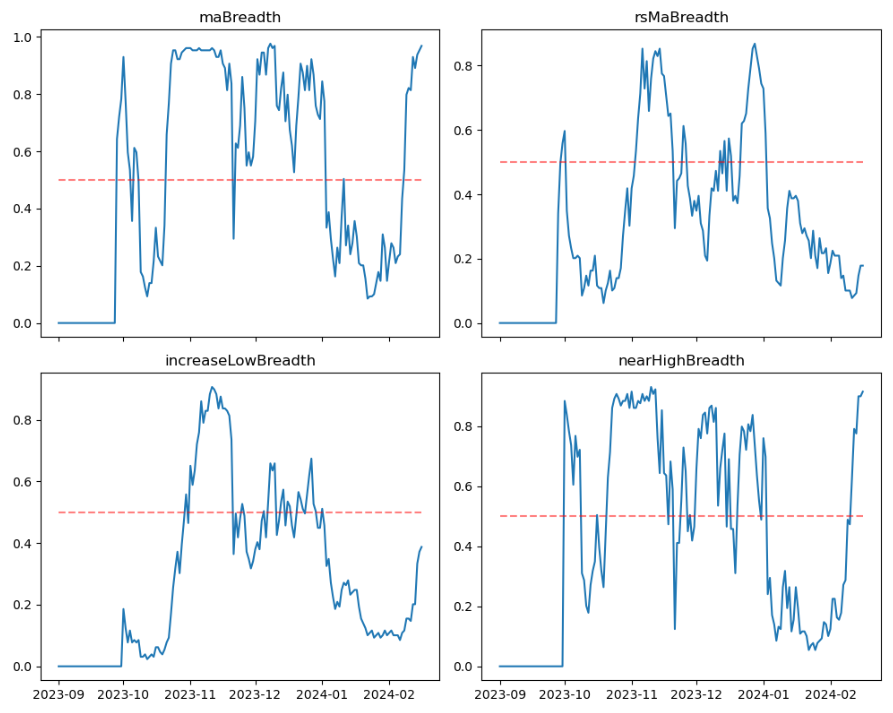
The picture above is [1000 floki, 1000 lunc, 1000 pepe, 1000 shib, 100 0x ec, 1inch, aave, ada, agix, algo, ankr, ant, ape, apt, arb, ar, astr, atom, audio, avax, axs, bal, band , bat, bch, bigtime, blur, bnb, btc, celo, cfx, chz, ckb, comp, crv, cvx, cyber, dash, dgb, doge, dot, dydx, egld, enj, ens, eos,etc, eth , fet, fil, flow, ftm, fxs, gala, gmt, gmx, grt, hbar, hot, icp, icx, imx, inj, iost, iotx, jasmy, kava, klay, ksm, ldo, link, loom, lpt , lqty, lrc, ltc, luna 2, magic, mana, matic, meme, mina, mkr, near, neo , ocean, one, ont, op, pendle, qnt, qtum, rndr, rose, rune, rvn, sand, sei, sfp, skl, snx, sol, ssv, stg, storj, stx, sui, sushi, sxp, theta , tia, trx, t, uma, uni, vet, waves, wld, woo, xem, xlm, xmr, xrp, xtz, yfi, zec, zen, zil, zrx] The proportion of each width indicator on the 30th day

Summarize
The market prices of BTC and ETH have increased significantly this week. The trading volume, open interest, historical volatility and implied volatility of both have increased compared with the beginning of the week. The market continues to maintain an upward trend; the funding rate is due to the low sentiment of contract leverage. Therefore, the yield rate also remains at a low level; 129 Binance market width indicators rose across the board, and the overall market rose back above the 30-day moving average and close to the highest price. The stronger coins include wld, audio, skl, uni, 1000 lunc, cvx, lpt, ckb, rune, imx, agix, rndr, vet, ocean, fet, ar , flow, jasmy, stx, ape, grt, sei, sui; in terms of events, US CPI data time (Beijing time 2024.02.13 21:30), published value (3.1%) was 0.2% higher than the predicted value (2.9%). After the announcement, the price of Bitcoin dropped slightly and then rebounded. Then on 2024.02.14 BTC exceeded the 50,000 mark, while ETH exceeded the 2,700 mark.
Twitter: @DerivativesCN
Website: https://dcbot.ai/


