CoinCodex:5日内比特币或再跌10.86%,以太坊上涨8.06%
Original author:CoinCodex
Compiled by: Odaily Lucaskog

Looking back at historical data, the price of Bitcoin has shown a downward trend in the short term, falling 8.6% in the past 30 days (14 of which were rising days), with a volatility of 3.05, which is relatively low; in the medium term, Bitcoin still contains a bullish trend, with the past 3 days It has a monthly increase of 18.71%; it has shown a long-term upward trend, with an increase of 74.82% in the past year - today last year, the BTC price was $22,882. Going further back, Bitcoin hit its all-time high price of $68,770 on November 10, 2021.
In the current cycle, BTC has reached a high of $48,941 and a low of $15,599.
Zooming in to January 22, 2024, let’s observe market sentiment and perform technical analysis.
Market sentiment is currently bearish, although the Fear Greed Index is showing at 55 (greed), indicating that investors remain positive about the market.
Note: The Fear and Greed Index is a measure of investor sentiment."greedy"Indicates that investors are currently optimistic about the cryptocurrency market, but may also indicate that the market is overvalued;"fear"It shows that investors are currently hesitant about the cryptocurrency market and may also represent a buying opportunity.
Of the 31 indicators CoinCodex follows, 15 are bullish for Bitcoin and 16 are bearish.
Looking at the moving average indicators alone, there are half bullish and half bearish indicators, which are basically consistent with the overall indicator prediction:
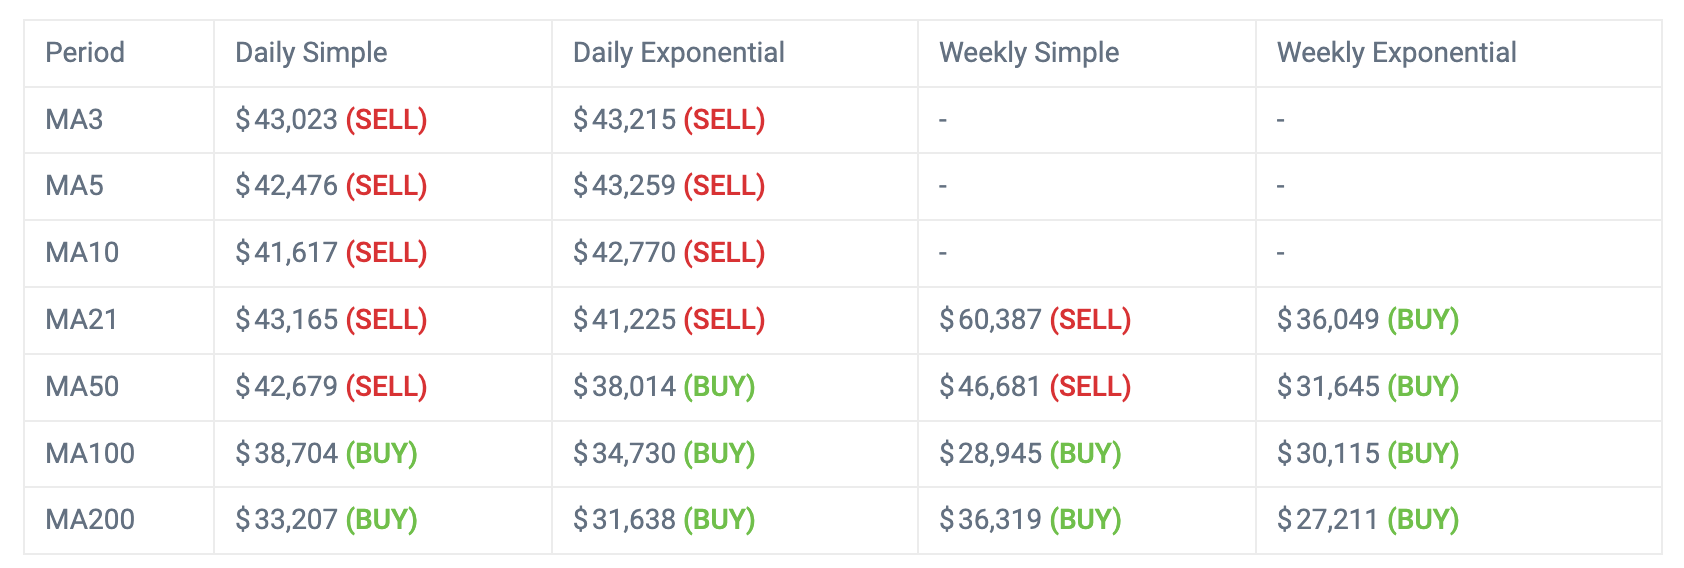
CoinCodex also analyzes some important technical indicators such as key moving averages and oscillators to get a better understanding of Bitcoin’s current price level.
Among them, the Relative Strength Index (RSI 14) is a widely used indicator that helps investors understand whether an asset is currently overbought or oversold. Bitcoin’s RSI 14 is at 42.06, indicating that BTC is moving into neutral territory.
The 50-day simple moving average (SMA 50) takes into account Bitcoin’s closing price over the past 50 days. Currently, Bitcoin is trading below the SMA 50 trendline, which is a bearish signal.
The 200-day simple moving average (SMA 200) is a long-term trendline determined by averaging the closing prices of Bitcoin over the past 200 days. BTC is currently trading below the SMA 200, indicating that the market is currently in a bear market.
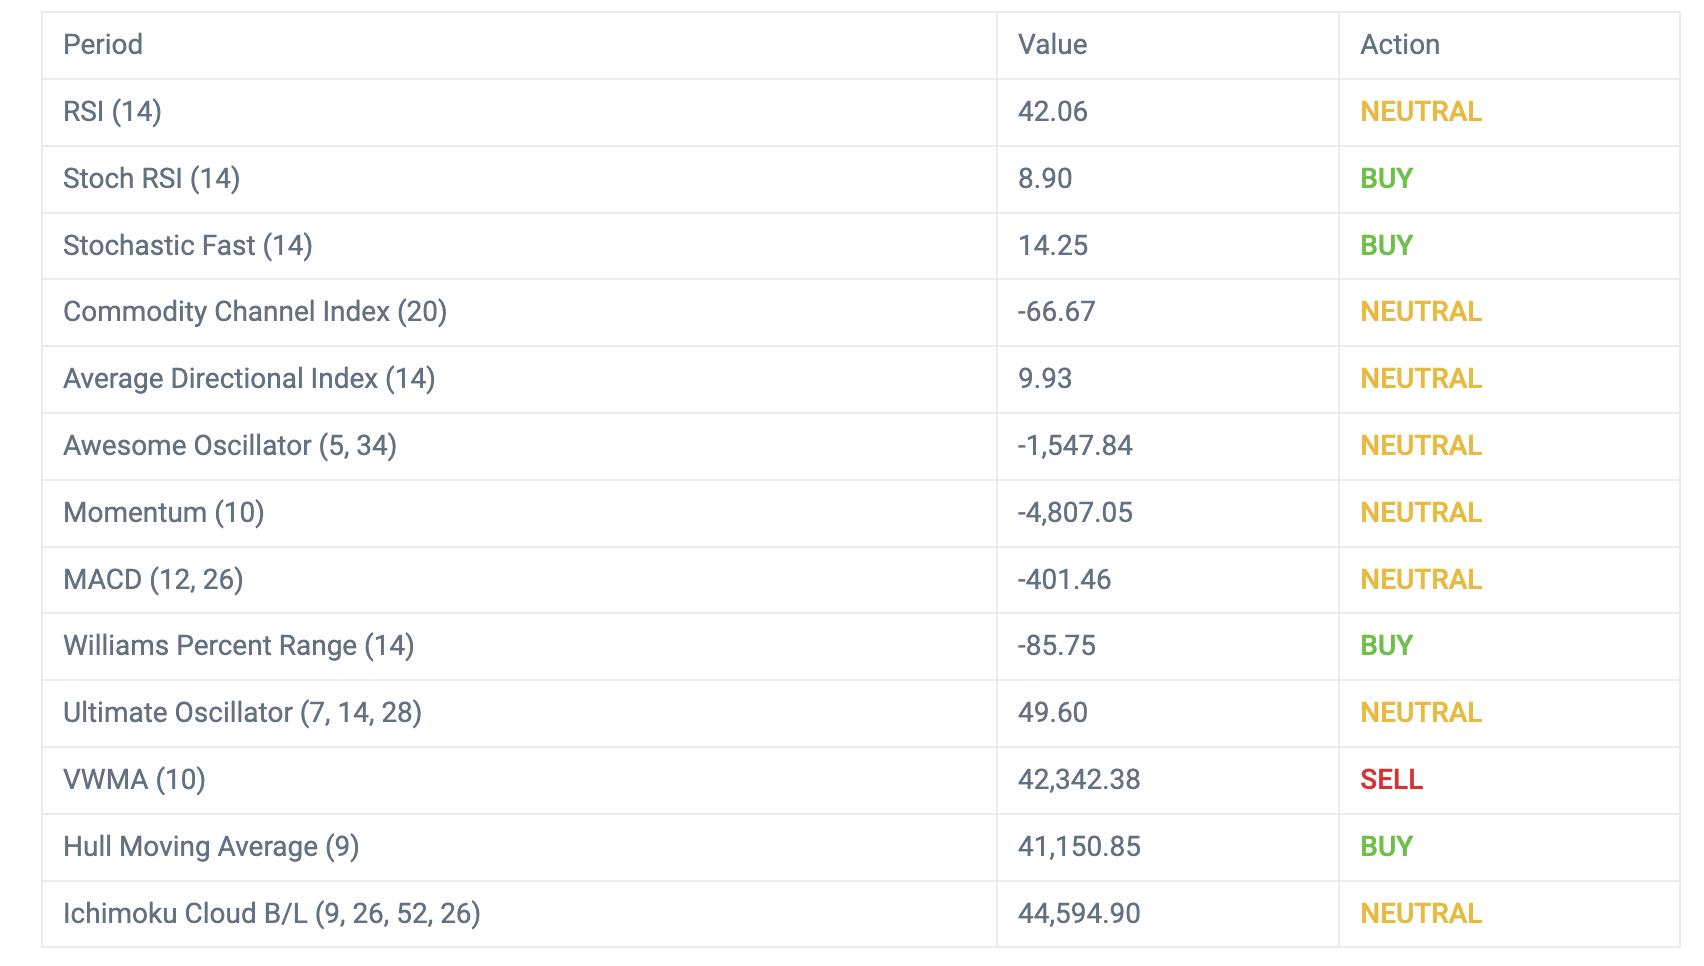
The directionality of some indicators
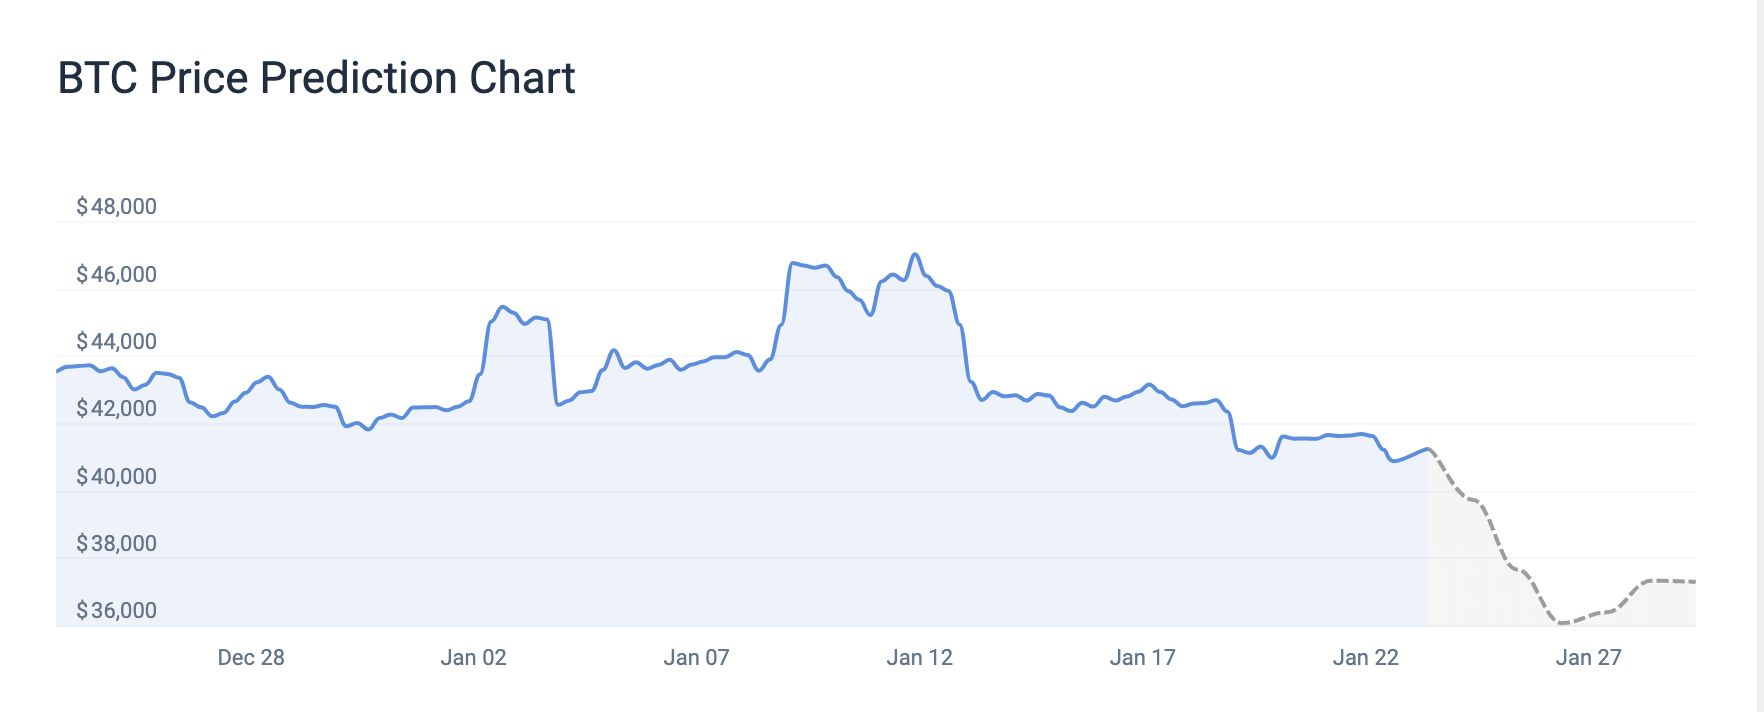
in summary,CoinCodex has a bearish price forecast for Bitcoin, which could drop 10.86% to around $36, 435 in the next 5 days (to January 27). Important support levels to watch are $41,432, $41,314, and $41,098 (all broken below), while key resistance levels are $41,766, $41,982, and $42,100.
What about Ethereum? May part ways with Bitcoin
Looking back at historical data, Ethereum has shown an upward trend recently, rising by 0.99% in the past 30 days (including 12 rising days), with a volatility of 5.05, which is relatively low. In the medium term, Ethereum is also showing a bullish trend, growing by 30.74% in the past 3 months. The long-term trend remains upward, with gains of 42.9% in one year — on this day last year, ETH was trading at $1,635.52. Continuing back in time, Ethereum hit an all-time high of $4,867.17 on November 10, 2021.
The current ETH cycle high is $2,714.13, while the cycle low is $897.01.
Zooming in to January 23, 2024, let’s observe market sentiment and perform technical analysis.
The current fear and greed index for the Ethereum market is 50 (neutral).
CoinCodex analyzes some important technical indicators such as key Moving Averages and Oscillators to get a better understanding of Ethereum’s current price.
Among them, Ethereum’s RSI 14 is 53.13, indicating that ETH is currently in a neutral state.
The 50-day simple moving average (SMA 50) takes into account Ethereum’s closing prices over the past 50 days. Currently, Ethereum is trading below the SMA 50 trendline, which is a bearish signal.
Meanwhile, the 200-day simple moving average (SMA 200) is a long-term trendline determined by averaging Ethereum’s closing prices over the past 200 days. ETH is currently trading below the SMA 200, indicating that the market is currently in a bear market.
Of the 28 indicators followed by CoinCodex, 14 are bullish for Ethereum and 14 are bearish.
Looking at various indicators alone, most are neutral, basically consistent with market sentiment:
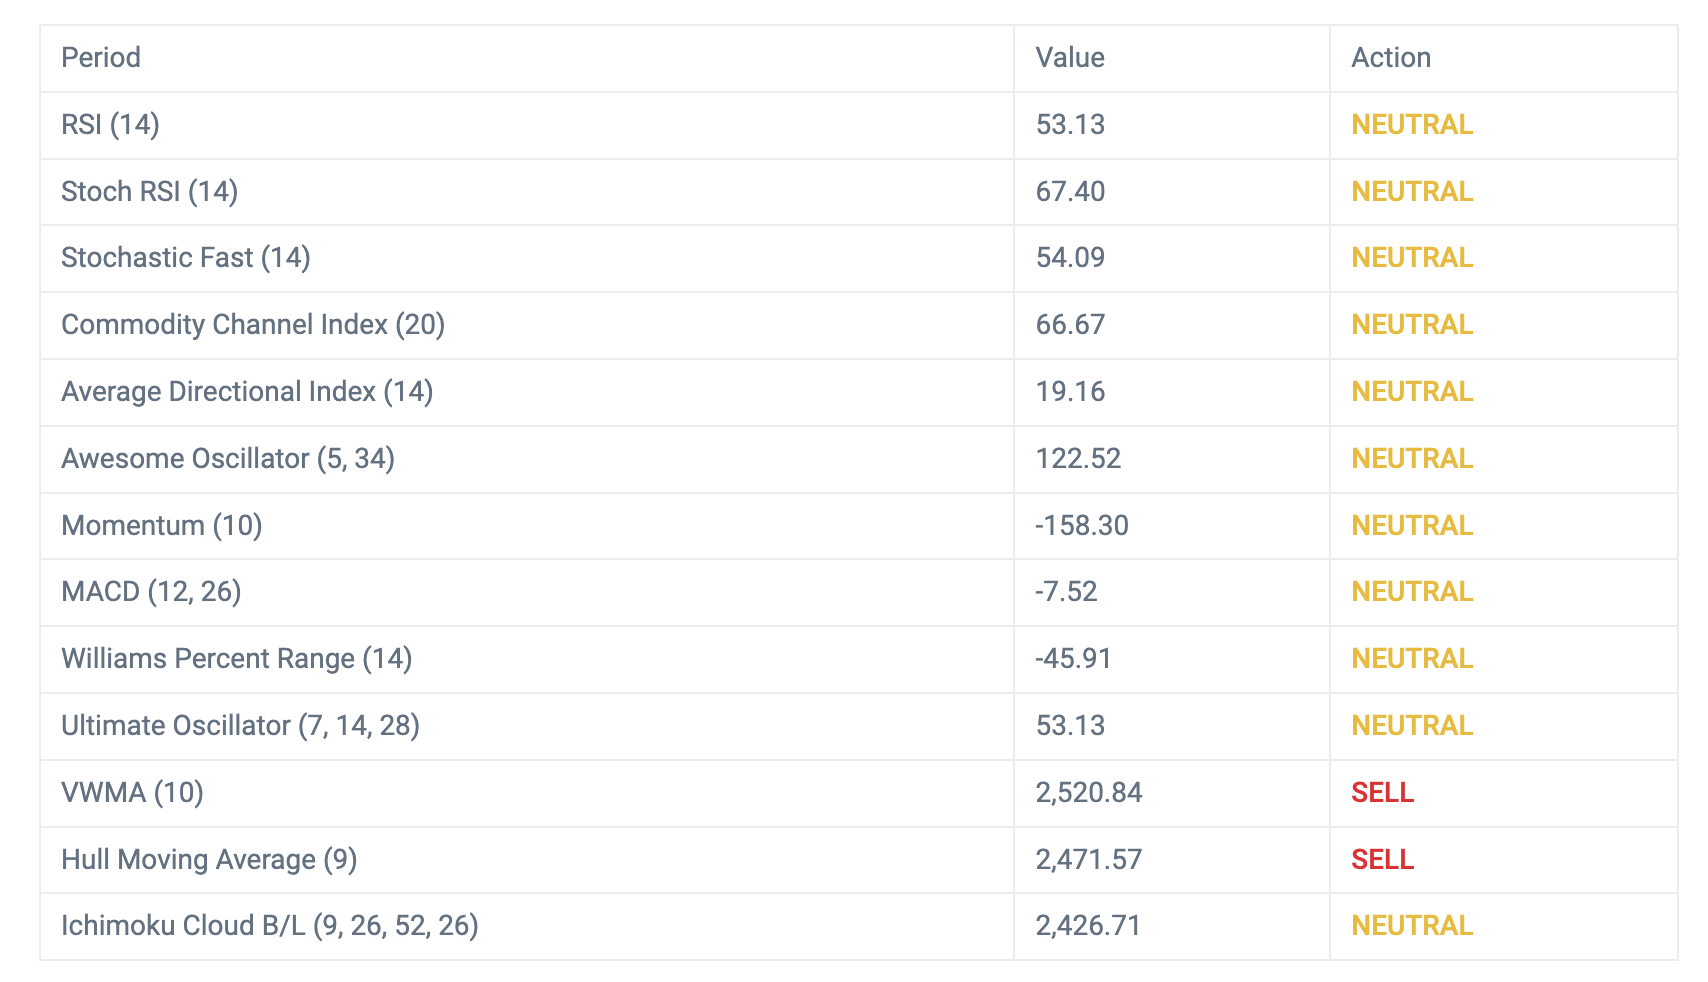
By observing the different moving averages Daily Simple Moving Average (SMA) and Daily Exponential Moving Average (EMA), we can conclude that EMA presents a buy signal in the short-term MA 10, which means that Ethereum will usher in an upward trend soon.
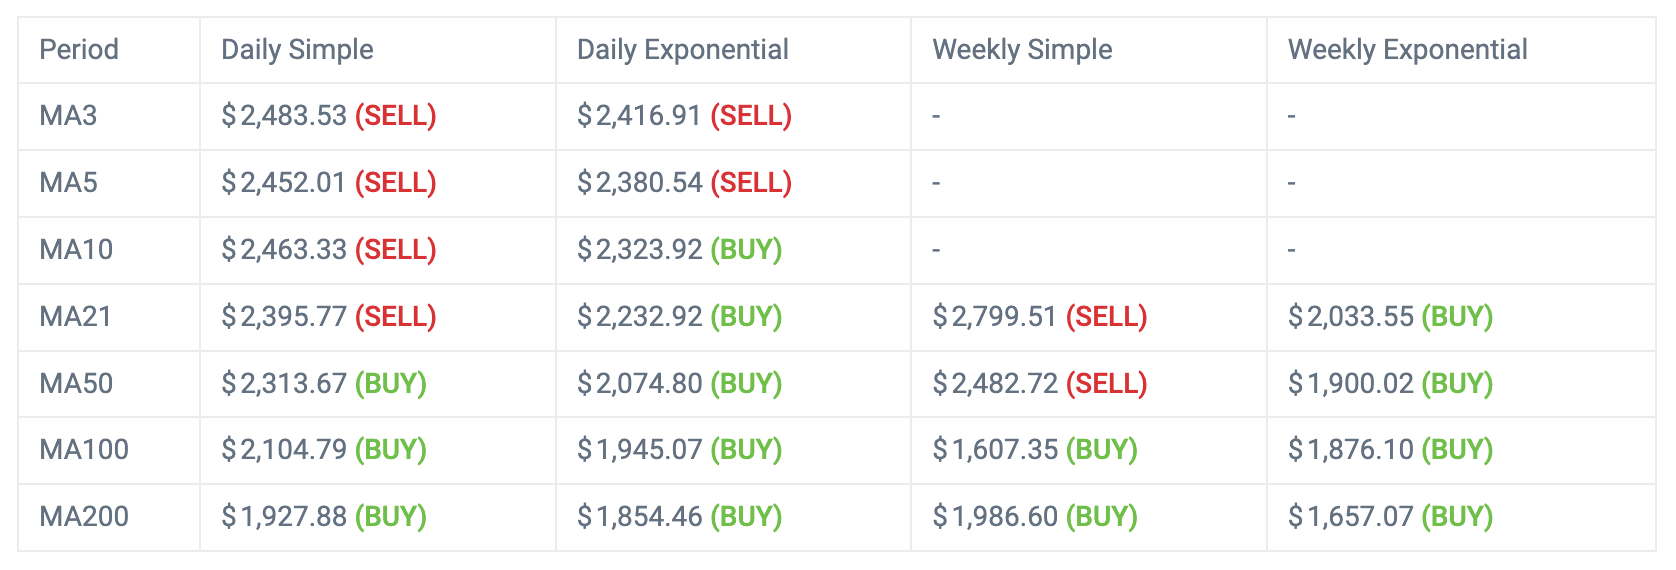
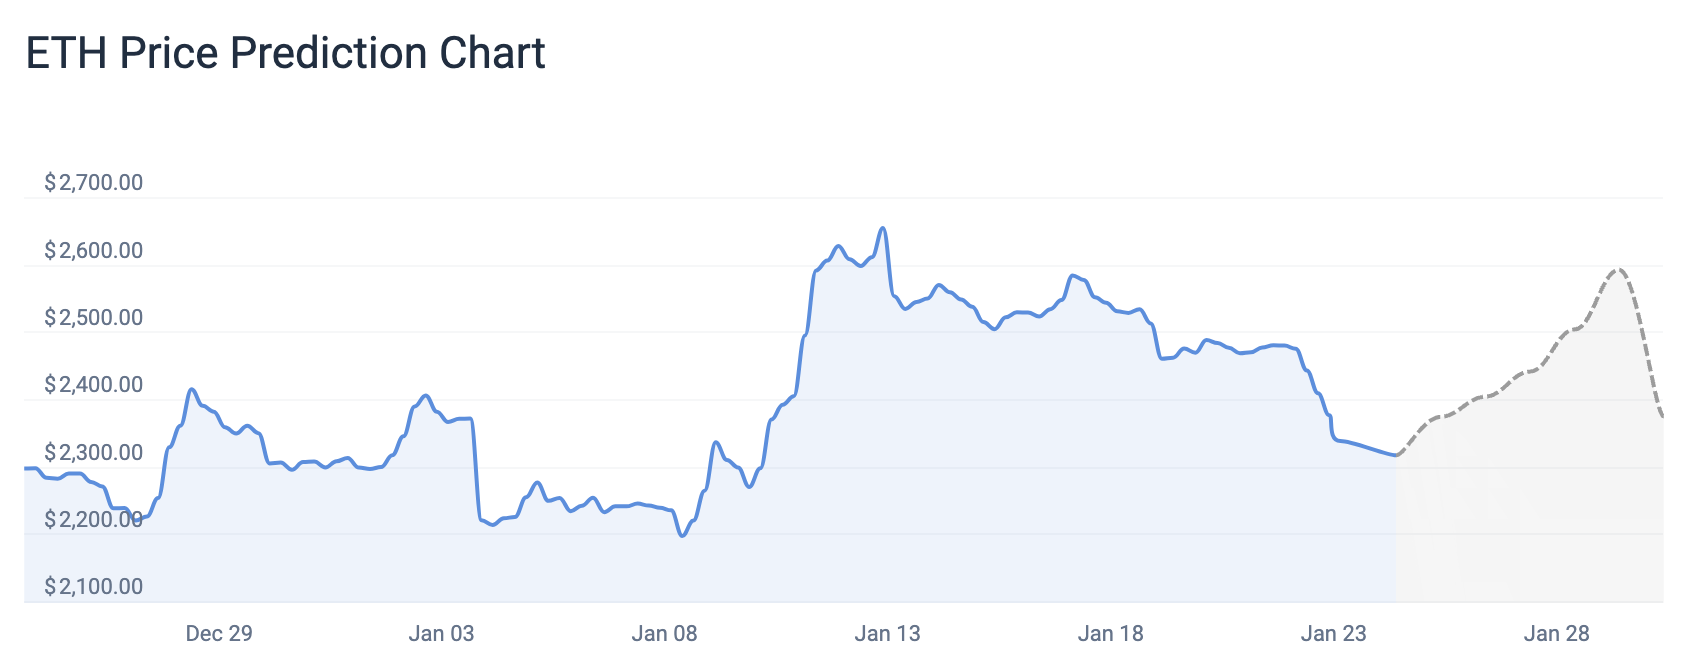
in summary,CoinCodex’s price forecast for Ethereum is bullish, or it could rise 8.06% to near $2, 506.3 in the next 5 days (to January 27). Support levels to watch are $2,260.52, $2,206.97, and $2,100.63, while key resistance levels are $2,420.41, $2,526.75, and $2,580.31.
The above predictions are based on various technical indicators related to the prices of Bitcoin and Ethereum and do not constitute any investment advice.


