
加密市场情绪研究报告(2023.12.29-2024.01.05):合约爆仓数量创新高
The number of contract liquidations hit a new high
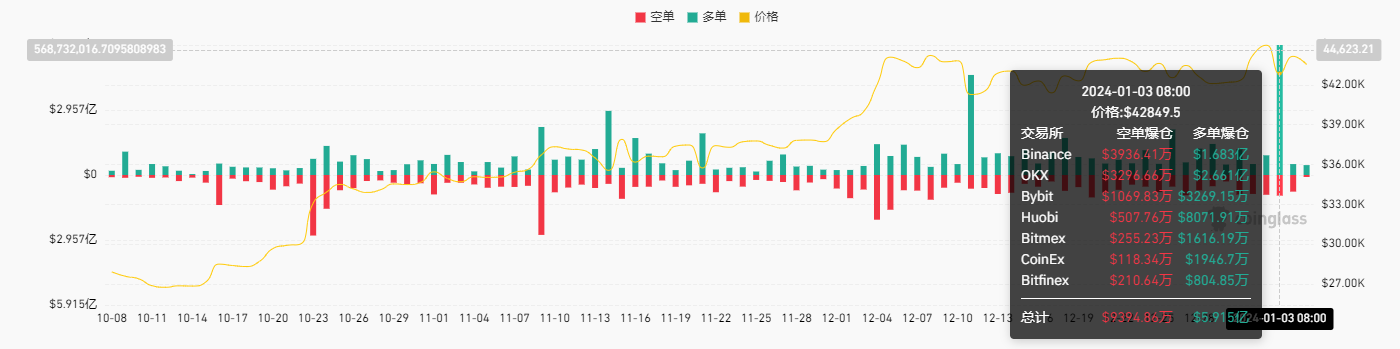
On January 3, 2024, the total liquidation volume of long positions was US$591.5 million, setting a new high in the past three months. What does this mean?
The increase in the number of long liquidations in the contract may hint at something, although it cannot completely guarantee future trends. Here are some possible phenomena:
Short-term rebound:A long liquidation usually occurs in the event of a price drop, when long positions are forced to be liquidated. This could lead to a short-term rally in the market as the selling pressure released by the liquidation of long positions is reduced.
Technical adjustments:A long liquidation could cause price to trigger support levels or key technical indicators, triggering a technical correction. Investors can pay attention to these technical adjustments and analyze them in conjunction with other technical indicators to capture possible buying opportunities.
Market sentiment changes:The liquidation of long positions may trigger a change in market sentiment. When long positions are liquidated, market sentiment may become more cautious and investors views on the market outlook may change. This may provide investors with the opportunity to find undervalued projects or gradually build positions during price corrections.
Trend reversal:The increase in long liquidations may be one of the signs of a trend reversal. When long positions are liquidated, the market may show signs of a price bottom or a reversal of the downtrend. Investors can watch for signs of such a trend reversal and perform appropriate technical and fundamental analysis to determine whether investment opportunities exist.
It should be noted that long position liquidation cannot alone be used as the only basis for investment decisions. In addition to the contract liquidation data hitting a new high this week, the implied volatility also hit a new high in the past half year. The rising volatility environment will provide more trading opportunities.
Bitcoin halving is about 93 days away from today (2024.01.05)
Countdown to halving:https://www.nicehash.com/countdown/btc-halving-2024-05-10-12-00?_360safeparam=1289146171
Market technical and emotional environment analysis
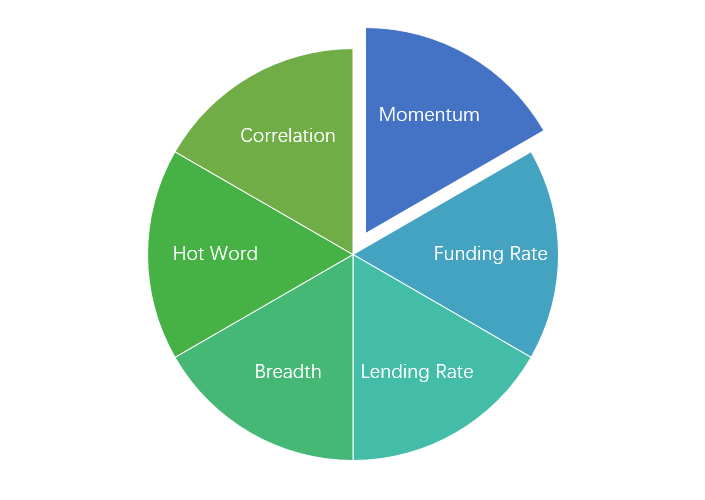
Sentiment analysis components
Technical indicators
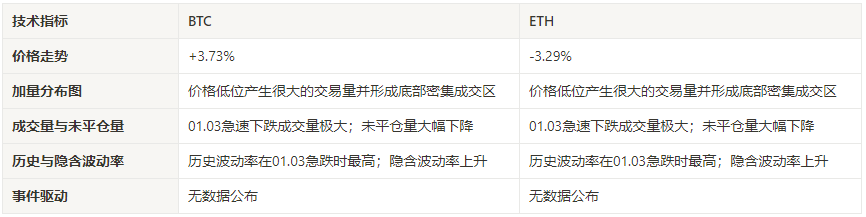
Price trend
BTC price increased by +3.73% and ETH price fell by -3.29% over the past week.
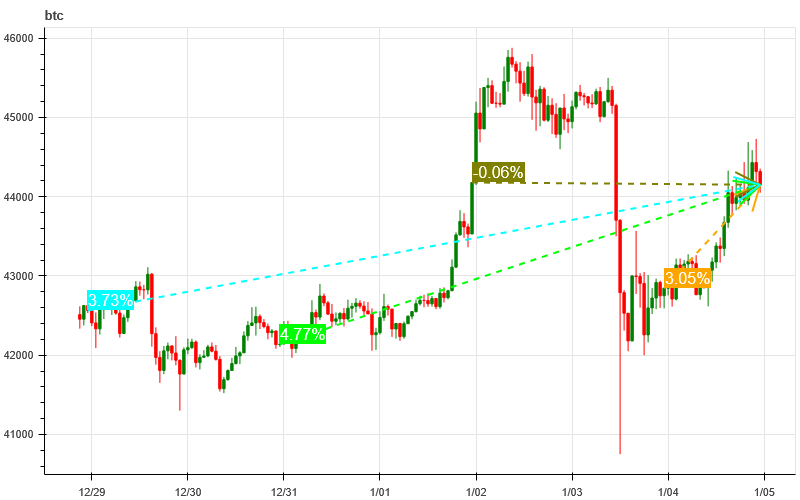
The picture above is the price chart of BTC over the past week
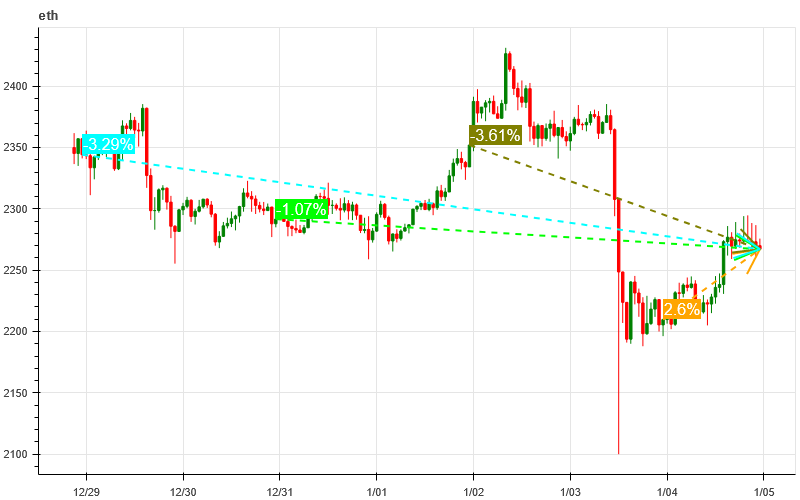
The picture above is the price chart of ETH over the past week
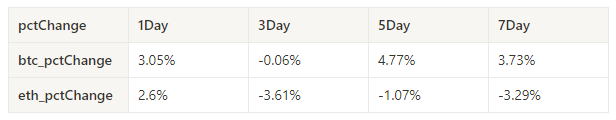
Table showing the rate of price change over the past week
Price and volume distribution chart (support and resistance)
In the past week, BTC and ETH prices generated large trading volumes at relatively low levels and formed a bottom-intensive trading area.
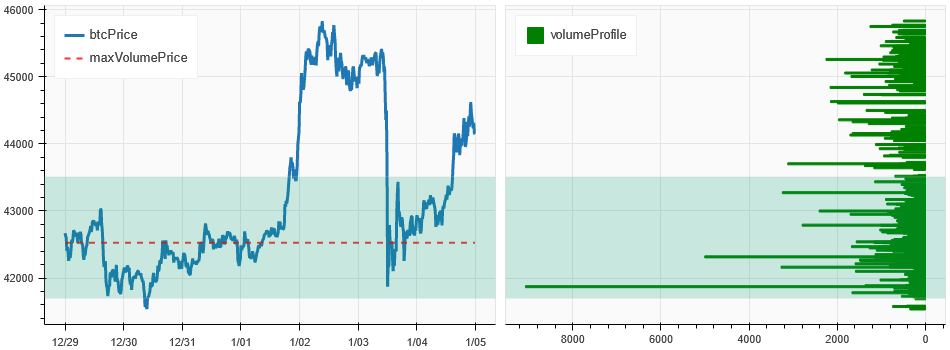
The picture above is the distribution map of BTC’s intensive trading areas in the past week.
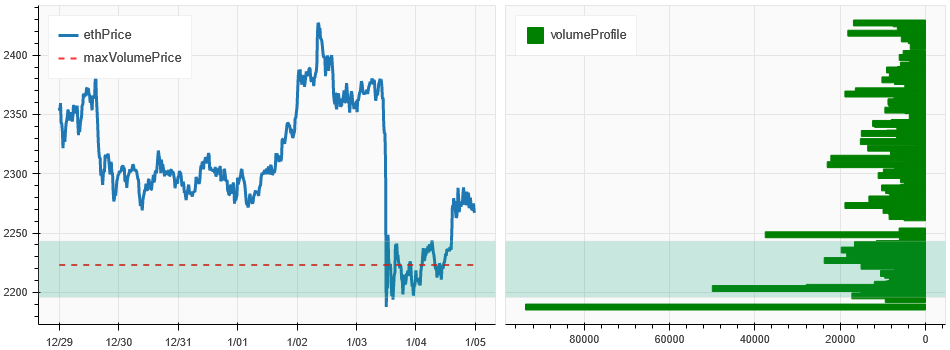
The picture above is the distribution map of ETH’s intensive trading areas in the past week.
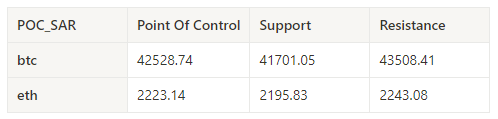
Table showing the intensive weekly trading ranges for BTC and ETH over the past week
Volume and Open Interest
In the past week, BTC and ETH both fell sharply at 01.03 with huge trading volume; both BTC and ETH’s open interest dropped significantly.
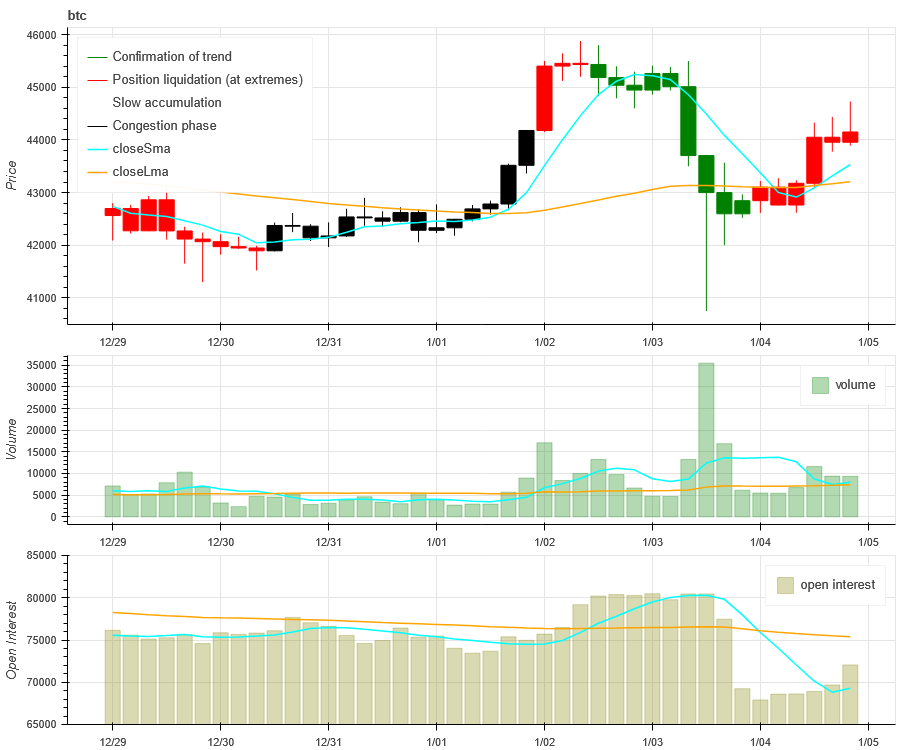
The price trend of BTC at the top of the picture above, the middle is the trading volume, the bottom is the open interest, the light blue is the 1-day average, and the orange is the 7-day average. The color of the K line represents the current status. Green means that the price rise is supported by trading volume, red means positions are being closed, yellow means positions are slowly accumulating, and black means congestion.
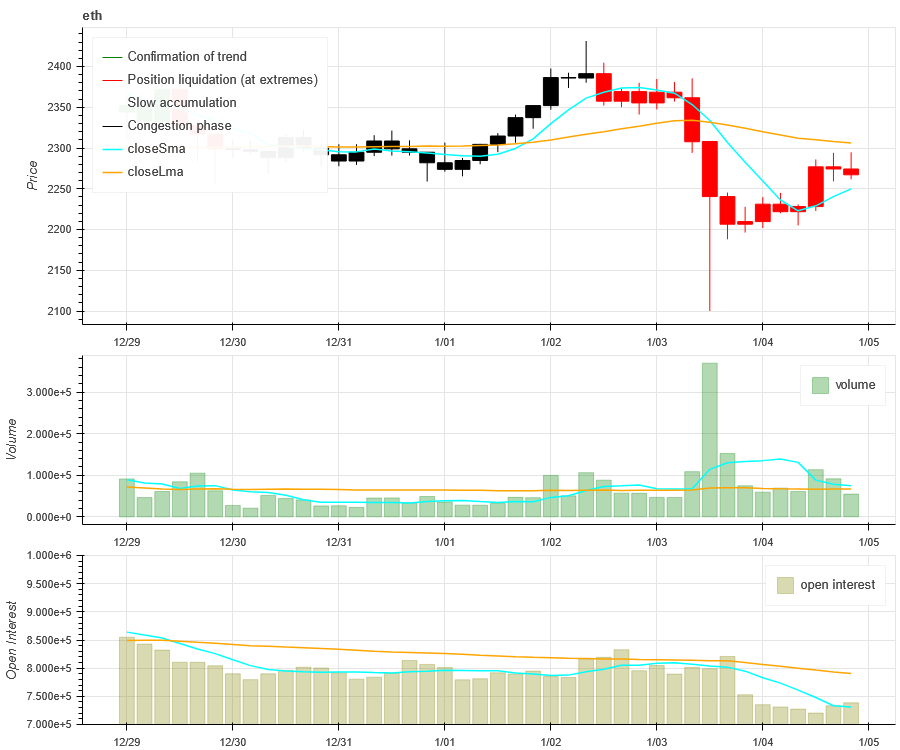
The price trend of ETH at the top of the picture above, the middle is the trading volume, the bottom is the open interest, the light blue is the 1-day average, and the orange is the 7-day average. The color of the K line represents the current status. Green means that the price rise is supported by trading volume, red means positions are being closed, yellow means positions are slowly accumulating, and black means congestion.
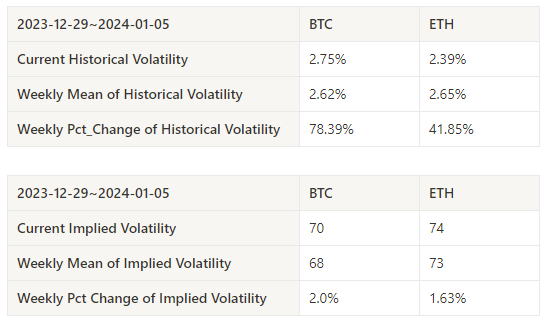
Historical Volatility vs. Implied Volatility
Historical volatility for BTC and ETH over the past week was highest during the 01.03 plunge, with implied volatility rising overall.
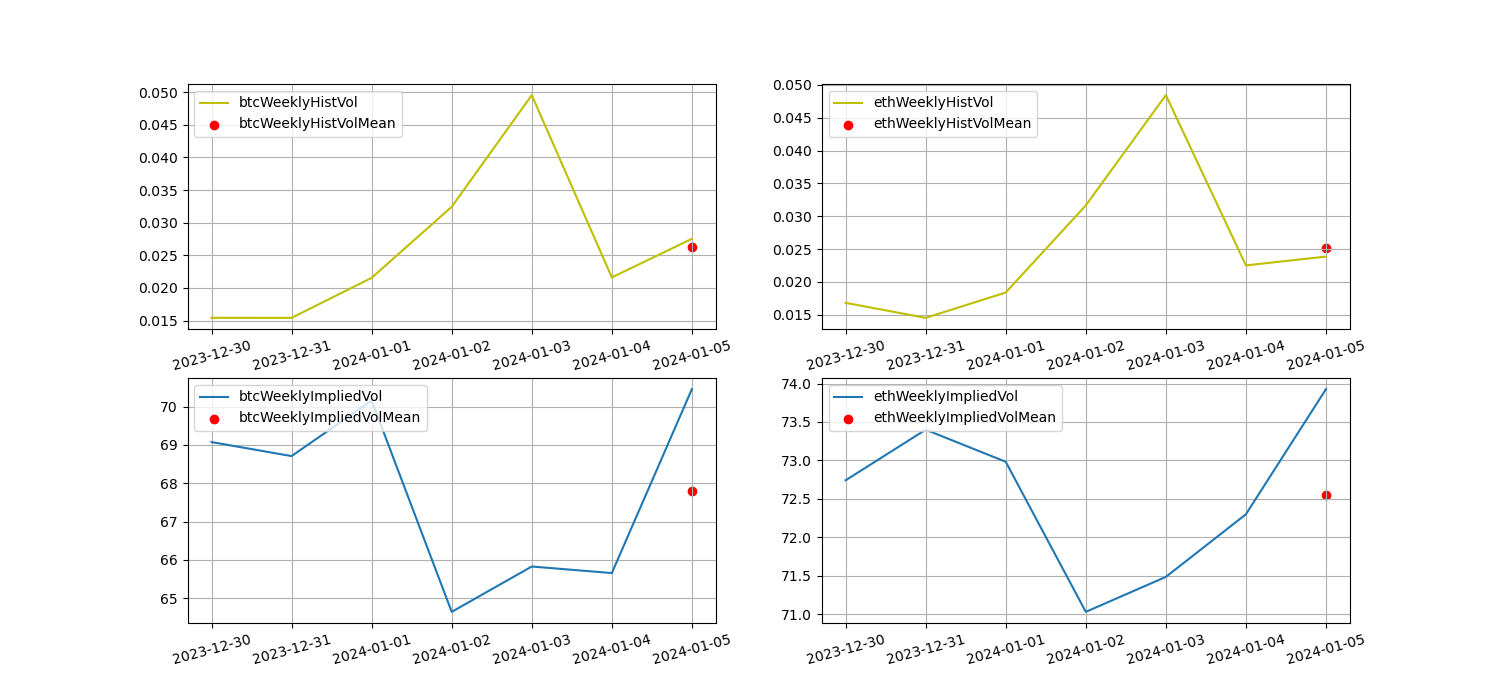
The yellow line is historical volatility, the blue line is implied volatility, and the red dot is its 7-day average
event driven
No data is released this week.
sentiment indicator
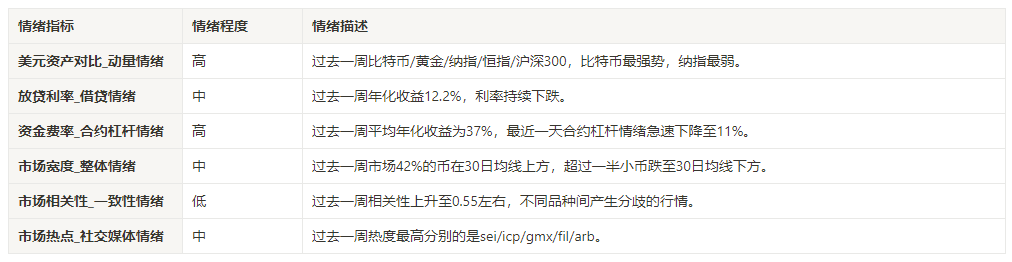
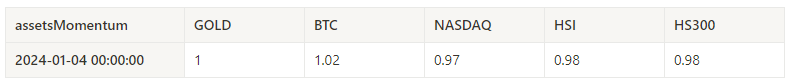
momentum sentiment
Among Bitcoin/Gold/Nasdaq/HSI/CSI 300, Bitcoin was the strongest in the past week, while the Nasdaq was the worst performer.
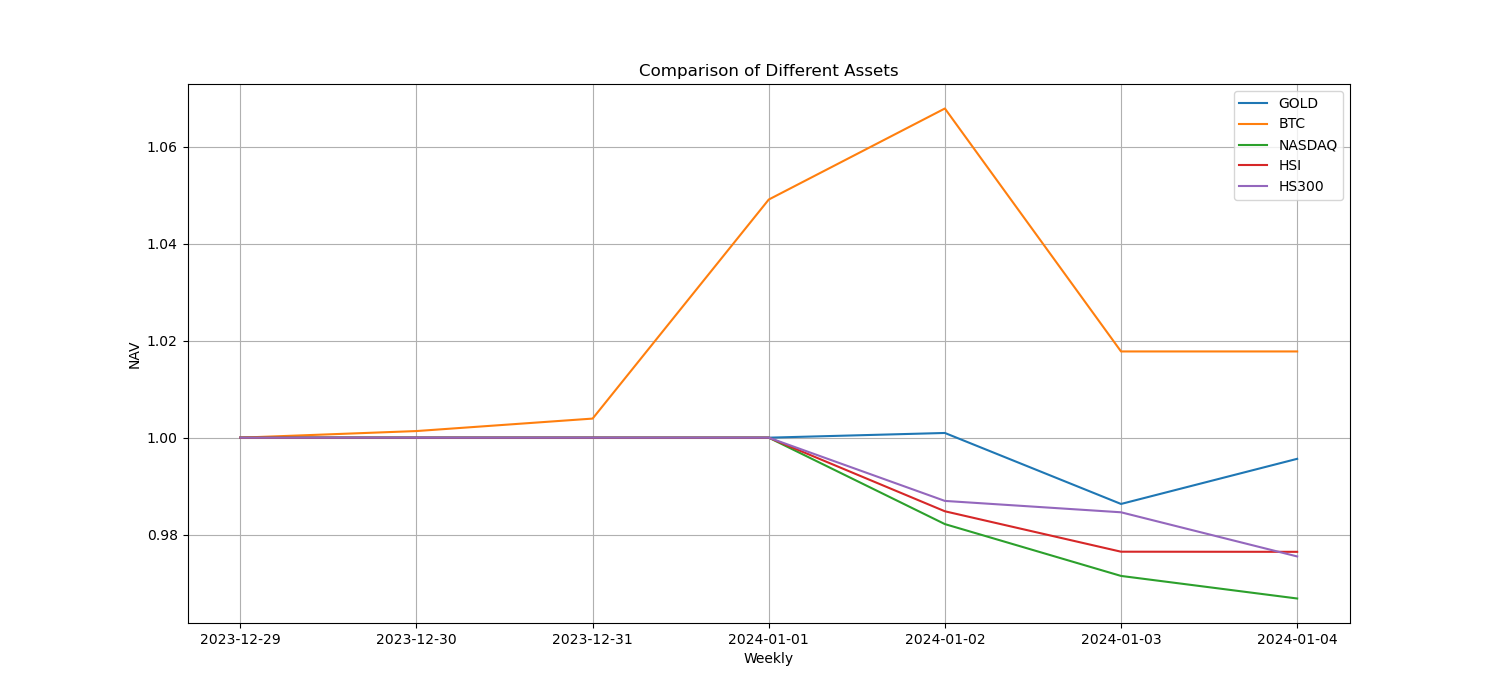
The picture above shows the trends of different assets over the past week.
Lending interest rate_Lending sentiment
The average annualized return on USD lending over the past week was 12.2%, and interest rates continued to fall.
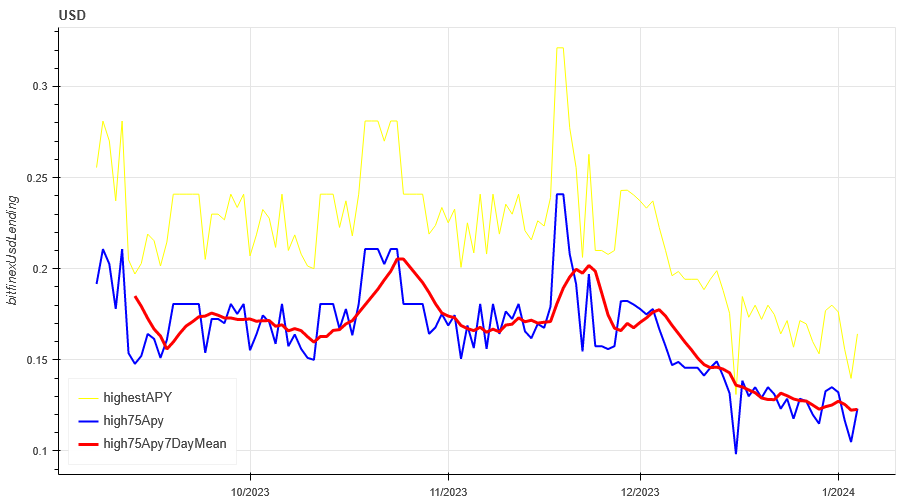
The yellow line is the highest price of the USD interest rate, the blue line is 75% of the highest price, and the red line is the 7-day average of 75% of the highest price
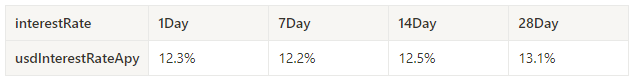
The table shows the average return of USD interest rate for different holding days in the past
Funding Rate_Contract Leverage Sentiment
The average annualized return on BTC rates in the past week was 37%, and contract leverage sentiment dropped sharply to 11% in the last day.
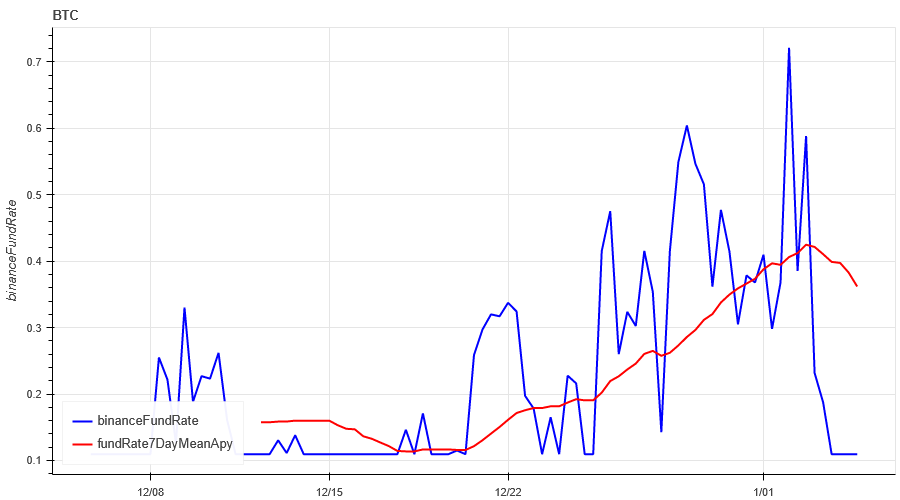
The blue line is the funding rate of BTC on Binance, and the red line is its 7-day average
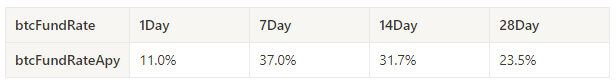
The table shows the average return of BTC fees for different holding days in the past
Market Breadth_Overall Sentiment
42% of the 129 coins selected in the past week were above the 30-day moving average, and currently more than half of the coins have fallen below the 30-day moving average.
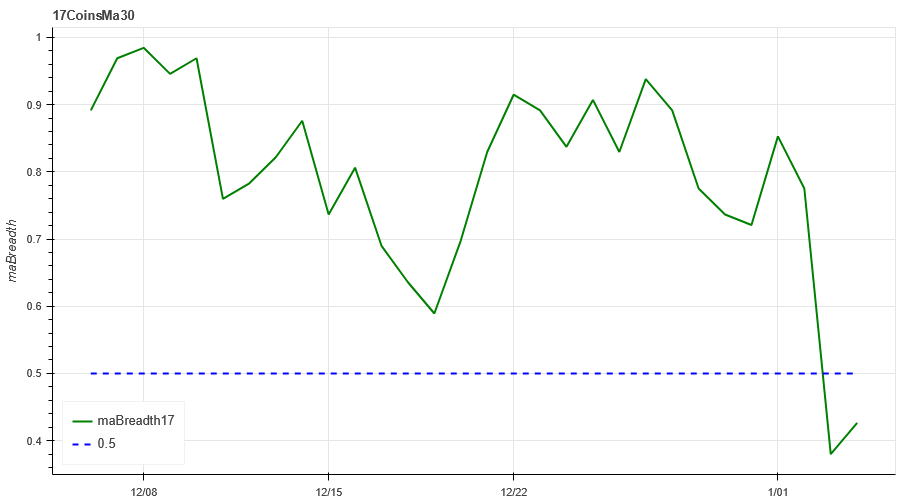
The picture above is [1000 floki, 1000 lunc, 1000 pepe, 1000 shib, 100 0x ec, 1inch, aave, ada, agix, algo, ankr, ant, ape, apt, arb, ar, astr, atom, audio, avax, axs, bal, band , bat, bch, bigtime, blur, bnb, btc, celo, cfx, chz, ckb, comp, crv, cvx, cyber, dash, dgb, doge, dot, dydx, egld, enj, ens, eos,etc, eth , fet, fil, flow, ftm, fxs, gala, gmt, gmx, grt, hbar, hot, icp, icx, imx, inj, iost, iotx, jasmy, kava, klay, ksm, ldo, link, loom, lpt , lqty, lrc, ltc, luna 2, magic, mana, matic, meme, mina, mkr, near, neo , ocean, one, ont, op, pendle, qnt, qtum, rndr, rose, rune, rvn, sand, sei, sfp, skl, snx, sol, ssv, stg, storj, stx, sui, sushi, sxp, theta , tia, trx, t, uma, uni, vet, waves, wld, woo, xem, xlm, xmr, xrp, xtz, yfi, zec, zen, zil, zrx] proportion above the 30-day moving average
Market Correlation_Consistent Sentiment
The correlation among the 46 coins selected in the past week was around 0.55, and there were divergent prices among different varieties.
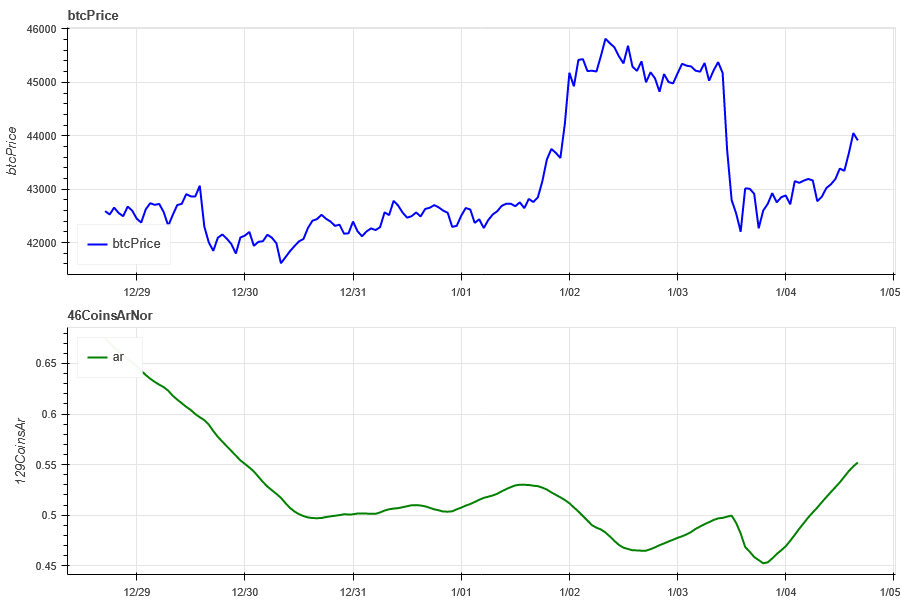
The blue line in the above picture first shows the Bitcoin price, and the green line is [1000 floki, 1000 lunc, 1000 pepe, 1000 shib, 100 0x ec, 1inch, aave, ada , agix, algo, ankr, ant, ape, apt, arb, ar, astr, atom, audio, avax, axs, bal, band, bat, bch, bigtime, blur, bnb, btc, celo, cfx, chz, ckb , comp, crv, cvx, cyber, dash, dgb, doge, dot, dydx, egld, enj, ens, eos,etc, eth, fet, fil, flow, ftm, fxs, gala, gmt, gmx, grt, hbar , hot, icp, icx, imx, inj, iost, iotx, jasmy, kava, klay, ksm, ldo, link, loom, lpt, lqty, lrc, ltc, luna 2, magic, mana, matic, meme, mina, mkr, near, neo, ocean, one, ont, op, pendle, qnt, qtum, rndr, rose, rune , rvn, sand, sei, sfp, skl, snx, sol, ssv, stg, storj, stx, sui, sushi, sxp, theta, tia, trx, t, uma, uni, vet, waves, wld, woo, xem , xlm, xmr, xrp, xtz, yfi, zec, zen, zil, zrx] overall correlation
Market Hotspots_Social Media Sentiment
The hot rotation in the past week is sei/icp/gmx/fil/arb.
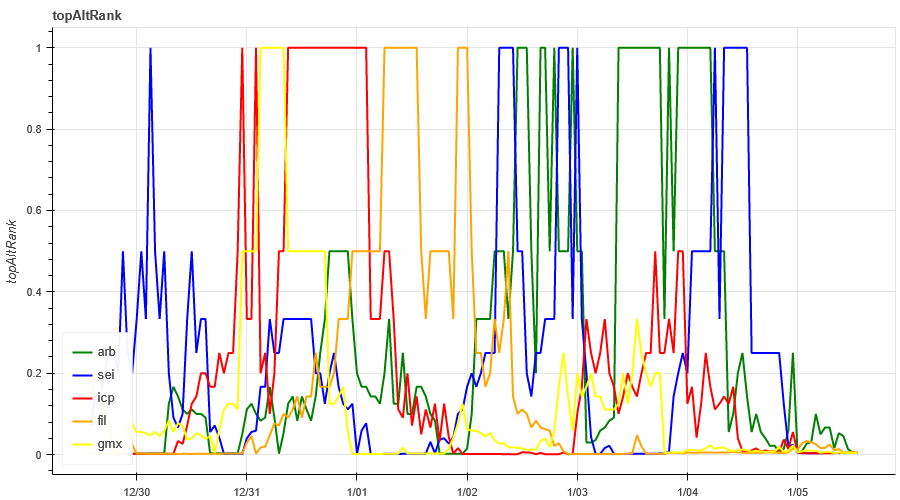
Data Sources:https://lunarcrush.com/categories/cryptocurrencies
Summarize
This week’s market trends: BTC and ETH had a sharp decline in volume on the 3rd, and at the same time, the implied volatility reached a new high; 129 Binance width indicators show that 42% of small-market coins were above the moving average this week, and the market experienced a correction; In terms of hot spots, sei/icp/gmx/fil/arb are rising in rotation; in terms of events, we are waiting for tonights non-agricultural data. Due to the large fluctuations of small coins this week, the follow-up strategy lost -0.82% in 7 days and gained 4.18% in 30 days.
Binance CopyTrading: CTA_ChannelCMT
Twitter: @DerivativesCN
Website: https://dcbot.ai/


