
加密市场情绪研究报告(12.22-12.29):2024年数据公布时间管理事件驱动策略信号
Data release time in 2024 (Beijing time)
How to apply data publication time management event-driven strategy?
The event-driven short-term signal strategy and the event-driven filtered signal strategy are two different trading strategies based on the impact of important economic data releases on the market.
Event-driven short-term signal strategy:This strategy is suitable for short-term traders such as day traders or high-frequency traders. It takes advantage of short-term market fluctuations caused by the release of important economic data and pursues quick buy or sell transactions to obtain short-term profits. Short-term traders often pay close attention to the timing of data releases and take action immediately after the release to capture instantaneous price movements.
Event-driven filtering signal strategy:This strategy is more suitable for medium and long-term trading strategies and risk management considerations. It avoids taking risks in unpredictable market fluctuations by filtering the release time of important economic data. This means that strategies will choose to avoid trading during data releases to avoid periods of higher market volatility. They will wait for the market to stabilize before re-engaging to reduce uncertainty in the trading process.
To be clear, these two strategies target different trading hours and risk appetites. The short-term signal strategy focuses on quickly capturing short-term price fluctuations and is suitable for traders with quick decision-making and execution capabilities. The signal filtering strategy focuses more on risk management and protecting capital, and is suitable for trading strategies that focus more on mid- to long-term performance.
The Bitcoin halving is about 128 days away from today (2023.12.29)
Countdown to halving:https://www.nicehash.com/countdown/btc-halving-2024-05-10-12-00?_360safeparam=1289146171
Market technical and emotional environment analysis

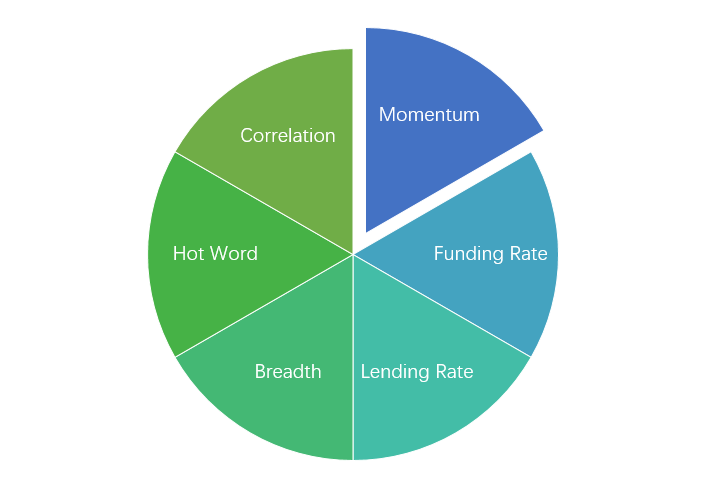
Sentiment analysis components
Technical indicators
Price trend
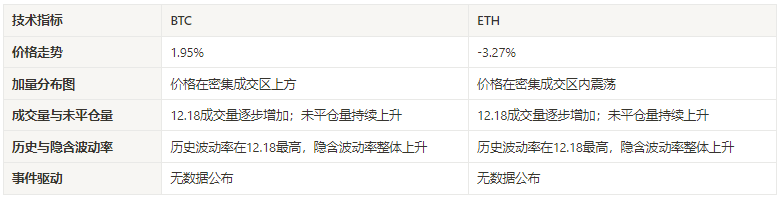
BTC price fell by -2.96% over the past week, while ETH price increased by 4.67%.
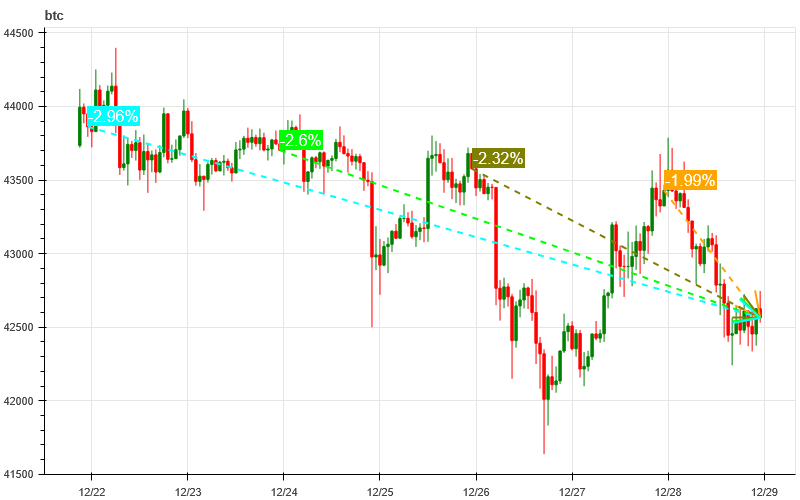
The picture above is the price chart of BTC over the past week
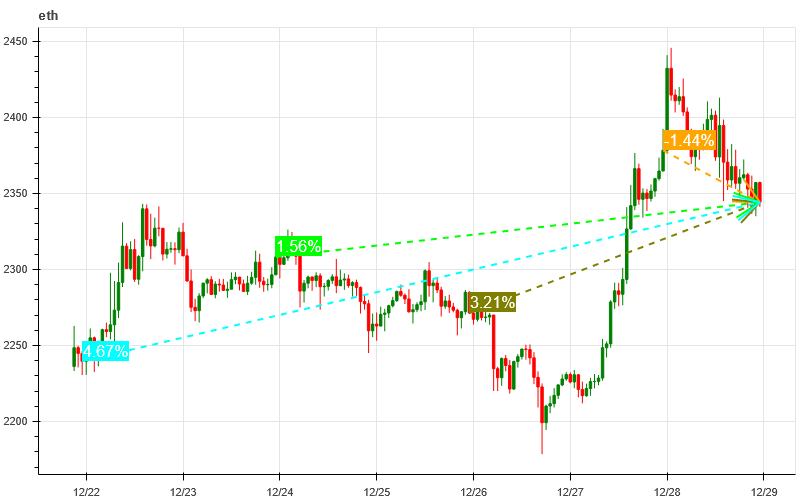
The picture above is the price chart of ETH over the past week
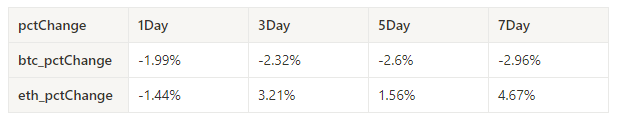
Table showing the rate of price change over the past week
Price and volume distribution chart (support and resistance)
The prices of BTC and ETH have fluctuated widely in intensive trading areas over the past week.
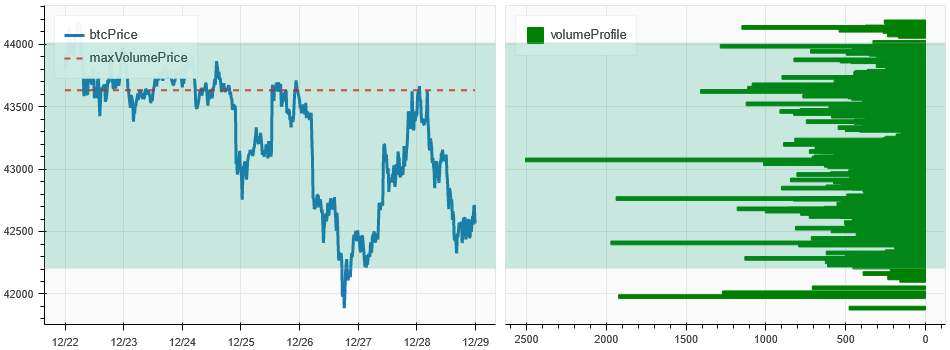
The picture above is the distribution map of BTC’s intensive trading areas in the past week.
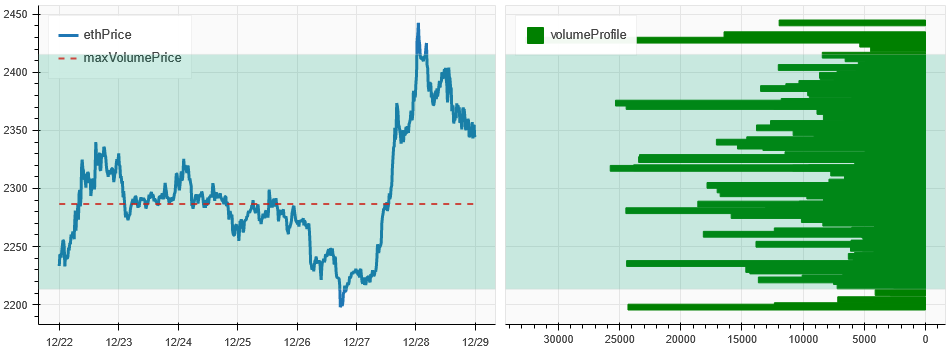
The picture above is the distribution map of ETH’s intensive trading areas in the past week.
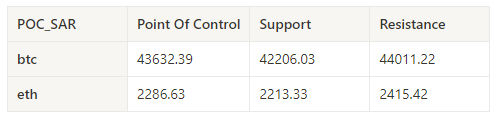
Table showing the intensive weekly trading ranges for BTC and ETH over the past week
Volume and Open Interest
In the past week, trading volume for both BTC and ETH began to increase after 12.26; open interest for BTC fell and ETH rose.
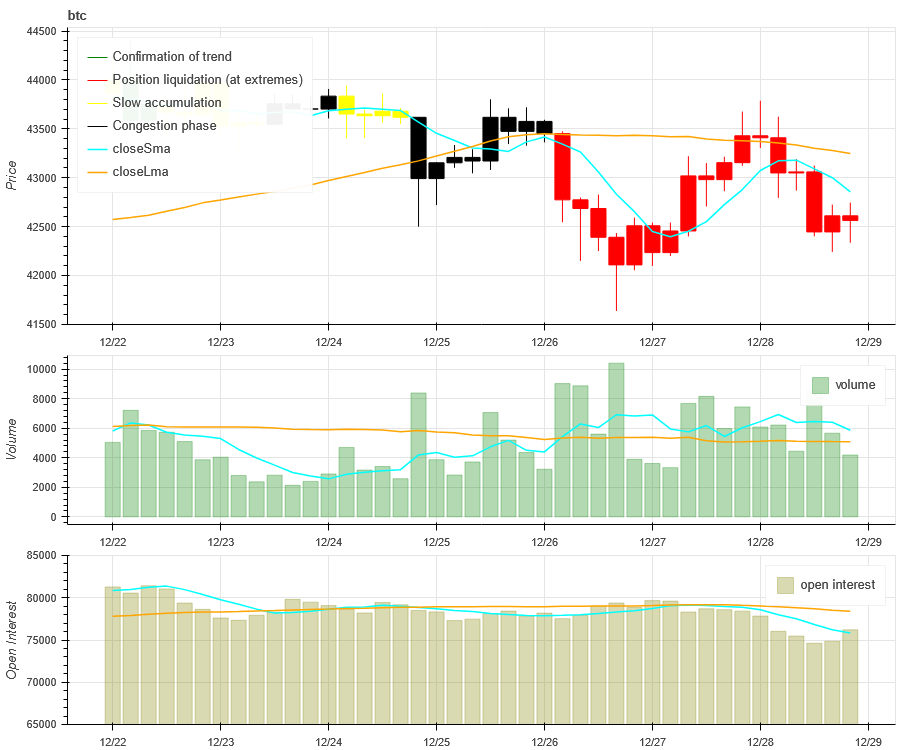
The price trend of BTC at the top of the picture above, the middle is the trading volume, the bottom is the open interest, the light blue is the 1-day average, and the orange is the 7-day average. The color of the K line represents the current status. Green means that the price rise is supported by trading volume, red means positions are being closed, yellow means positions are slowly accumulating, and black means congestion.
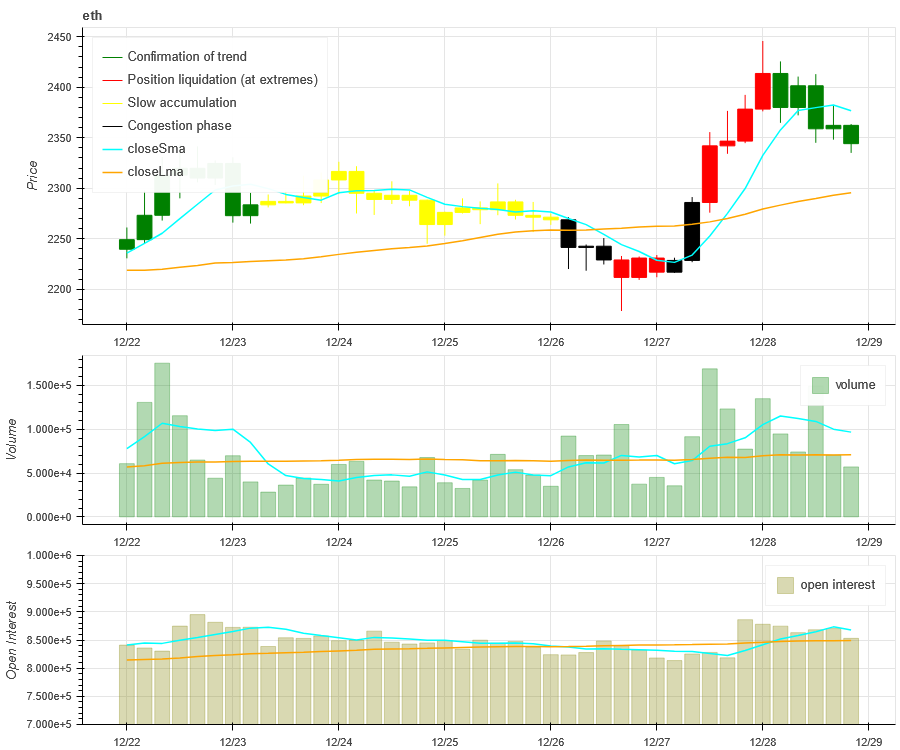
The price trend of ETH at the top of the picture above, the middle is the trading volume, the bottom is the open interest, the light blue is the 1-day average, and the orange is the 7-day average. The color of the K line represents the current status. Green means that the price rise is supported by trading volume, red means positions are being closed, yellow means positions are slowly accumulating, and black means congestion.
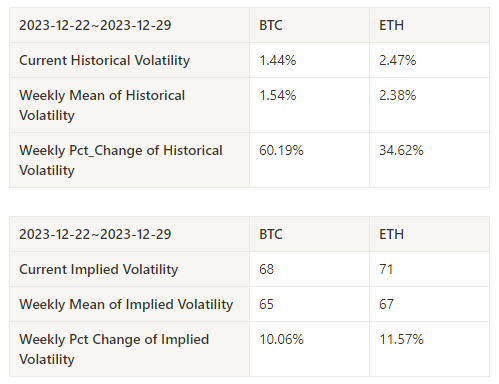
Historical Volatility vs. Implied Volatility
Historical volatility over the past week was highest for BTC at 12.26 and ETH at its highest on the 28th, with implied volatility rising overall.
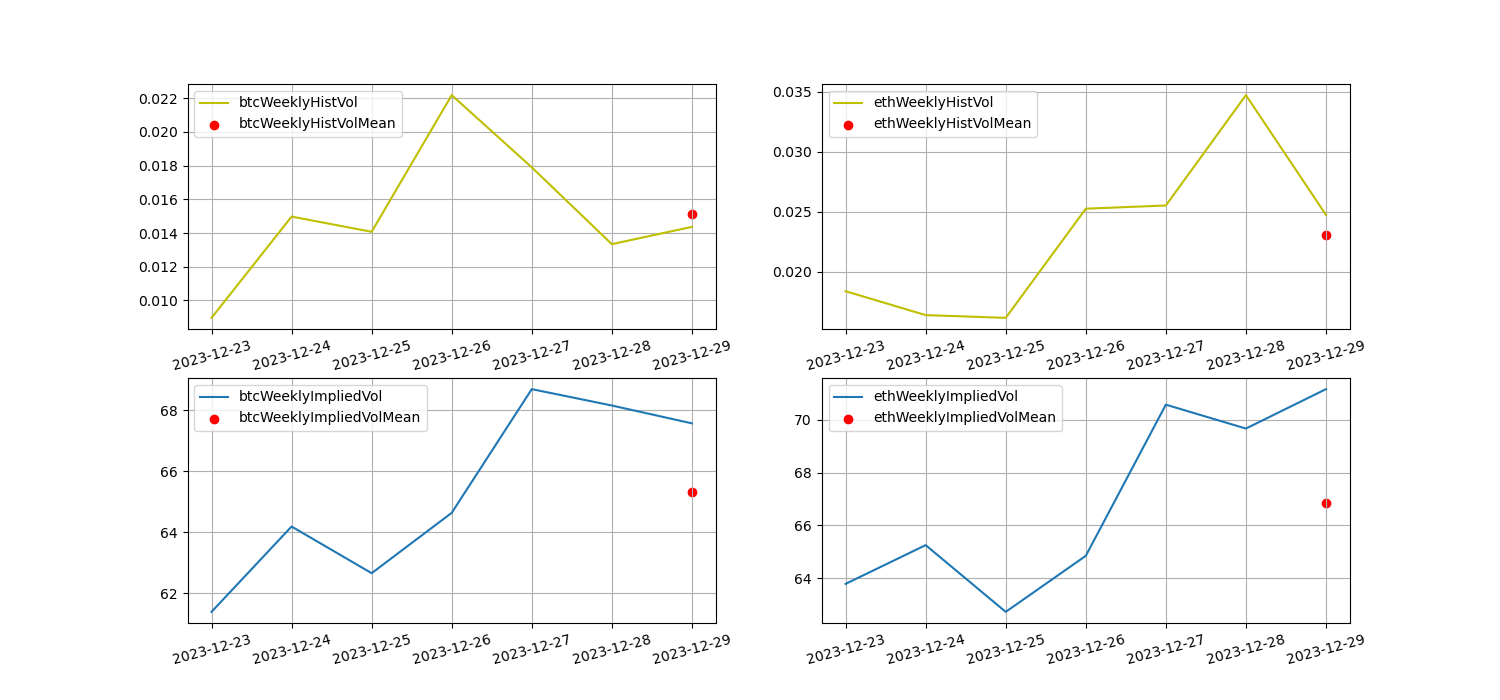
The yellow line is historical volatility, the blue line is implied volatility, and the red dot is its 7-day average
event driven
No data is released this week.
sentiment indicator
momentum sentiment
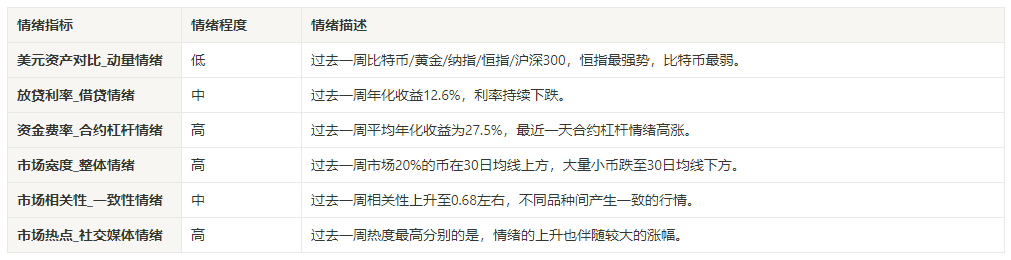
Among Bitcoin/Gold/Nasdaq/HSI/CSI 300, the Hang Seng Index was the strongest in the past week, while Bitcoin was the worst performer.
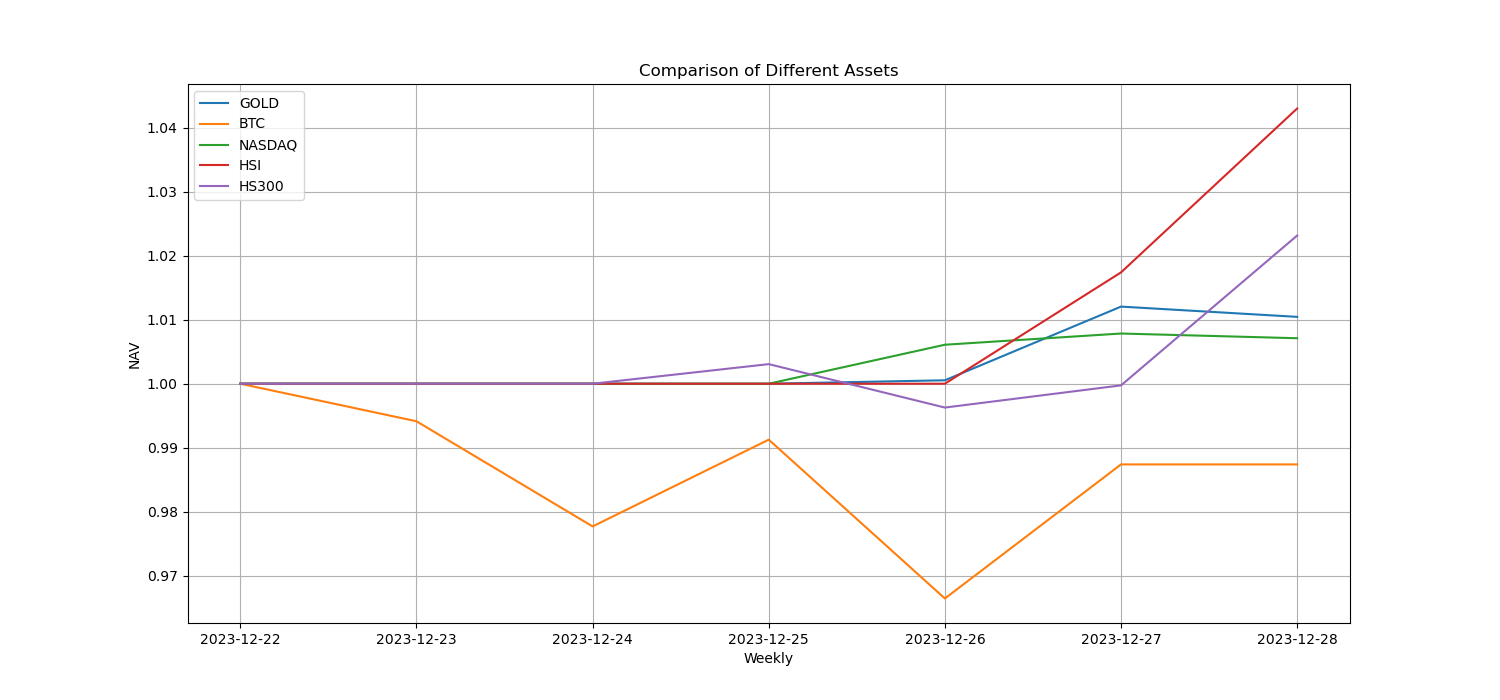
The picture above shows the trends of different assets over the past week.
Lending interest rate_Lending sentiment
The average annualized return on USD lending over the past week was 12.6%, and interest rates continued to fall.
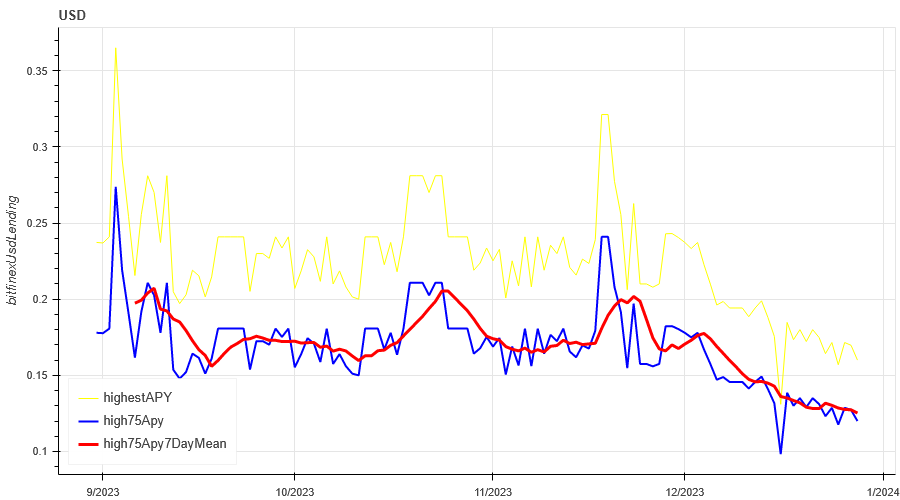
The yellow line is the highest price of the USD interest rate, the blue line is 75% of the highest price, and the red line is the 7-day average of 75% of the highest price
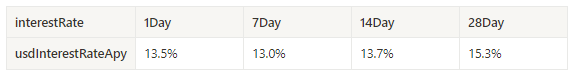
The table shows the average return of USD interest rate for different holding days in the past
Funding Rate_Contract Leverage Sentiment
The average annualized return on BTC rates over the past week was 27.5%, and contract leverage sentiment was high in the last day.
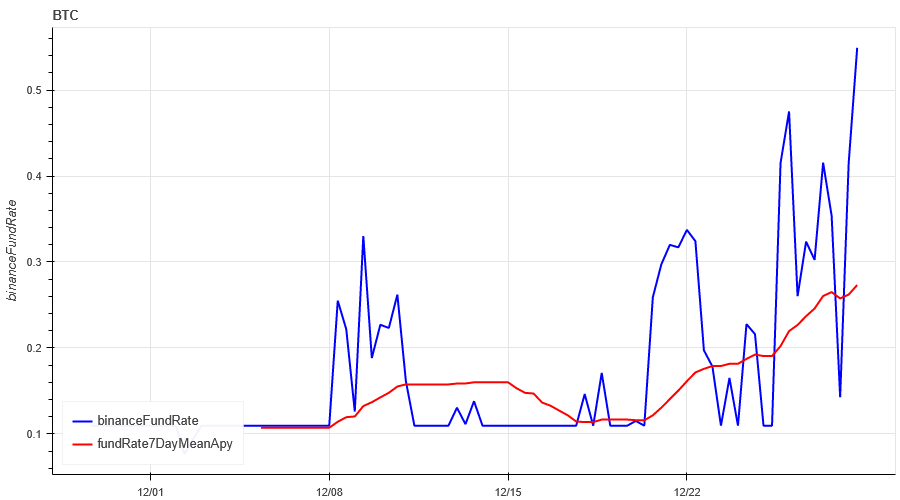
The blue line is the funding rate of BTC on Binance, and the red line is its 7-day average
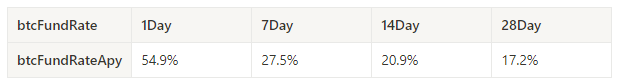
The table shows the average return of BTC fees for different holding days in the past
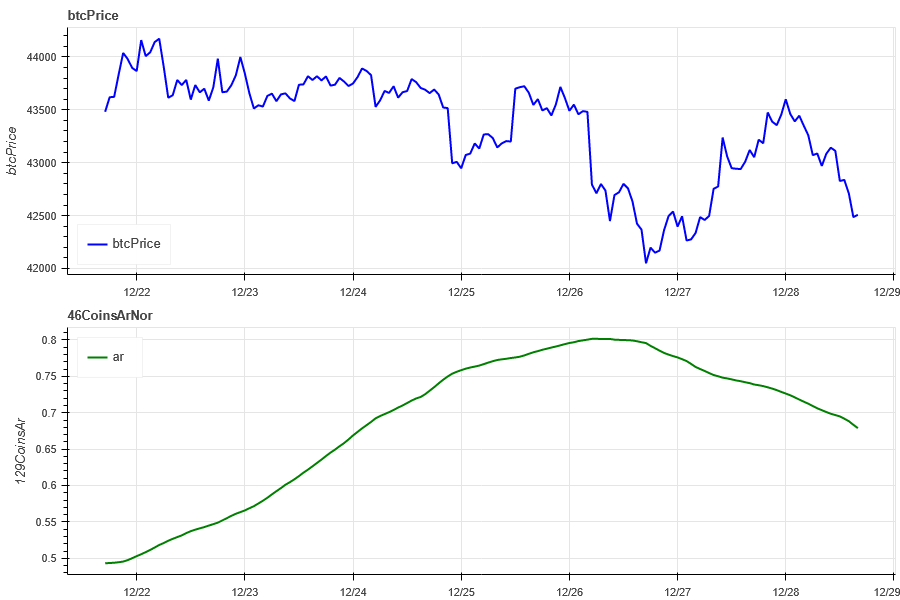
Market Breadth_Overall Sentiment
20% of the 129 active coins selected in the past week were above the 30-day moving average, and most of the coins are currently falling below the 30-day moving average.
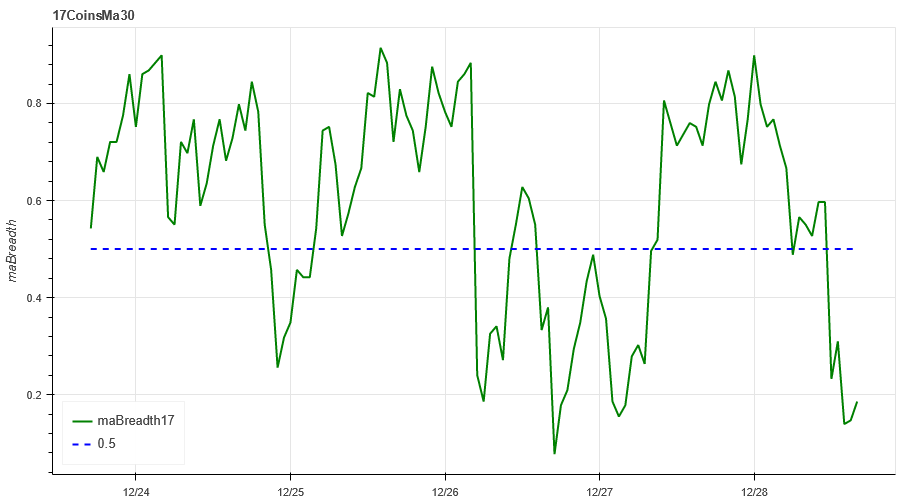
The picture above is [1000 floki, 1000 lunc, 1000 pepe, 1000 shib, 100 0x ec, 1inch, aave, ada, agix, algo, ankr, ant, ape, apt, arb, ar, astr, atom, audio, avax, axs, bal, band , bat, bch, bigtime, blur, bnb, btc, celo, cfx, chz, ckb, comp, crv, cvx, cyber, dash, dgb, doge, dot, dydx, egld, enj, ens, eos,etc, eth , fet, fil, flow, ftm, fxs, gala, gmt, gmx, grt, hbar, hot, icp, icx, imx, inj, iost, iotx, jasmy, kava, klay, ksm, ldo, link, loom, lpt , lqty, lrc, ltc, luna 2, magic, mana, matic, meme, mina, mkr, near, neo , ocean, one, ont, op, pendle, qnt, qtum, rndr, rose, rune, rvn, sand, sei, sfp, skl, snx, sol, ssv, stg, storj, stx, sui, sushi, sxp, theta , tia, trx, t, uma, uni, vet, waves, wld, woo, xem, xlm, xmr, xrp, xtz, yfi, zec, zen, zil, zrx] proportion above the 30-day moving average
Market Correlation_Consistent Sentiment
The correlation among the 46 coins selected in the past week has increased to around 0.68, resulting in more consistent prices among different varieties.
The blue line in the above picture first shows the Bitcoin price, and the green line is [1000 floki, 1000 lunc, 1000 pepe, 1000 shib, 100 0x ec, 1inch, aave, ada , agix, algo, ankr, ant, ape, apt, arb, ar, astr, atom, audio, avax, axs, bal, band, bat, bch, bigtime, blur, bnb, btc, celo, cfx, chz, ckb , comp, crv, cvx, cyber, dash, dgb, doge, dot, dydx, egld, enj, ens, eos,etc, eth, fet, fil, flow, ftm, fxs, gala, gmt, gmx, grt, hbar , hot, icp, icx, imx, inj, iost, iotx, jasmy, kava, klay, ksm, ldo, link, loom, lpt, lqty, lrc, ltc, luna 2, magic, mana, matic, meme, mina, mkr, near, neo, ocean, one, ont, op, pendle, qnt, qtum, rndr, rose, rune , rvn, sand, sei, sfp, skl, snx, sol, ssv, stg, storj, stx, sui, sushi, sxp, theta, tia, trx, t, uma, uni, vet, waves, wld, woo, xem , xlm, xmr, xrp, xtz, yfi, zec, zen, zil, zrx] overall correlation
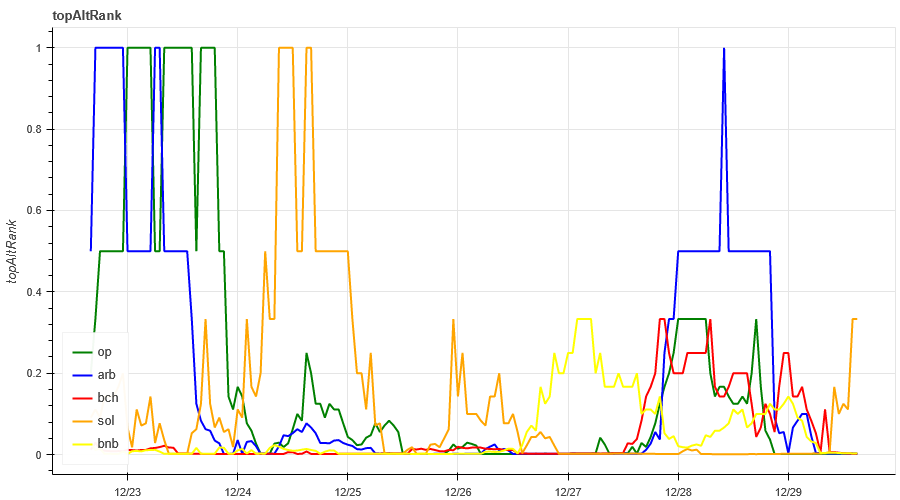
Market Hotspots_Social Media Sentiment
The popular rotations in the past week are arb/op/sol/bnb/bch, respectively.
Data Sources:https://lunarcrush.com/categories/cryptocurrencies
Summarize
The market price of BTC this week fluctuated and fell, while ETH had a rise on the 28th, and the implied volatility increased compared with last week. The 129 Binance width indicators showed that 80% of small market capitalization coins fell below the 30-day moving average this week; in terms of hot spots, arb /op/sol/bnb/bch has been rotating upward; in terms of events, we are waiting for the Federal Reserve interest rate meeting next month. Due to the large fluctuations of small coins this week, the follow-up strategy suffered a loss of -6.5% in 7 days and a gain of 13% in 30 days.
Binance CopyTrading: CTA_ChannelCMT
Twitter: @DerivativesCN
Website: https://dcbot.ai/


