
LD Capital Macro Weekly Report (12.11): Everything is fine, will the FOMC honor the increase? The time for downside protection has arrived

Market overview
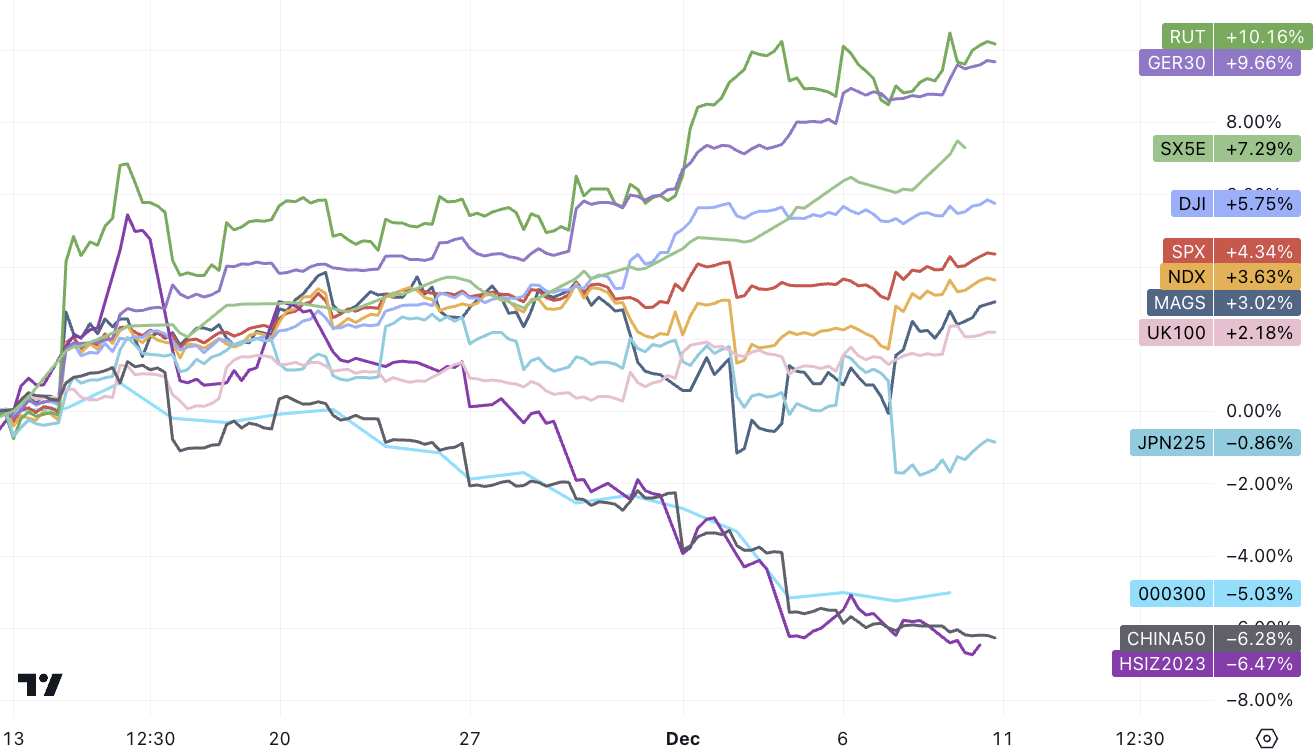
European and U.S. stocks performed strongly last week, and the higher-than-expected non-farm payrolls only caused slight fluctuations. In the end, U.S. stocks closed up on the day; Chinese and Japanese stock markets lagged behind, China was mainly due to Moodys downgrading of its rating outlook, and Japanese stocks were due to the sharp appreciation of the yen; the Federal Reserve The imminent turn to stable interest rates could be a catalyst for a rotation of winners to laggards this year, with the Magnificent 7 trailing small-cap gains by 7% over the past three weeks, with the wide valuation gap creating catch-up opportunities for lagging markets:
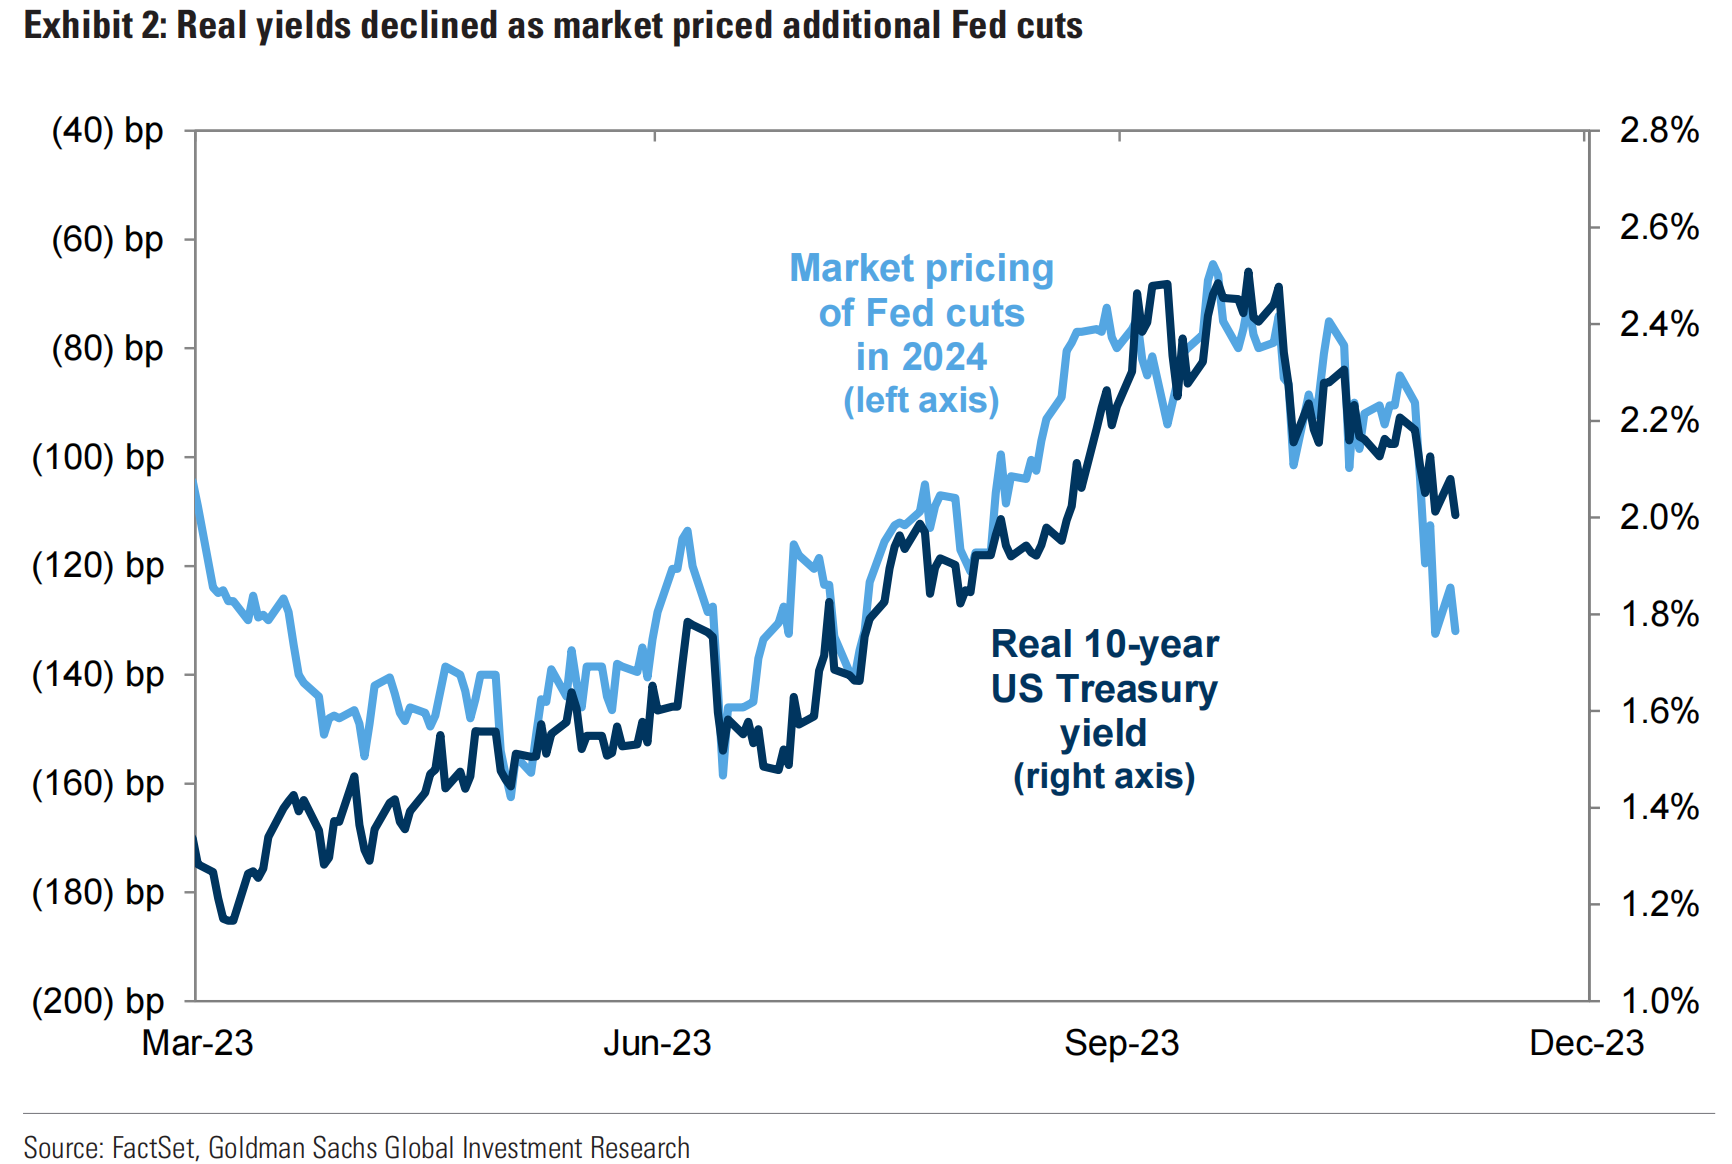
The decline in bond yields has been accompanied by improved expectations for economic growth in risk asset markets, and investors in stocks, including cryptocurrencies, do not appear to equate further Fed easing with increased odds of a recession, goldiloc sentiment has spread recently, and lower real Yields and stronger stock markets pricing in economic growth typically lead to the strongest stock return cycles.
But risk appetite is likely to fall before rising due to economic weakness heading into early 2024 and an overpriced interest rate market. Opportunities for bonds and their alternatives, such as traditional defensive sectors, will first arise in early 2024 when the economy enters a soft phase, and then as growth picks up again, investment opportunities in small-cap stocks as well as growth stocks may re-emerge later.
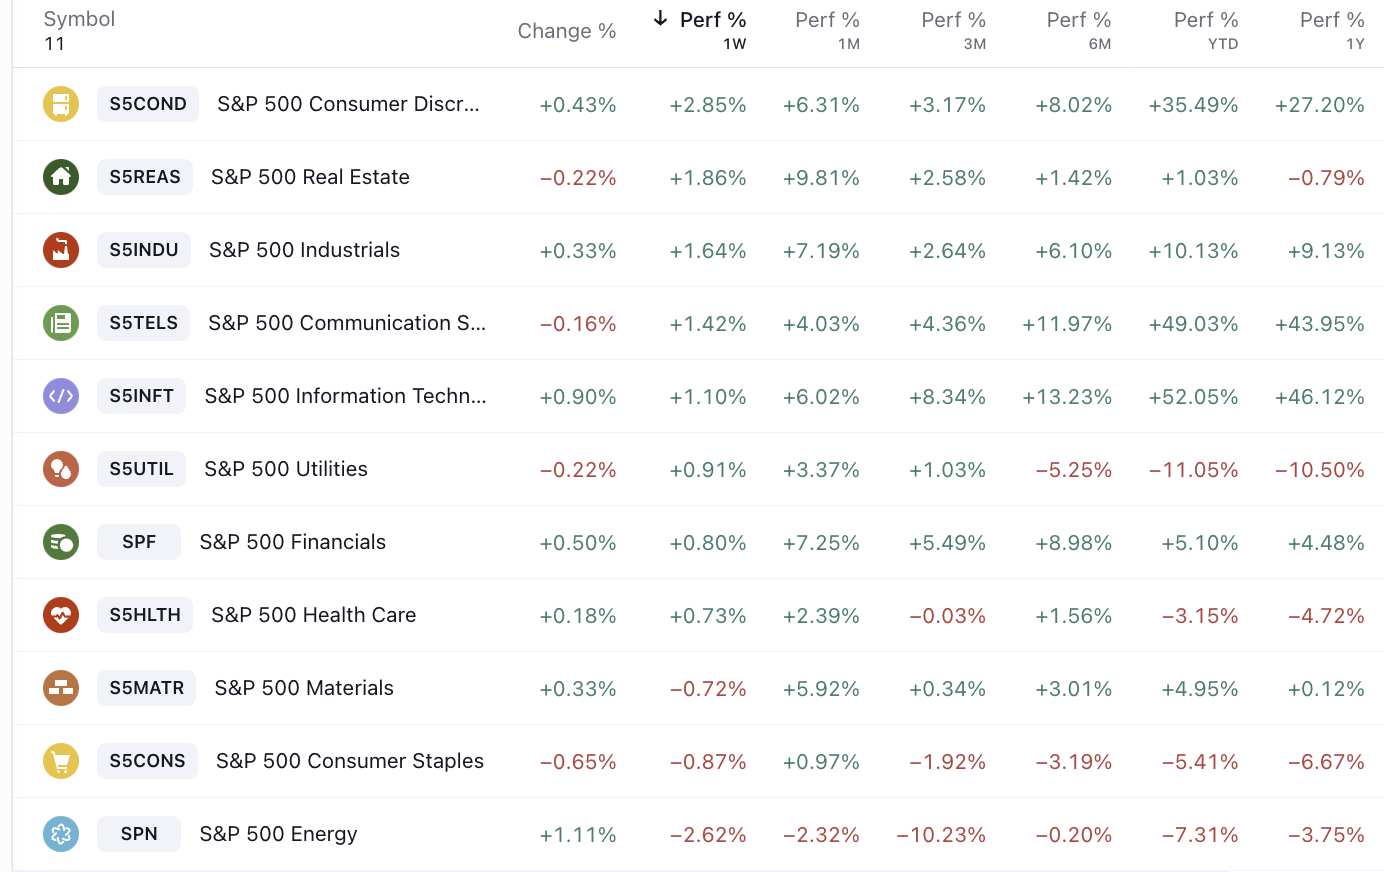
The best performers last week were still the industries with high loan dependence and interest rate sensitivity, including consumer discretionary and real estate:
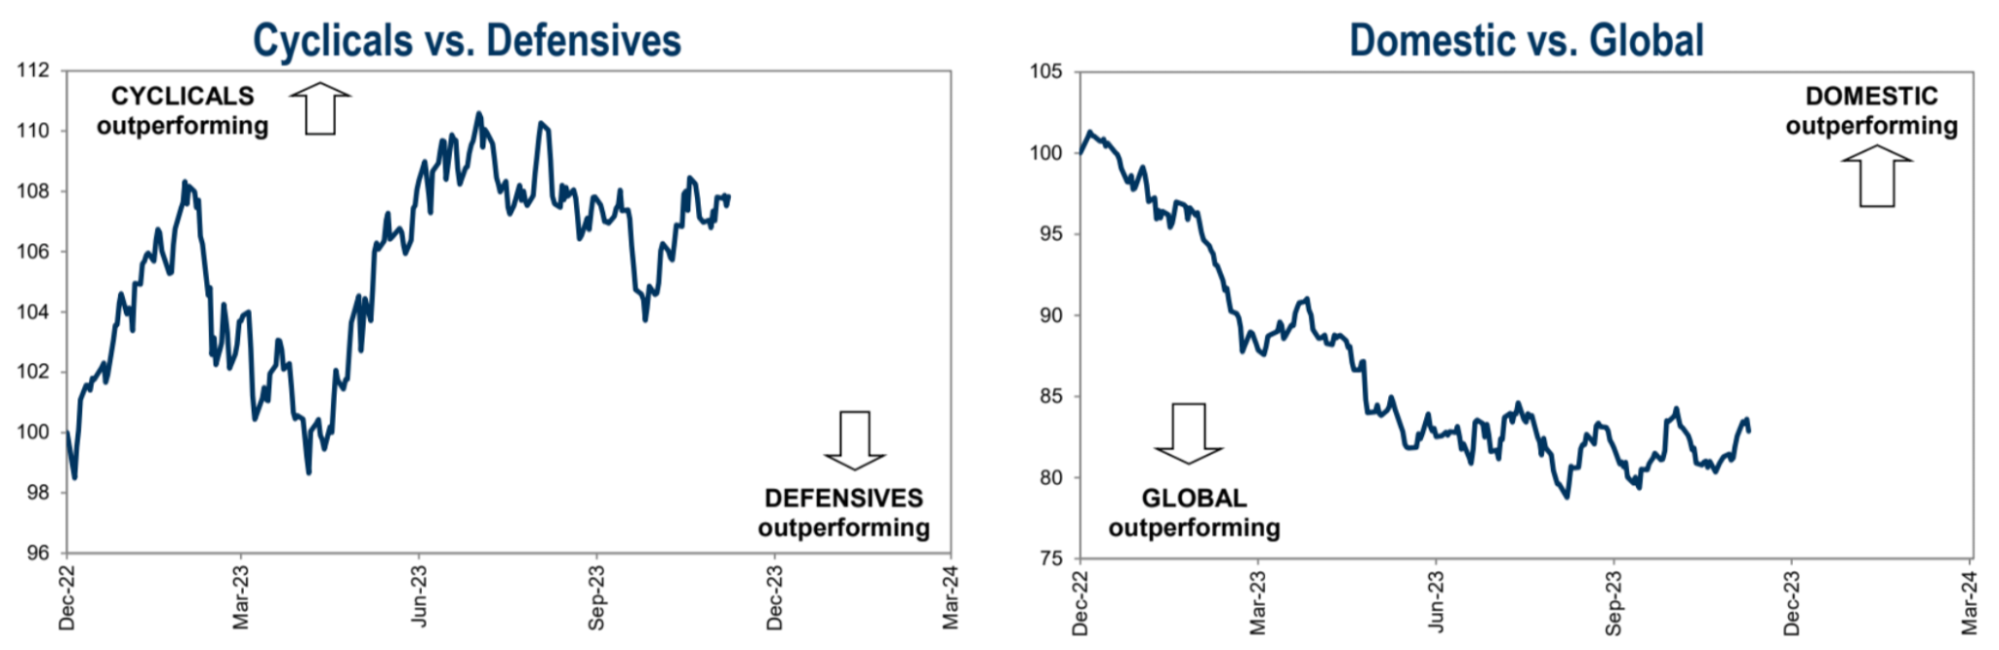
In recent weeks, the relationship between the strength of cyclical stocks and defensive stocks has been at a standoff, with U.S. stocks slightly outperforming the world:
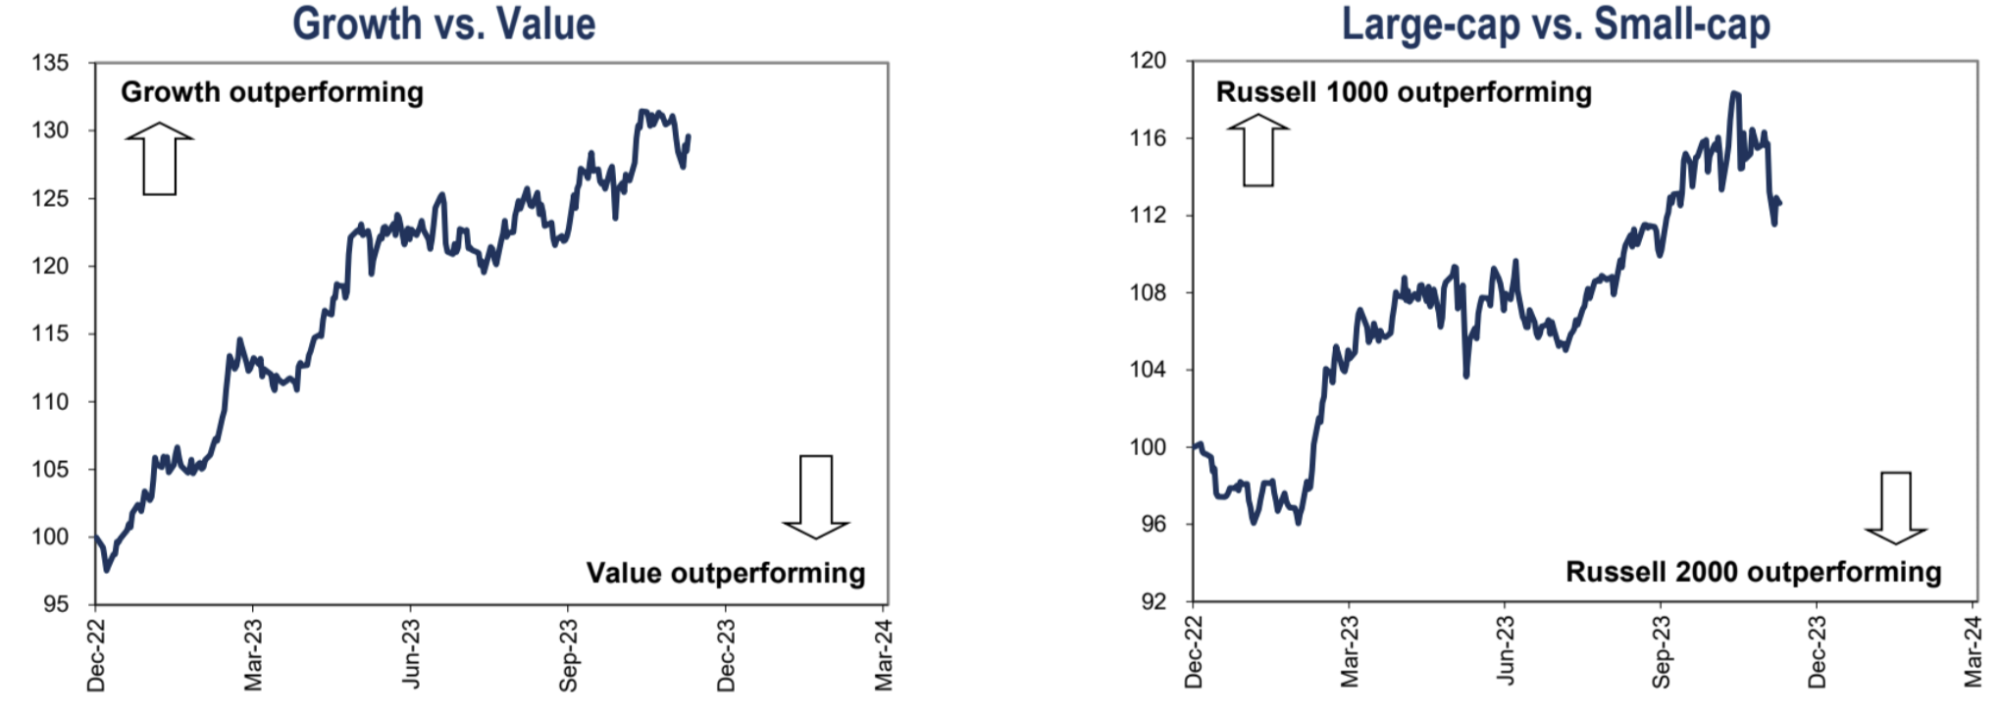
Growth and value stocks have seen a reversal in trend in recent weeks. Growth stocks started to fall and value stocks started to rebound. However, such a reversal of momentum is not as obvious as the trend reversal of large-cap stocks and small-cap stocks. Combining the position data, we can see that the market has a strong risk sentiment, and is covering positions in small stocks, and is unwilling to give up on high growth:
The SP 500s 11% gain in the latest month has been driven largely by valuation expansion, not by improving earnings fundamentals. The SPX equal-weighted P/E ratio is at a modest 15 times, up from 14 times; while the standardized P/E ratio is at 18.7 times, up from 17 times, just below Julys high. :
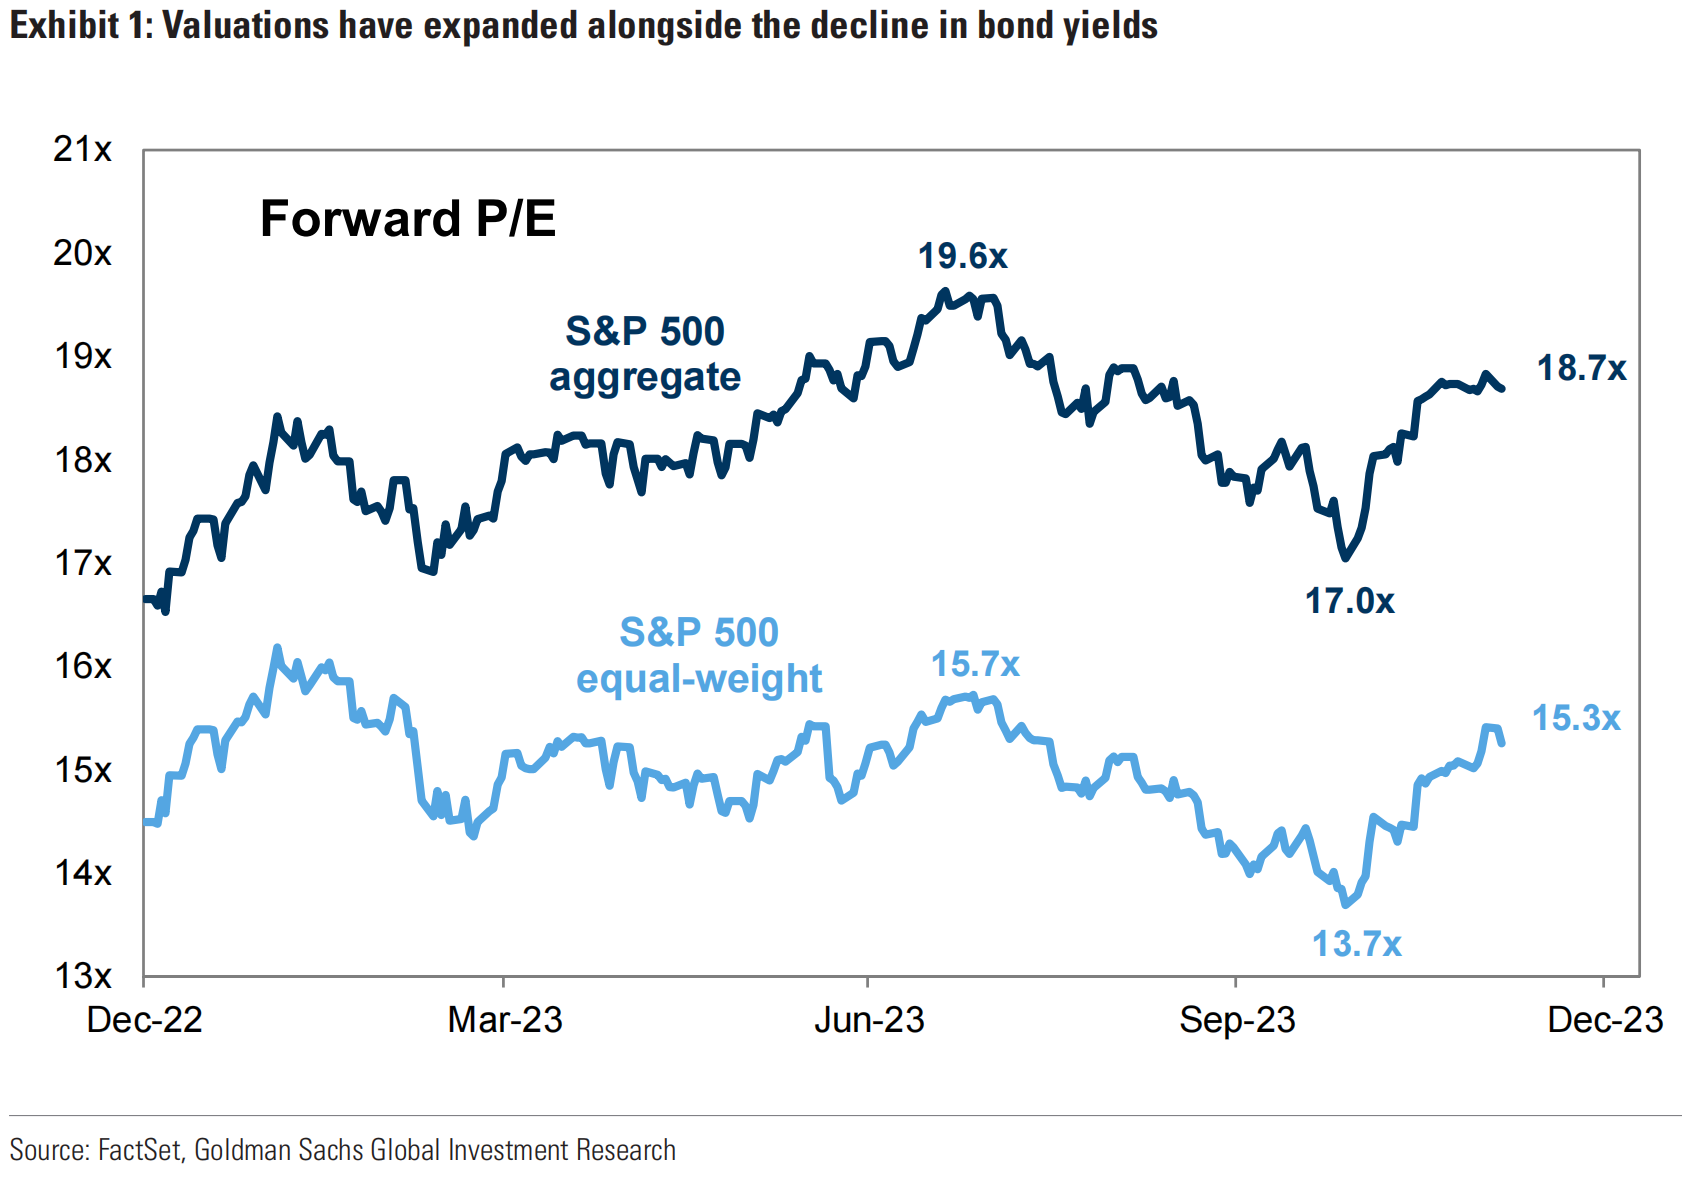
Falling Real Yields: As real yields (i.e. interest rates adjusted for inflation) fall, the cost of funding becomes cheaper in the market, pushing up stock prices:
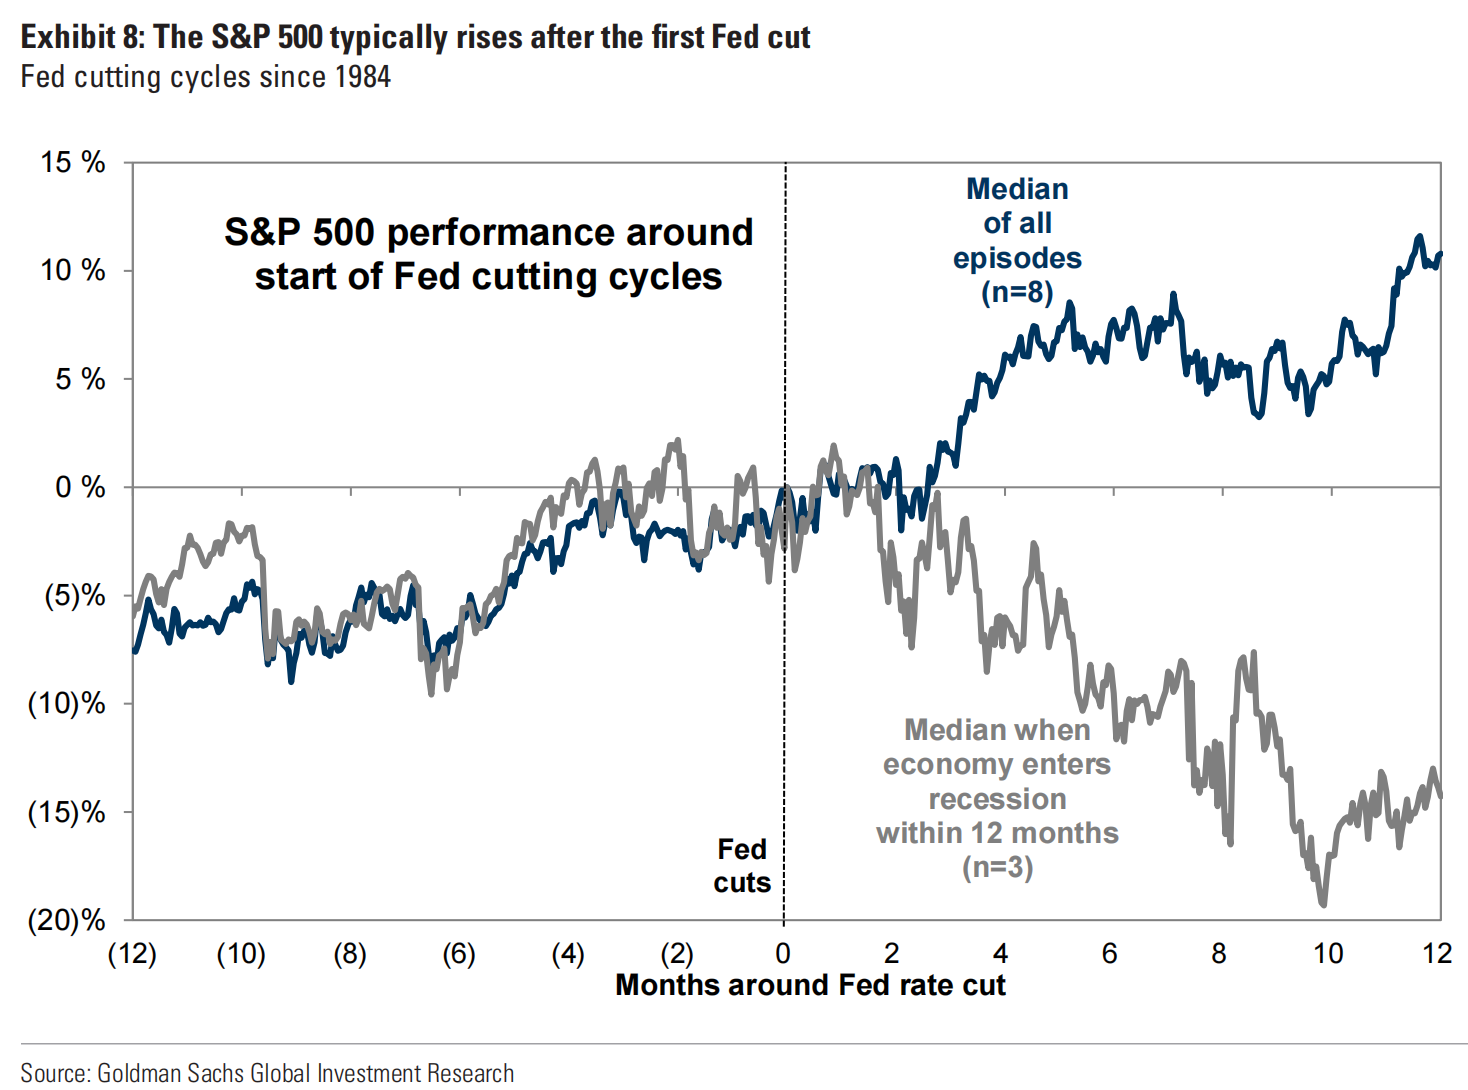
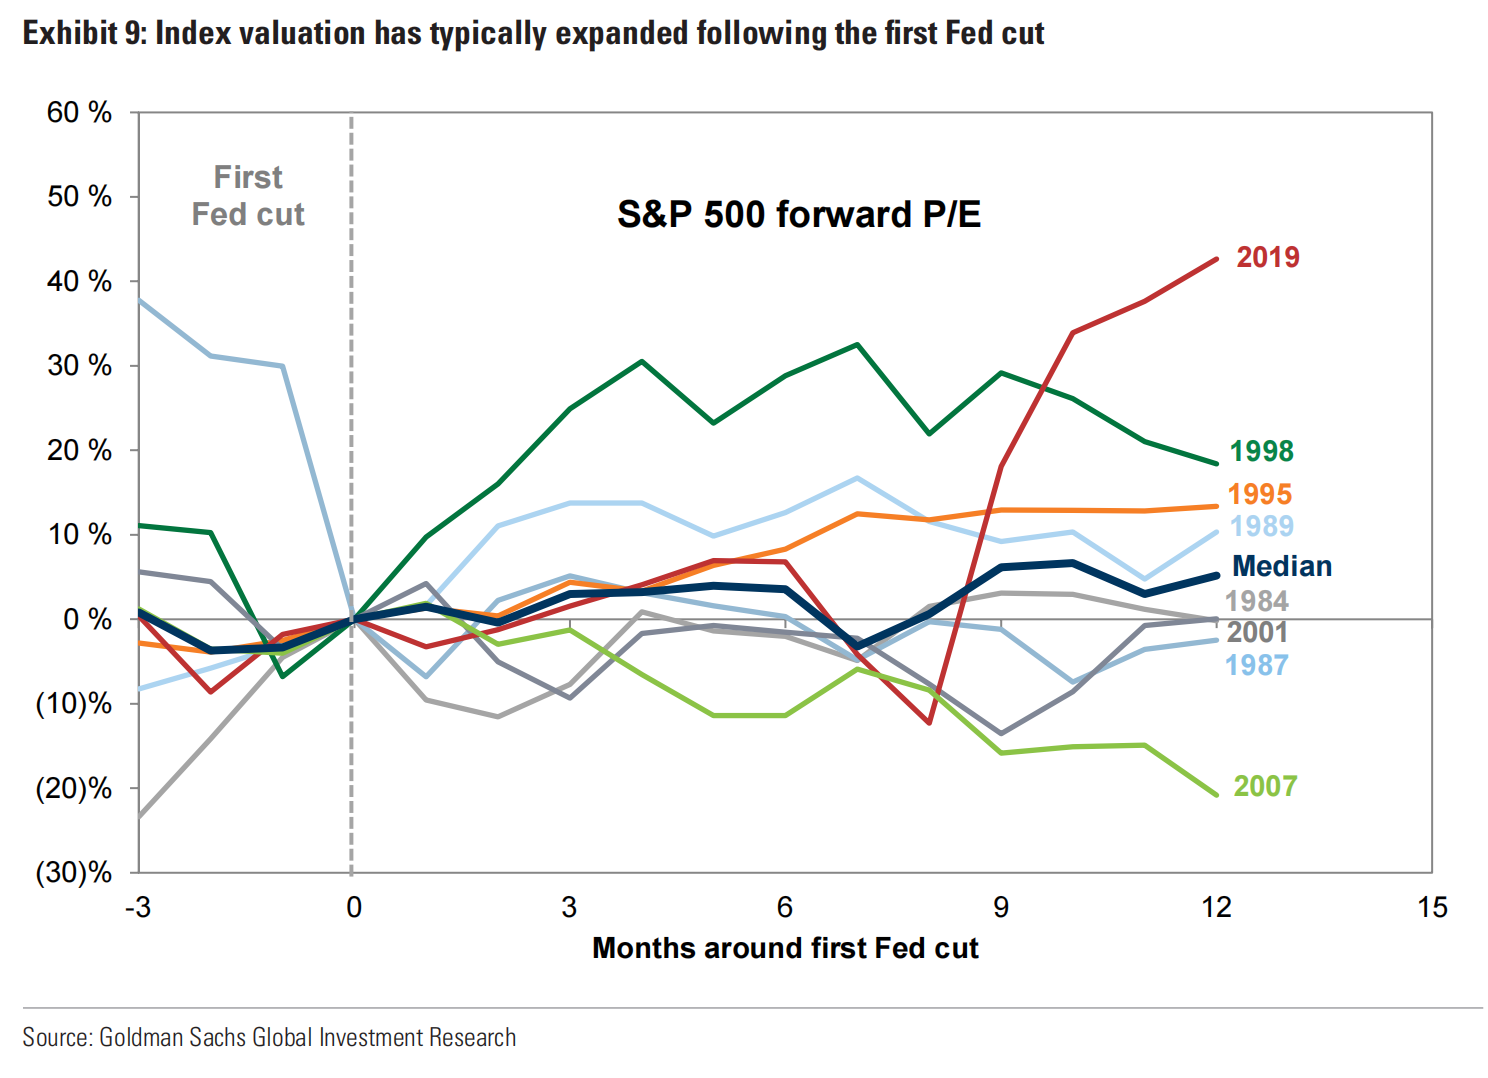
Historical data shows that valuations and prices typically rise after the Fed ends its rate hike cycle, but economic growth remains the deciding factor. Over the past eight Fed rate-cutting cycles since 1984, the SP 500 has typically risen 2% in the first three months after the first rate cut and 11% over the subsequent 12 months. Expectations of an imminent Fed rate cut mean stock markets typically rise ahead of the first rate cut. However, the results are spread over a wide range, with subsequent 12-month gains and losses ranging from +21% (1995) to -24% (2007).
The economic background of the United States in 1995 was:
Economic growth slowed but was good in absolute terms, with GDP growth falling from 4.0% in 1994 to 3.0%.
Inflation increased but was not high in absolute terms, with year-on-year CPI growth rising from 2.8% in 1994 to 3.0%.
Unemployment fell, with the unemployment rate falling from 5.5% in 1994 to 5.2%.
The economic background of the United States in 2007:
Economic growth slowed, with GDP growth falling to 2.2% from 2.6% in 2006.
Inflation increased, with year-on-year CPI growth rising from 3.2% in 2006 to 4.0%.
Unemployment rose, with the unemployment rate rising to 5.1% from 4.6% in 2006.
Compare 2023 Economic Background
The U.S. GDP growth rate in 2023 is expected to be 2.1%, the same as in 2022;
The U.S. CPI year-on-year growth rate in 2023 is expected to drop to 3.3%, a significant decrease from 7.9% in 2022
The U.S. unemployment rate is expected to be 3.9% in 2023, essentially the same as 3.8% in 2022
The Federal Reserve began raising interest rates in February 1995 to curb inflation. However, as signs of slowing economic growth became increasingly apparent, the Federal Reserve stopped raising interest rates in July 1995 and began cutting interest rates in August 1995. The economy was generally healthy, and major technological advances occurred in the mid-1990s. (Computing and the Internet), so the stock market surged before and after the rate cut. Expectations of interest rate cuts earlier in 2007 boosted market sentiment, which combined with the housing bubble led to a sharp rise in the stock market in the first half of 2007. However, with the onset of the subprime mortgage crisis and economic recession, investors began to realize that cutting interest rates would not solve the underlying problem, and the stock market began to decline.
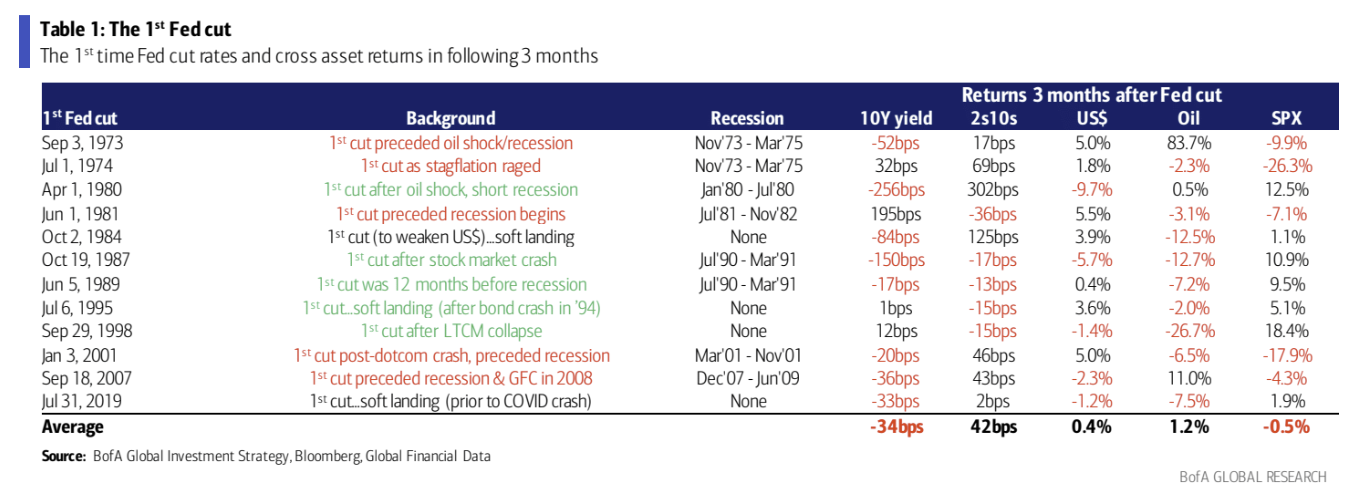
So recessions remain the key issue: stocks have historically underperformed when recessions occur shortly after the first Fed rate cut, which has happened 3 times out of 8 cycles:
If you feel that the stock market is difficult to predict, you can consider the treasury bond market. Historically, there is an 8/12 probability that yields will fall three months after an interest rate cut, with an average drop of 34 bp, and an average drop of 15 bp in the three months before an interest rate cut. It can be seen that this asset Greater certainty:
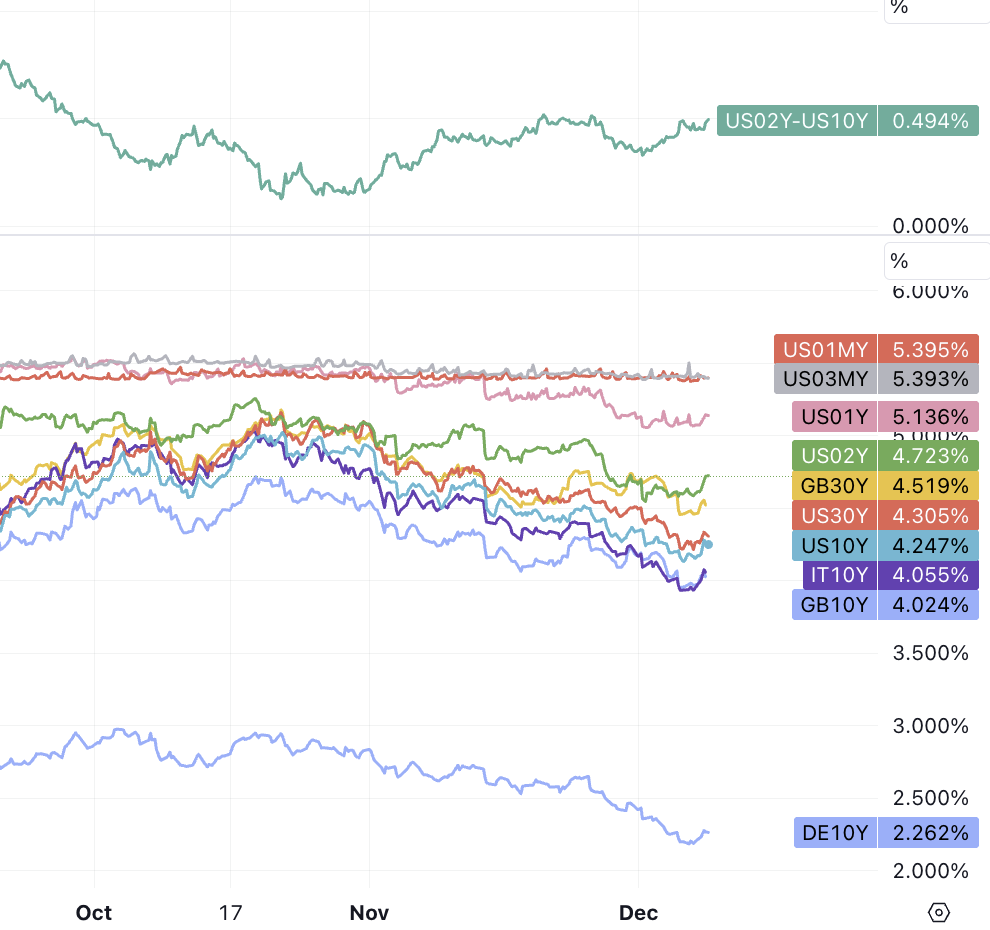
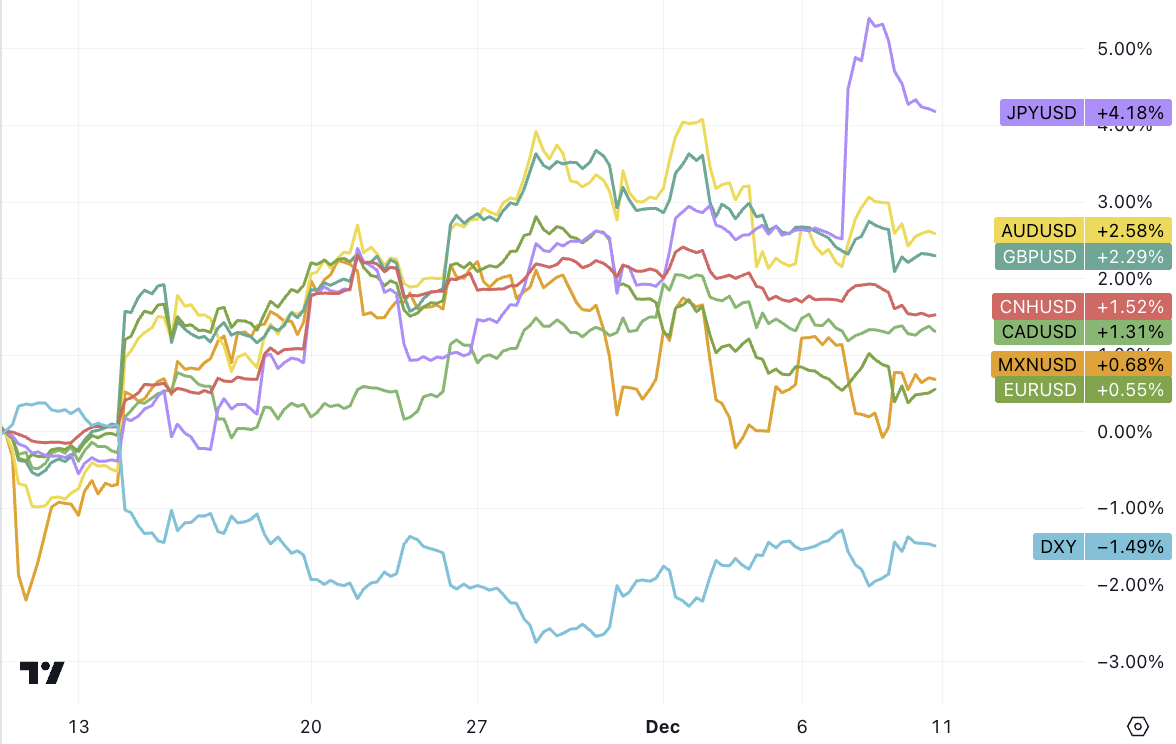
Market yields rebounded slightly late last week due to higher-than-expected NFP and consumer confidence surveys. The inversion of the yield curve deepened, and the US dollar received some support. However, the Bank of Japan raised interest rates, and the Japanese yen once strengthened sharply by 4% against the US dollar index. There was considerable pressure, but because many people were not optimistic about the negative impact of Japans economy and interest rate hikes, USDJPY only fell 1.14% for the whole week:
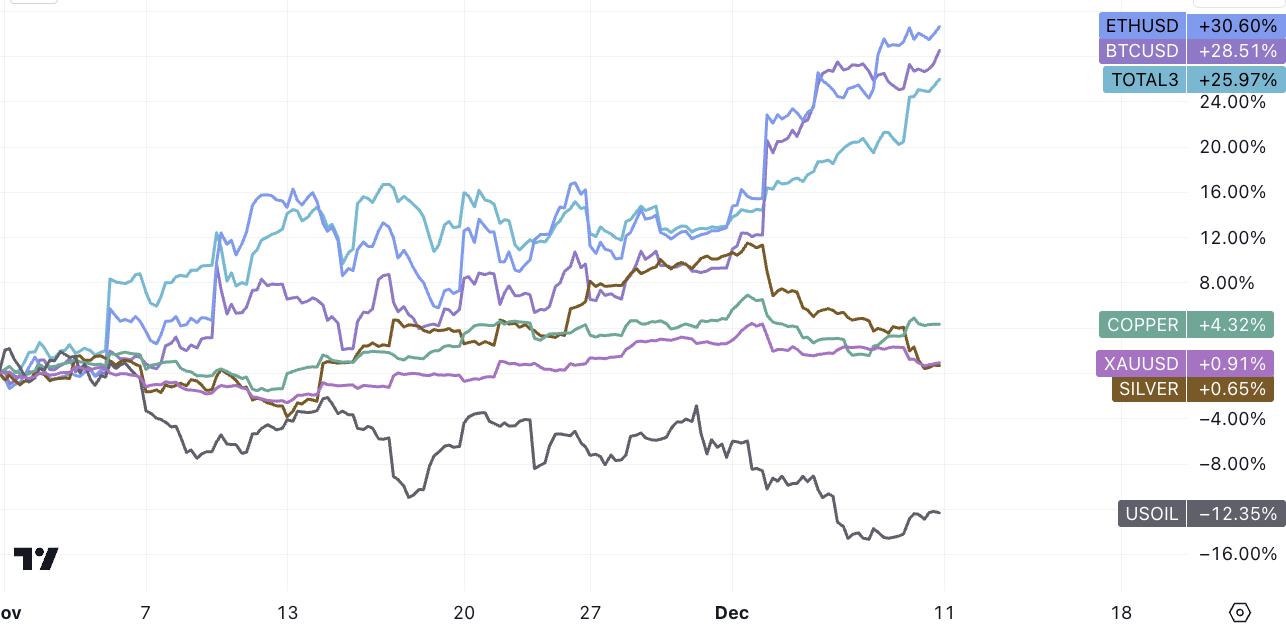
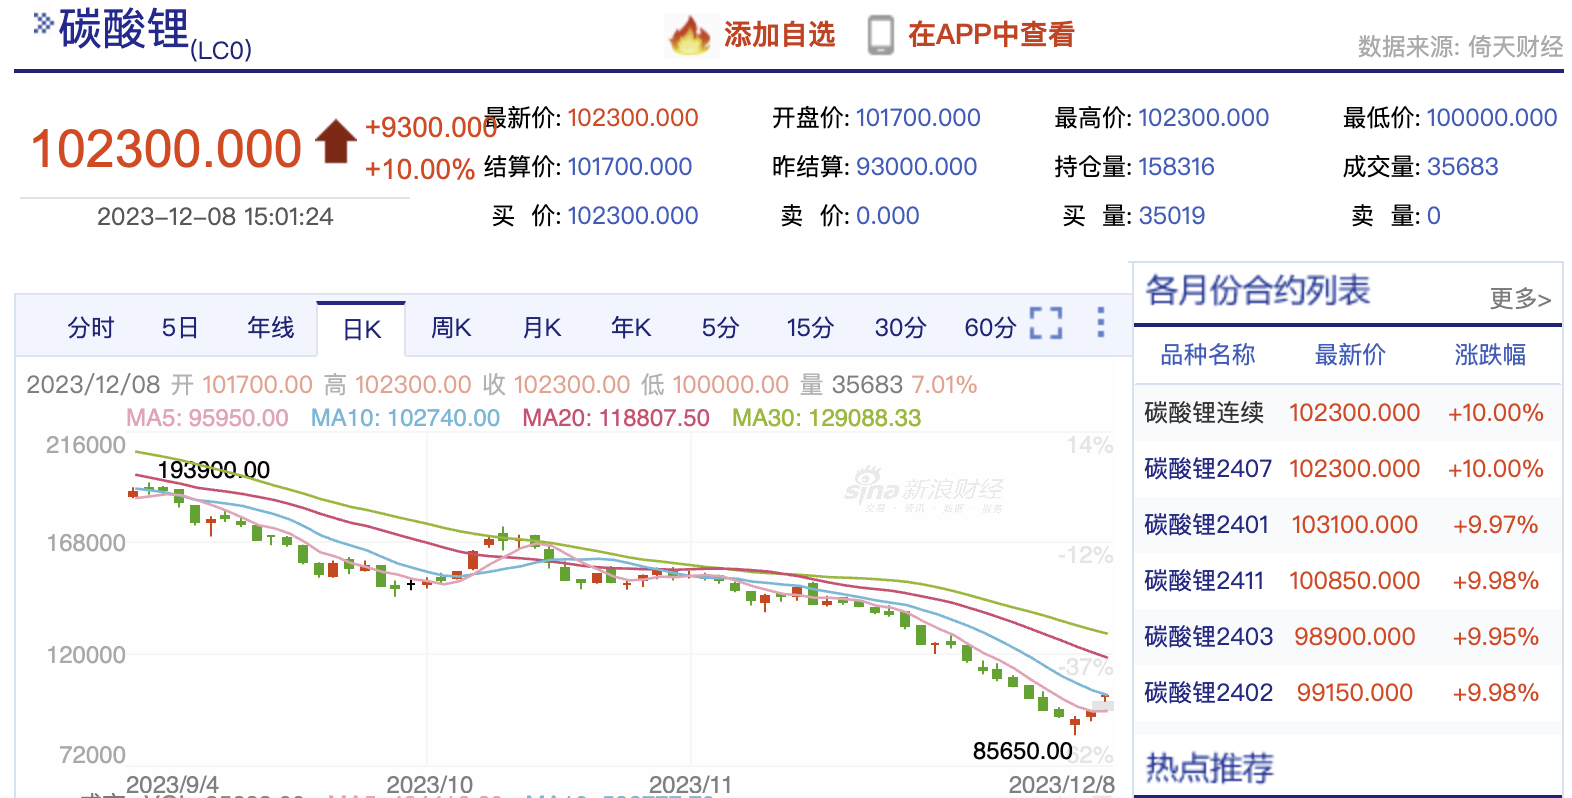
Digital currencies continue to remain strong, but last week the increase in alts (+8%) exceeded that of BTC and ETH (+6%) for the first time in four weeks, showing that the originally concentrated hype has spread; gold fell 3.4% for the whole week , oil prices fell again, but coal, iron ore, and lithium mines rose. Chinas lithium carbonate futures contract rose by the limit for two consecutive days, and there seemed to be a short squeeze:
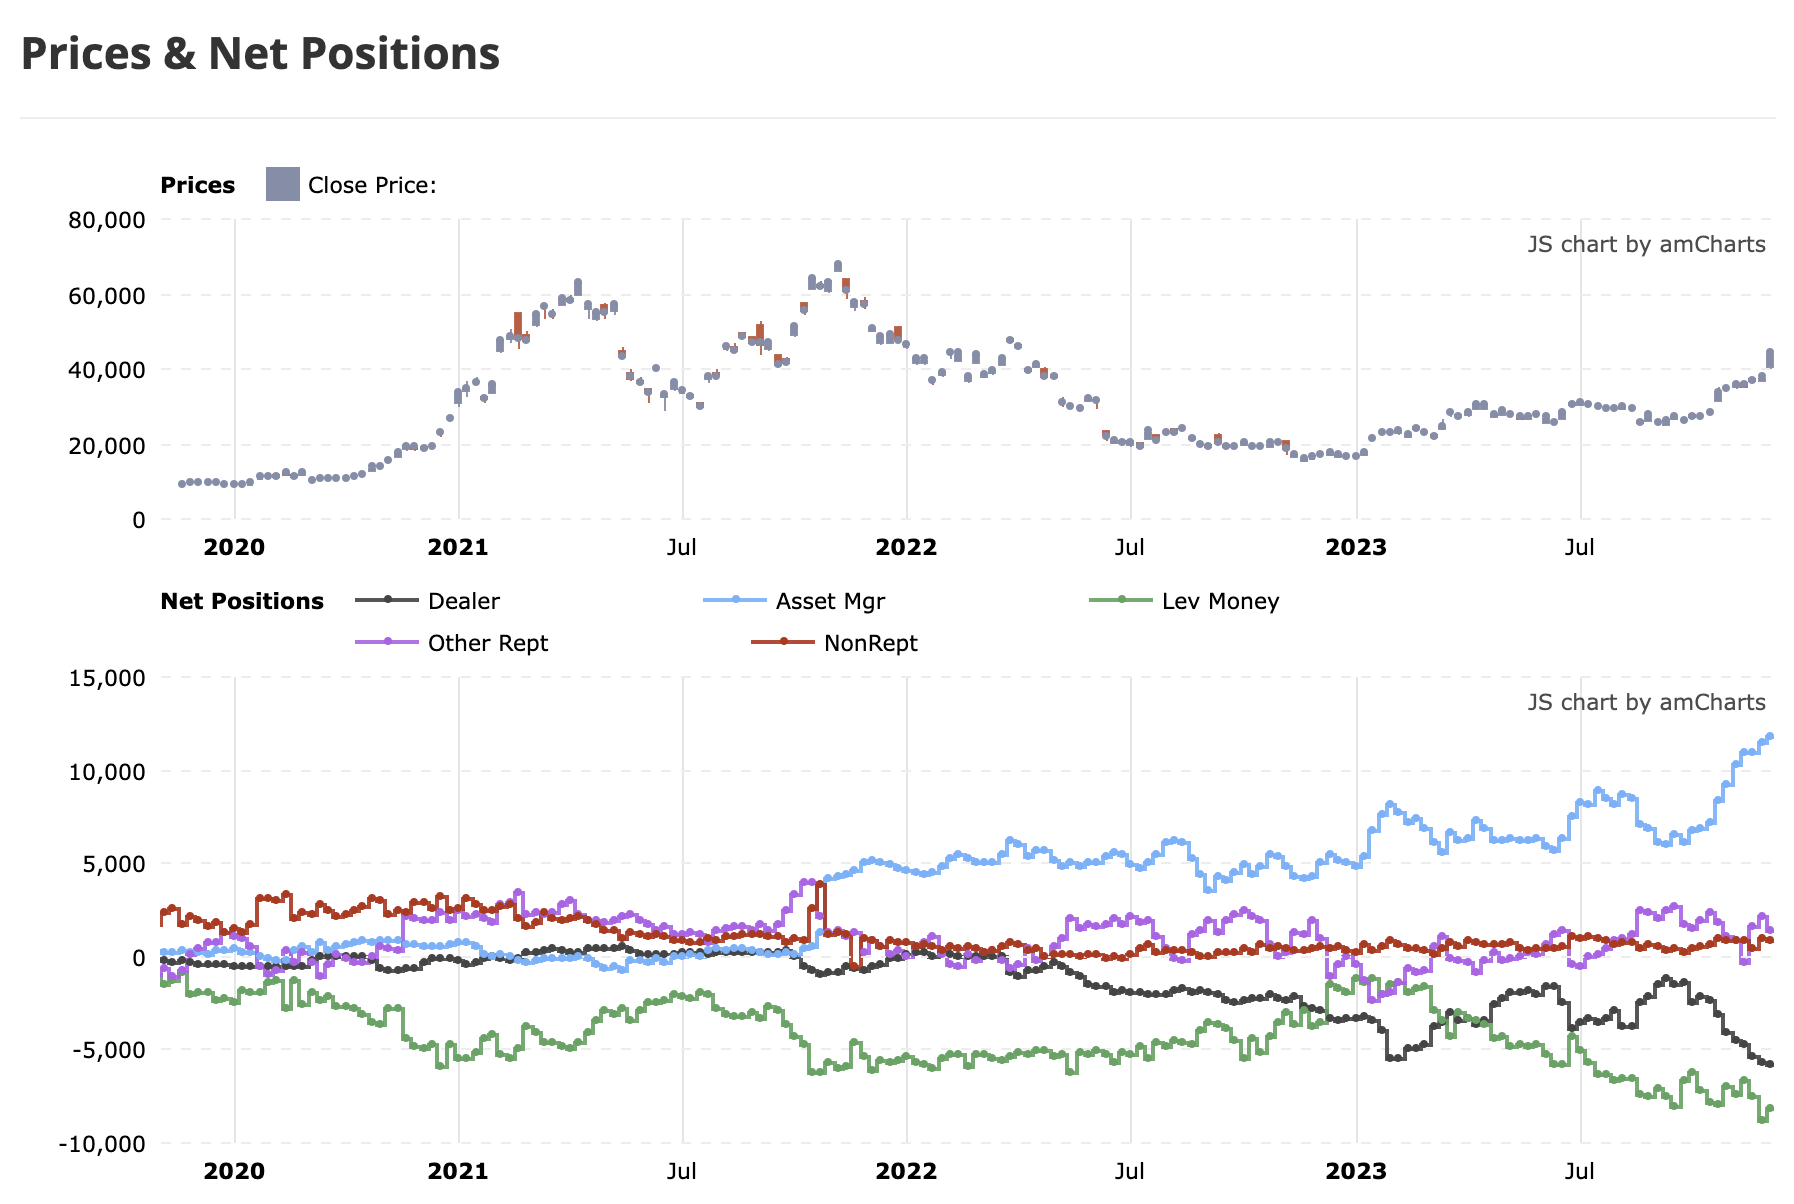
The net short position of large speculators in BTC futures has slightly decreased, but still remains at a historical high. The net short position of market makers hit a record high last week. The two are in contrast to the highest net long level in the history of asset management:
interest rate expectations
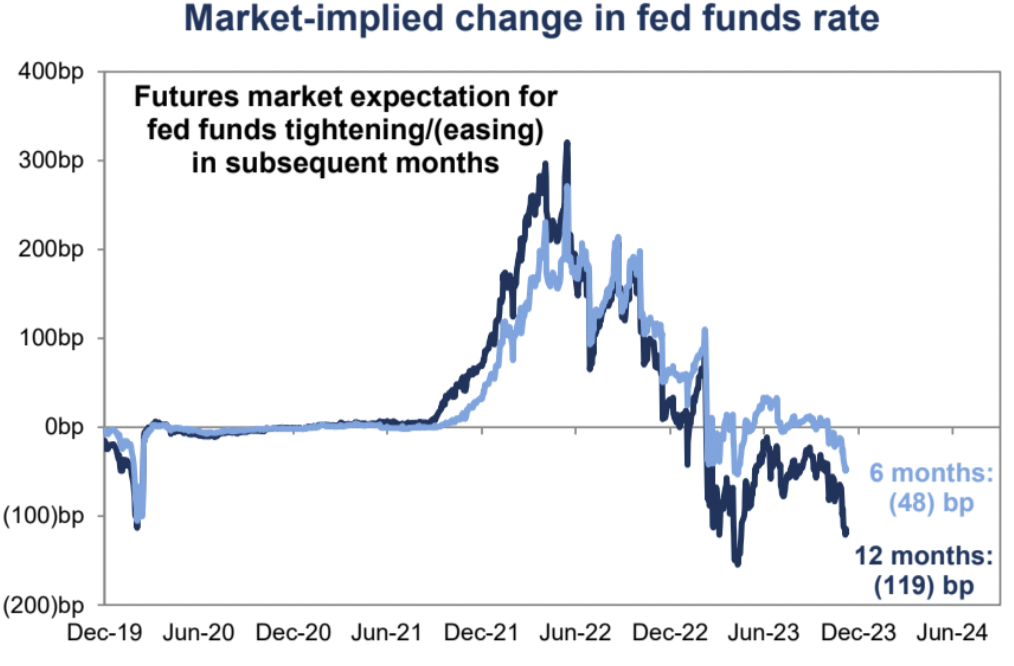
The interest rate market currently predicts a 71% probability of an interest rate cut in March next year and a 100% probability of an interest rate cut in May. The annual rate of 120 bp is 5 times, which is a bit extreme. Compared with the 150 bp expectation set by the market panic during the banking crisis in March this year:
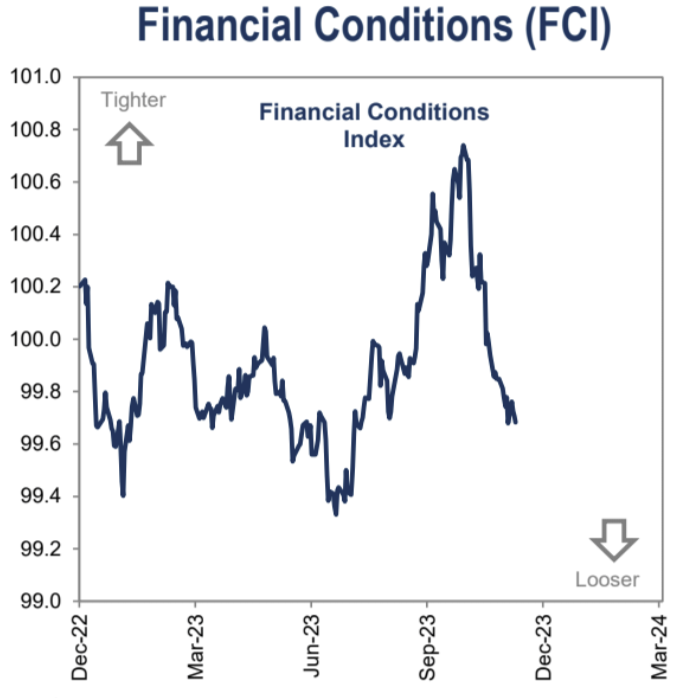
The decline in market interest rates pushed the financial conditions index to its lowest level in four months:
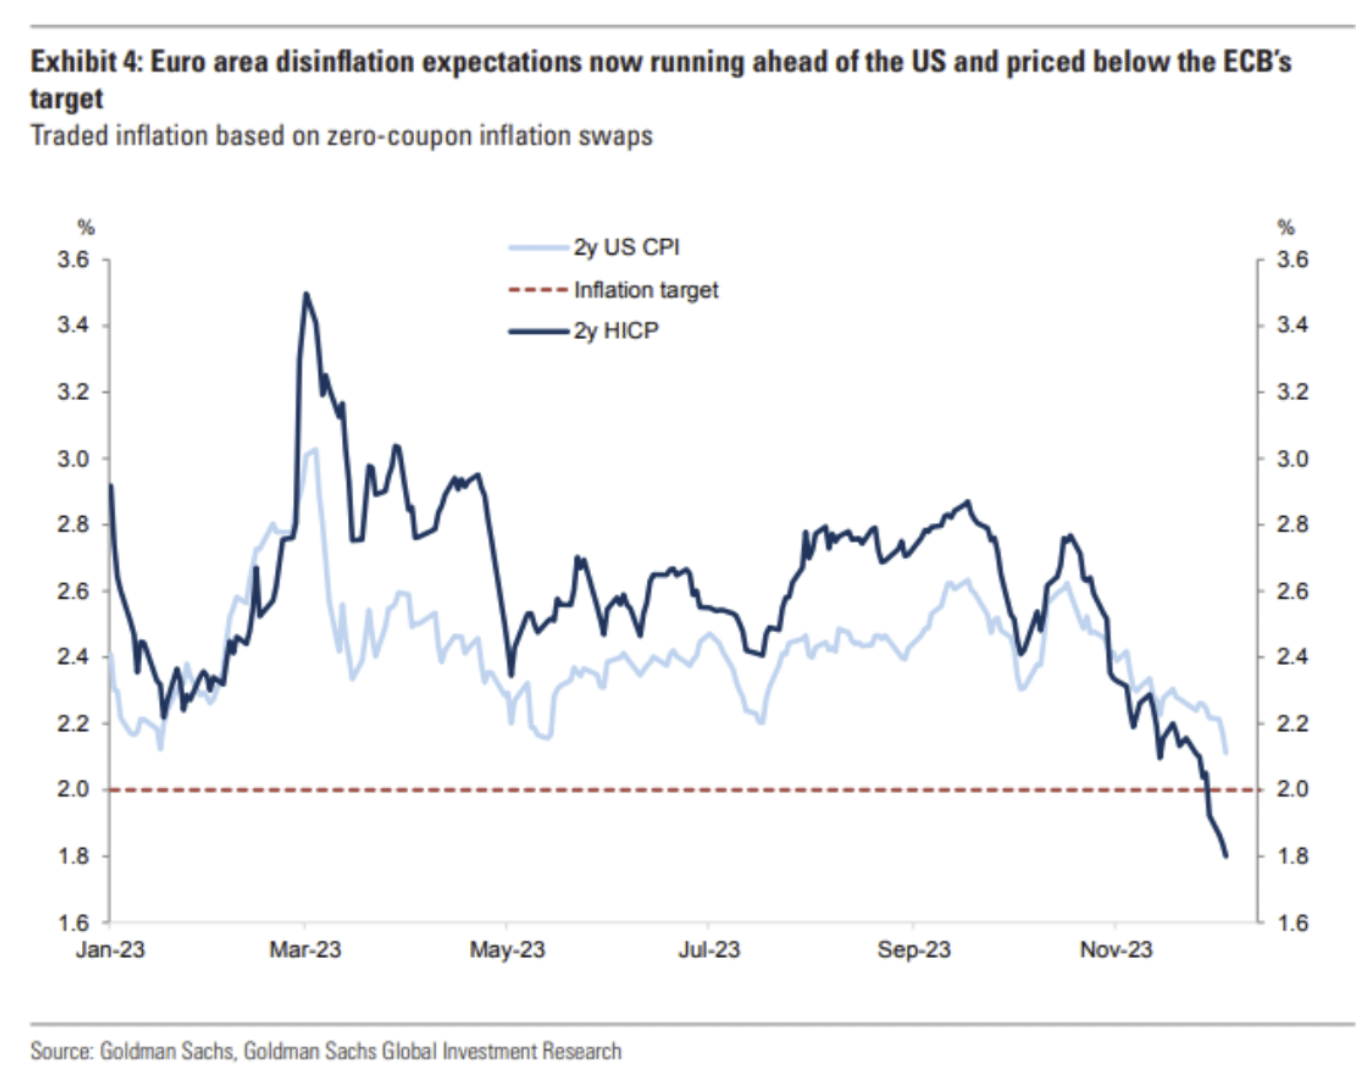
The extreme expectations are not unfounded. The current degree of lower-than-expected inflation is far from what was widely expected earlier in 2024. Trends in Europe in particular show the risk of dramatic lower-than-expected inflation in Europe. The chart below is based on zero-coupon inflation swaps (Zero -Coupon Inflation Swap) derivatives pricing of European and American 2-year inflation expectations, the United States is close to 2%, while the Eurozone inflation expectations are already lower than the European Central Banks 2% inflation target of only 1.8%:
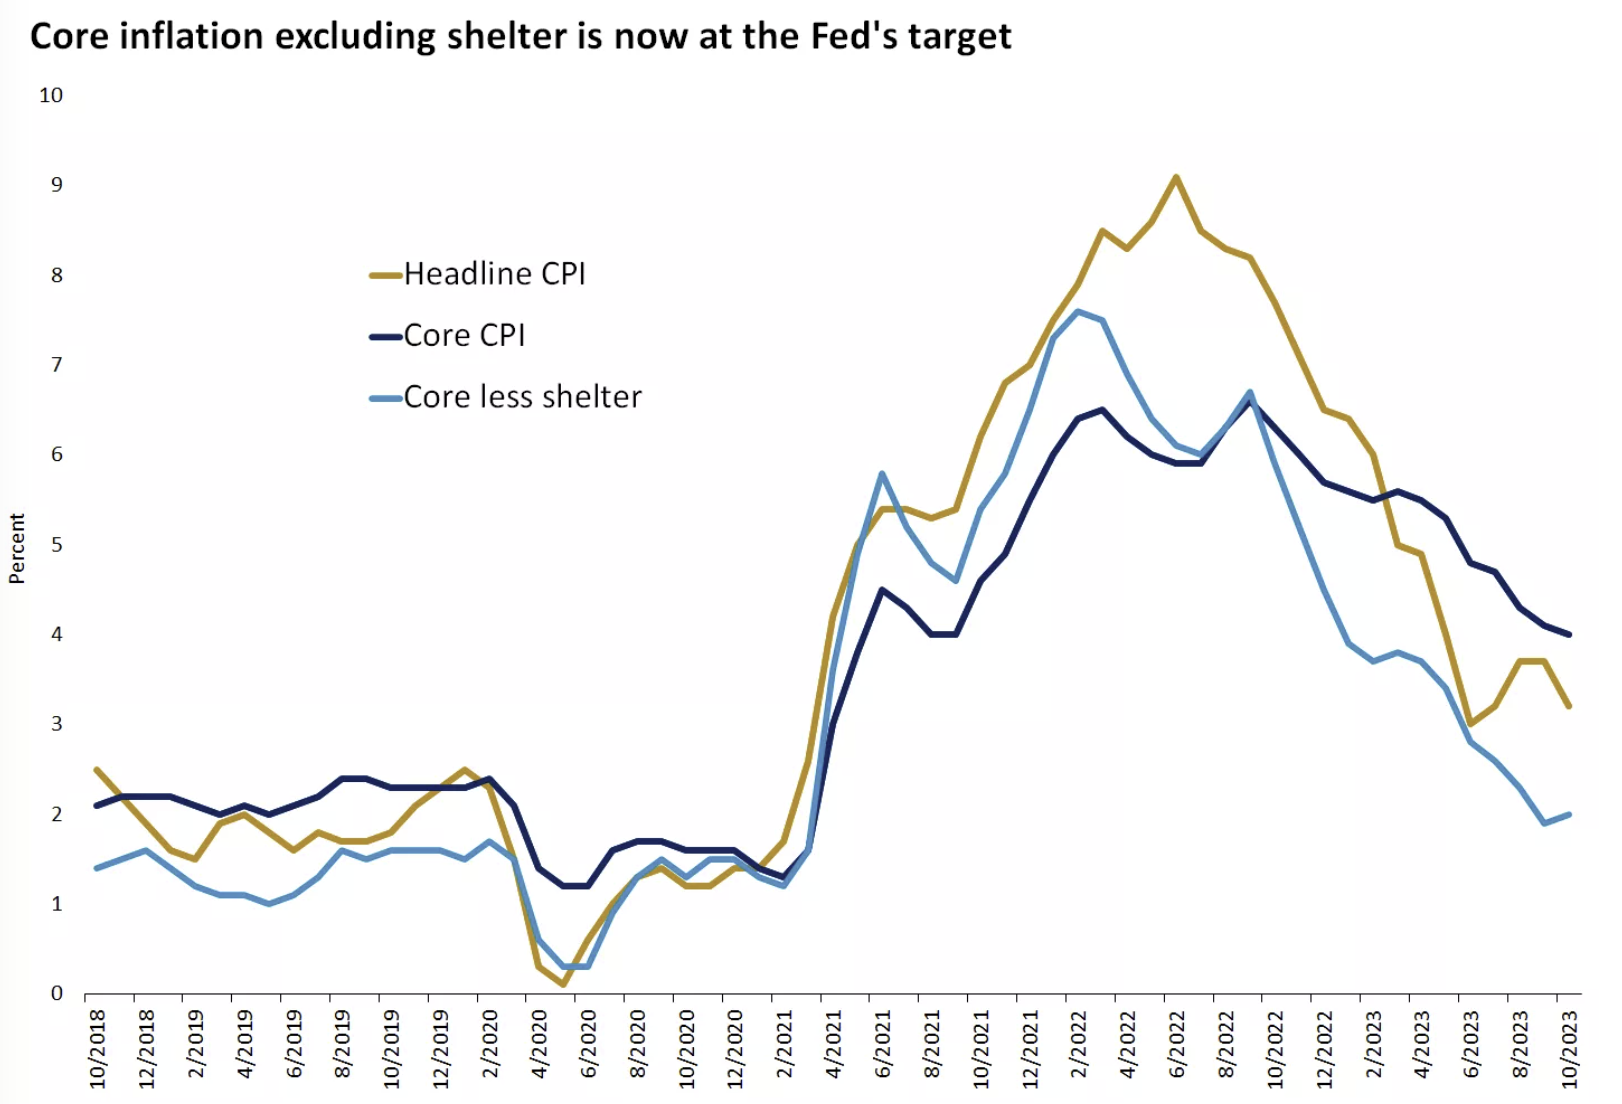
In the U.S., excluding the lagged impact of housing costs, core CPI (Consumer Price Index) has reached the Feds target of 2% over the past two months, as a sharp decline in new rental price increases should lift prices through much of 2024. Low housing inflation; the biggest uncertainty comes from oil prices, but it seems that supply exceeds demand is still the theme:
Job market cools modestly
The focus of last weeks data was on employment, and the data provided a mixed picture and did not reverse the cooling trend that had already occurred, which is a situation that the Fed likes to see:
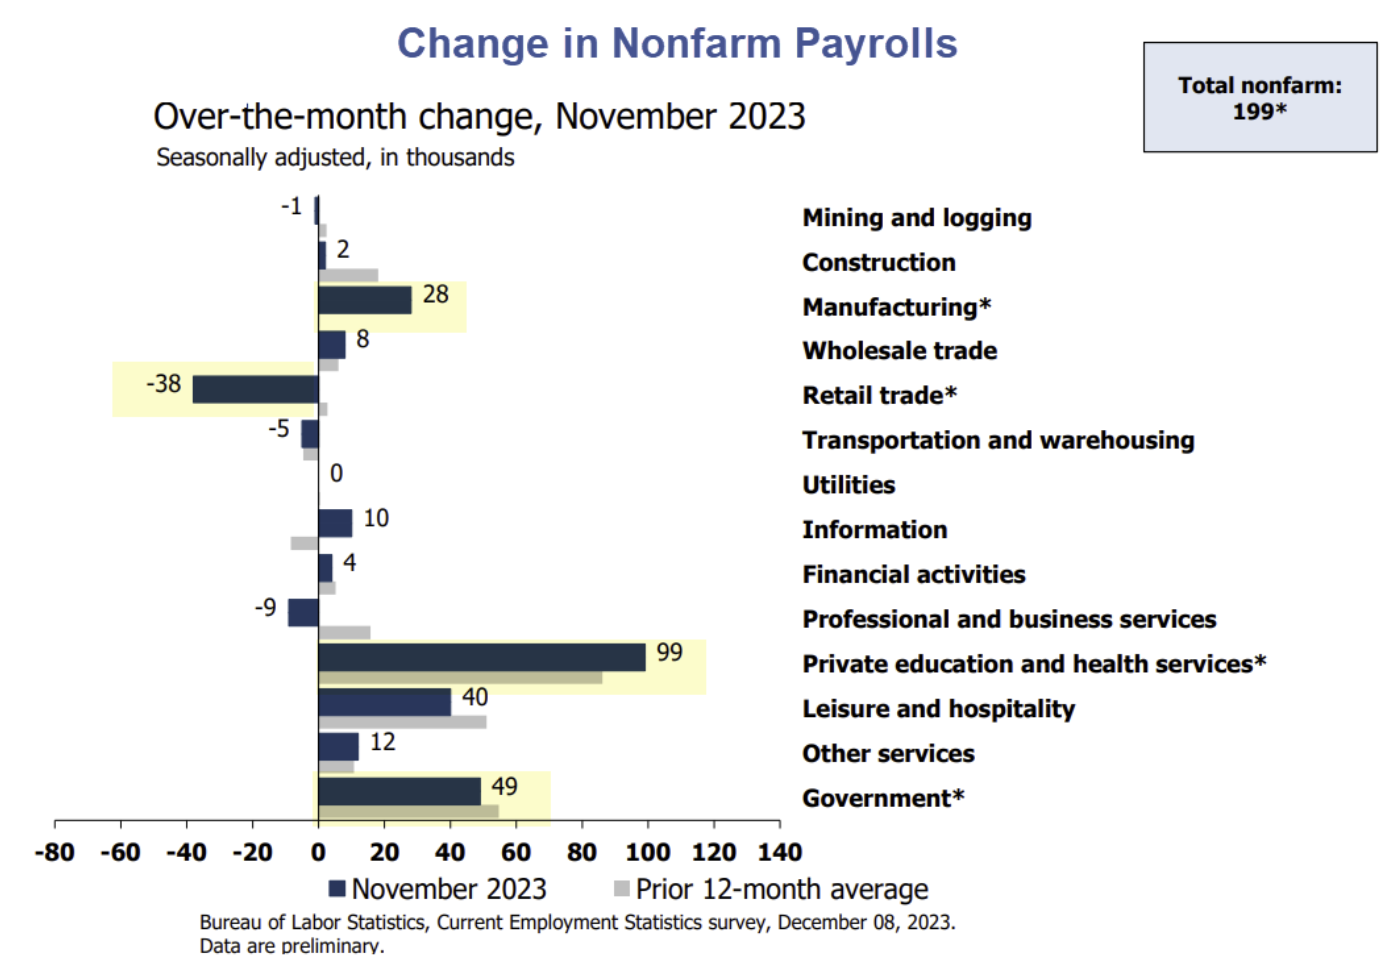
The U.S. economy added 199,000 jobs in November, slightly higher than expected, the unemployment rate fell to 3.7% (a four-month low), and the labor force participation rate increased, all of which indicate a healthy labor market. However, the return of striking autoworkers and film and television workers increased wages by 47,000. Therefore, looking at the 3-month and 6-month averages, the actual growth level is basically stable.
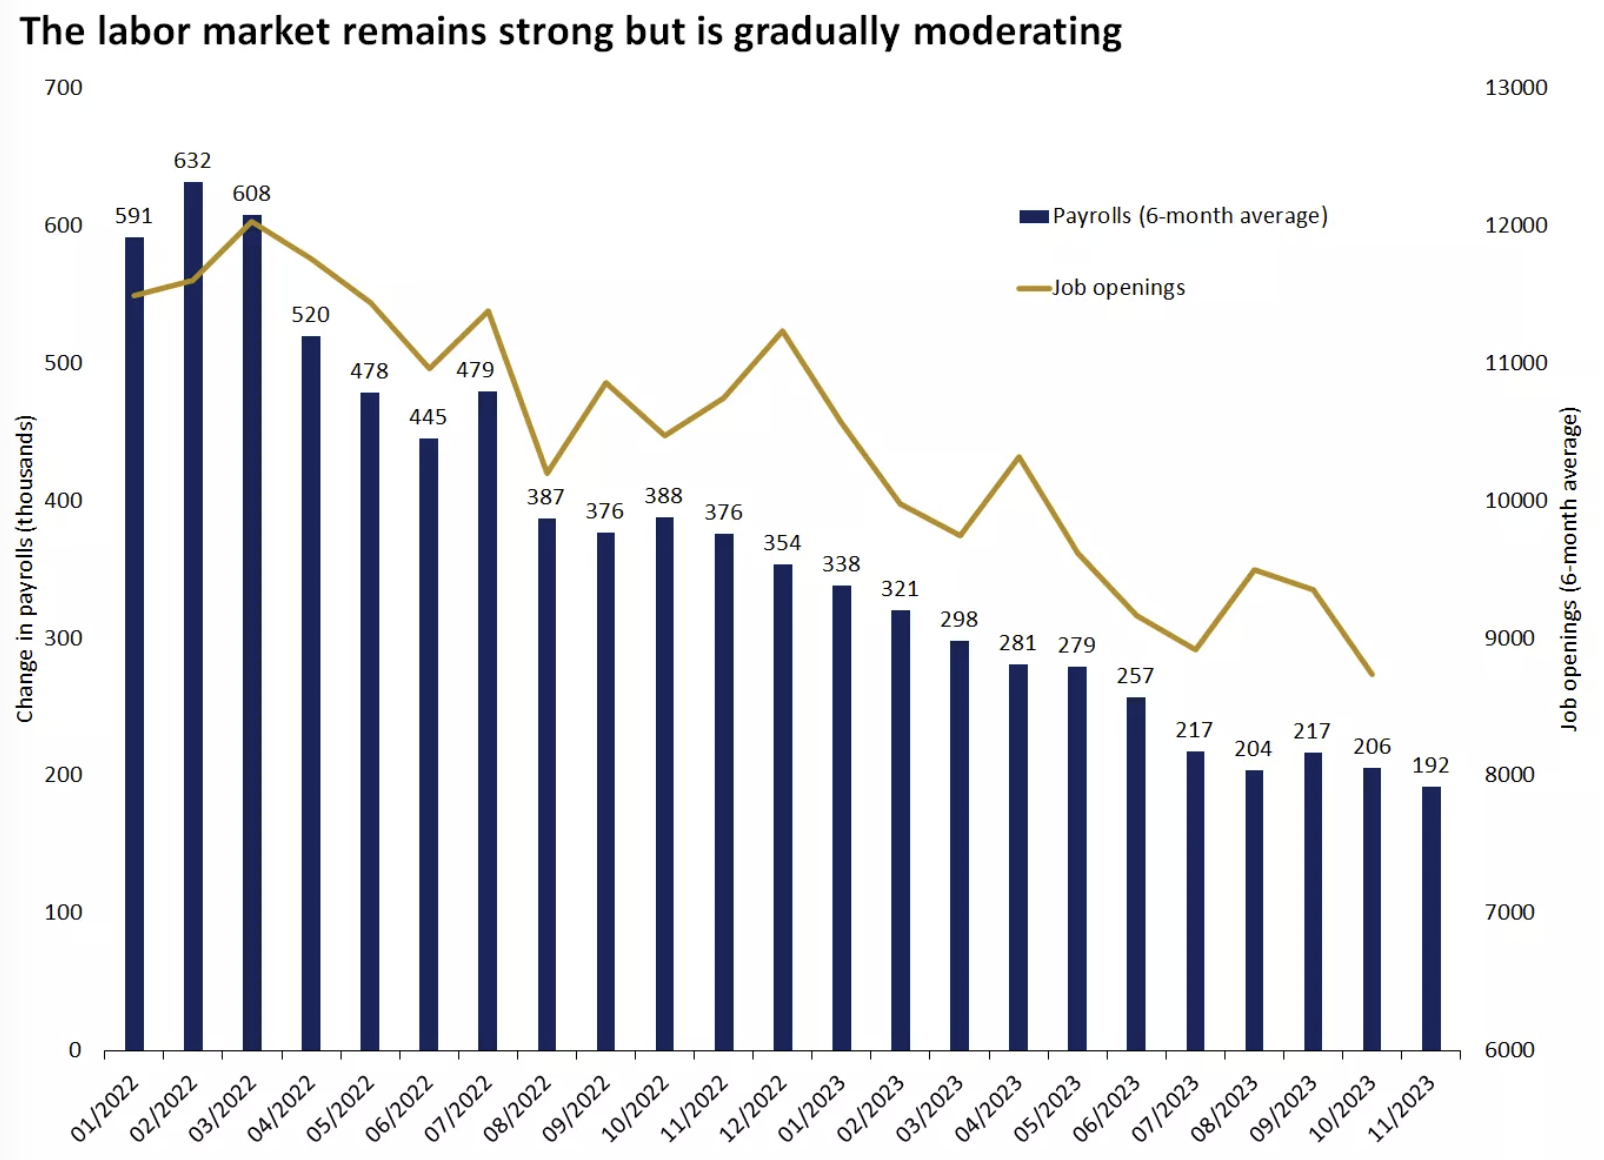
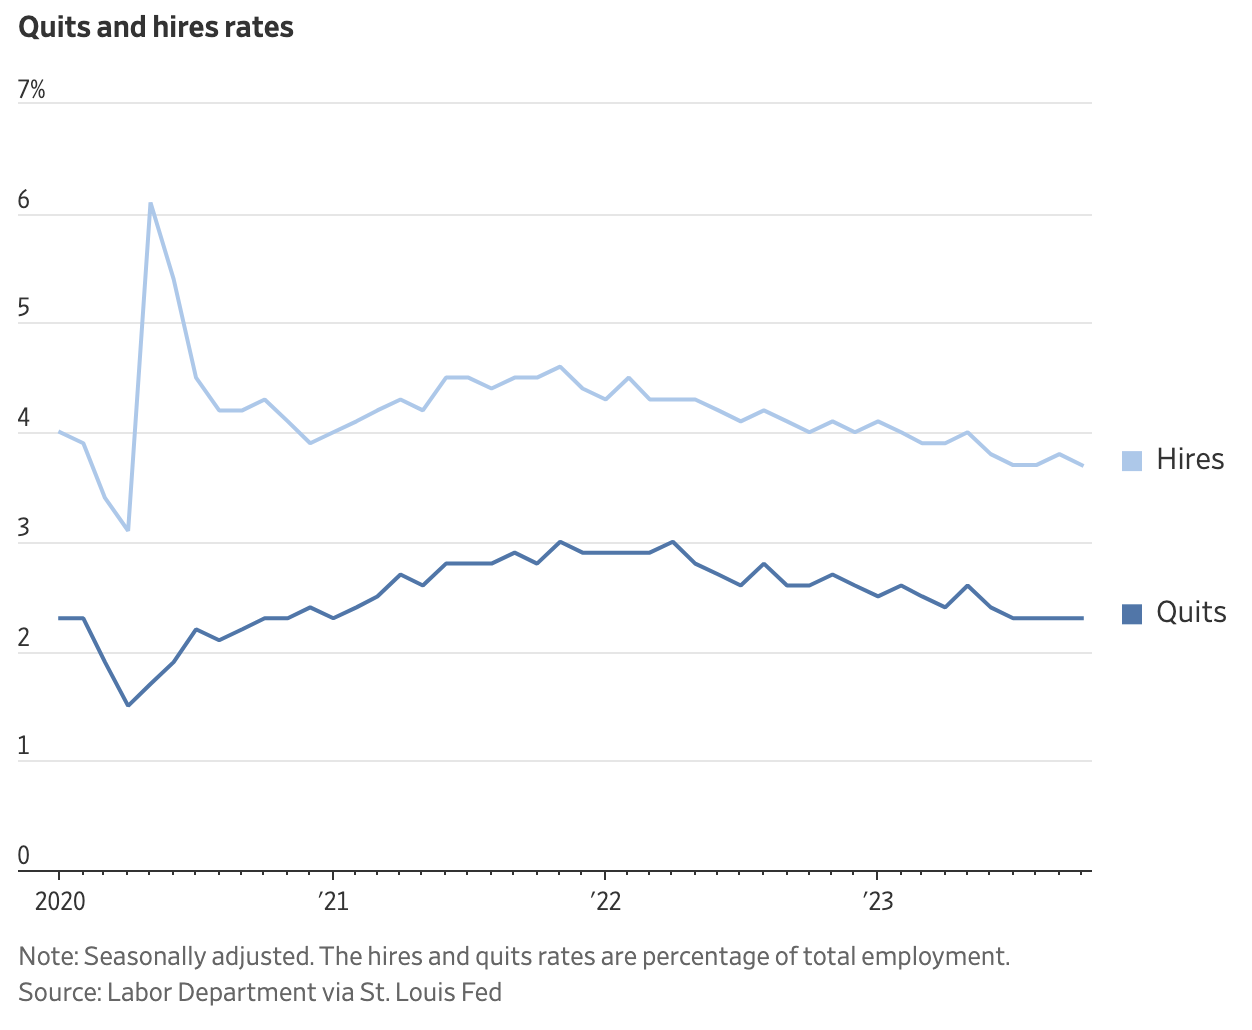
Job vacancies fell for the third consecutive month in October (8.733 million), a larger-than-expected decline to the lowest level since March 2021, but still above the pre-COVID-19 average of 2019 (~7 million) and high compared to the total number of unemployed people (6.5 million). At the same time, the number of resignations remained stable, also indicating that labor market tensions have eased. Historically, resignation rates have led wage growth, and the latest figures are the lowest in almost two years, suggesting wage growth will be hard to come by in the future.
From a structural perspective, education added 99,000 new employees, government employees added 49,000, and the leisure industry added 40,000. The sum of these three sectors accounted for almost all new employment in November. This is also a feature of the U.S. job market this year. In the past 12 months, there have been a cumulative increase of 2.8 million non-agricultural employment, of which 2.2 million are from these three industries, including 1 million in education, 640,000 in government employees, and 530,000 in leisure. Private-sector employment, excluding government employees, has reached last cycle lows.
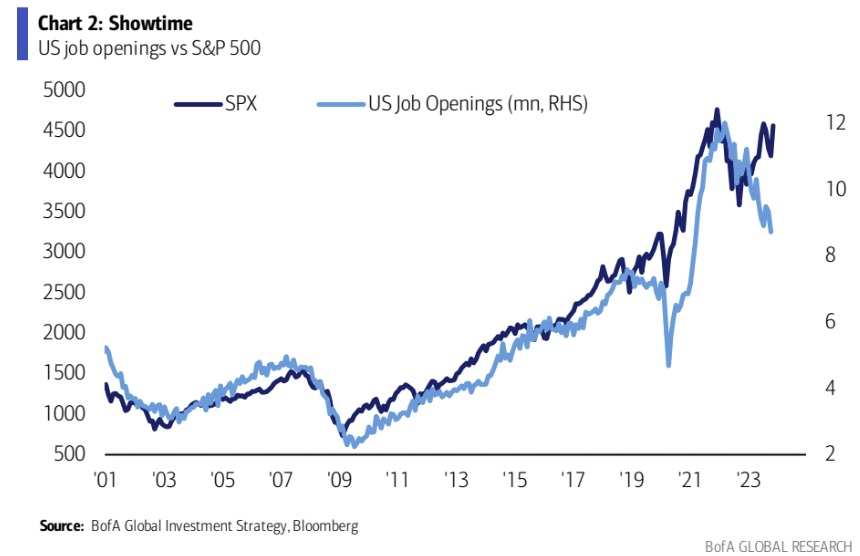
The stock market is rising and the number of job openings is falling, which is rare in history:
Funds and positions
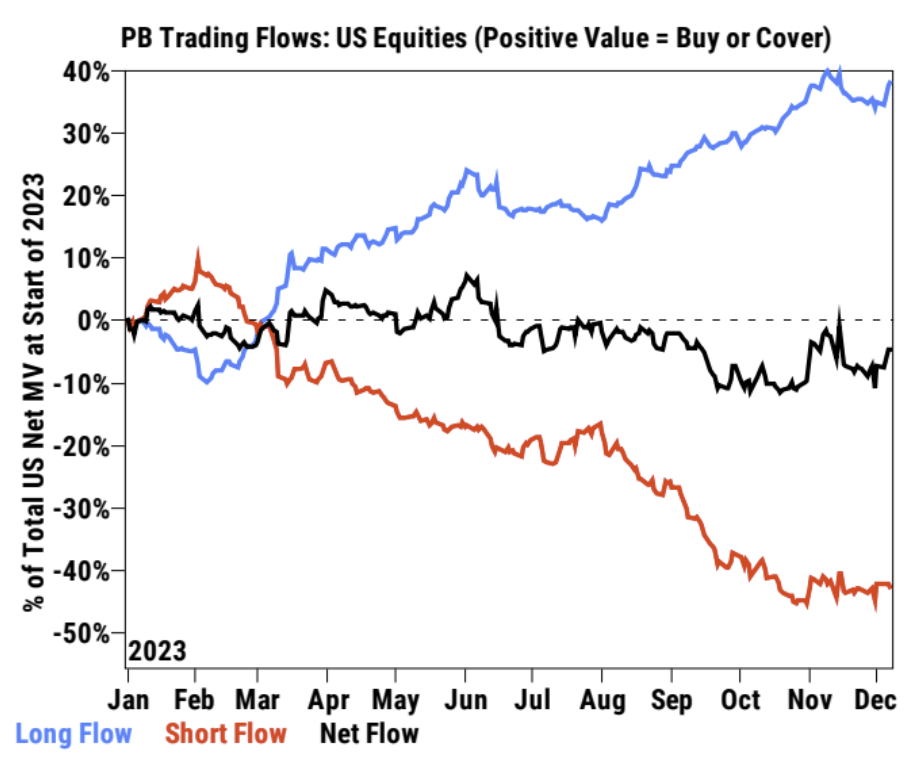
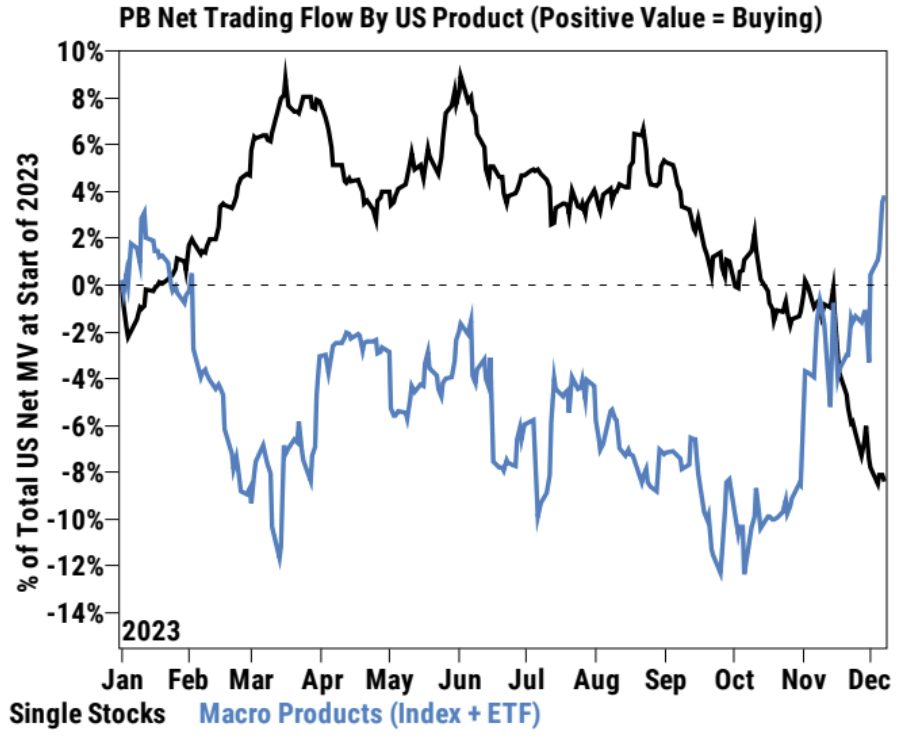
Goldman Sachs PrimeBook data showed that hedge funds (HF) were net buyers of U.S. stocks for the first time in four weeks, mainly macro products. However, individual stocks posted a fifth consecutive week of net selling, even as retail investors were actively buying. Short-term trading continues to increase. Most investors are in a wait-and-see mode, unwilling to trade on a large scale in the face of next weeks CPI data and the Federal Reserve meeting. But some long-term investors are starting to buy into the technology sector on a small scale.
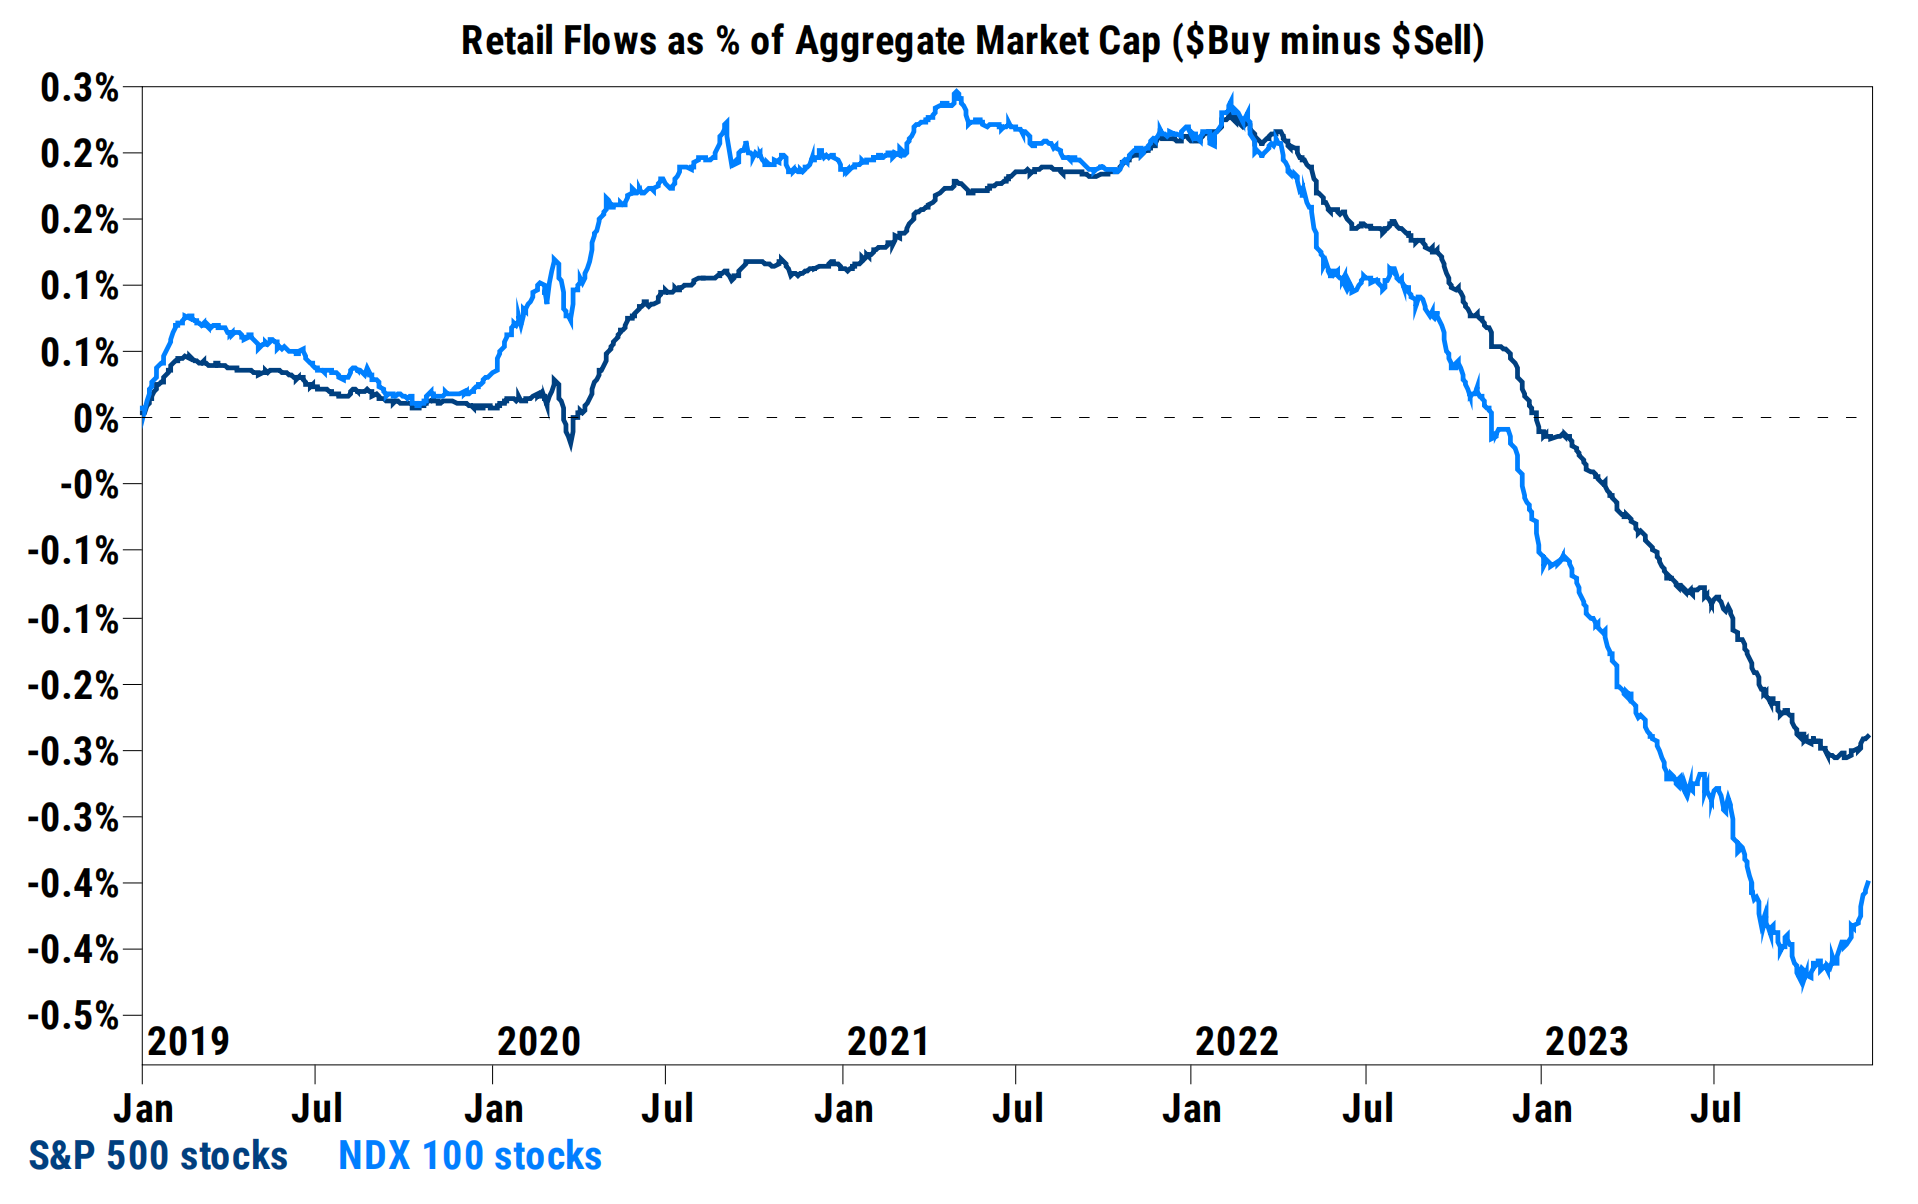
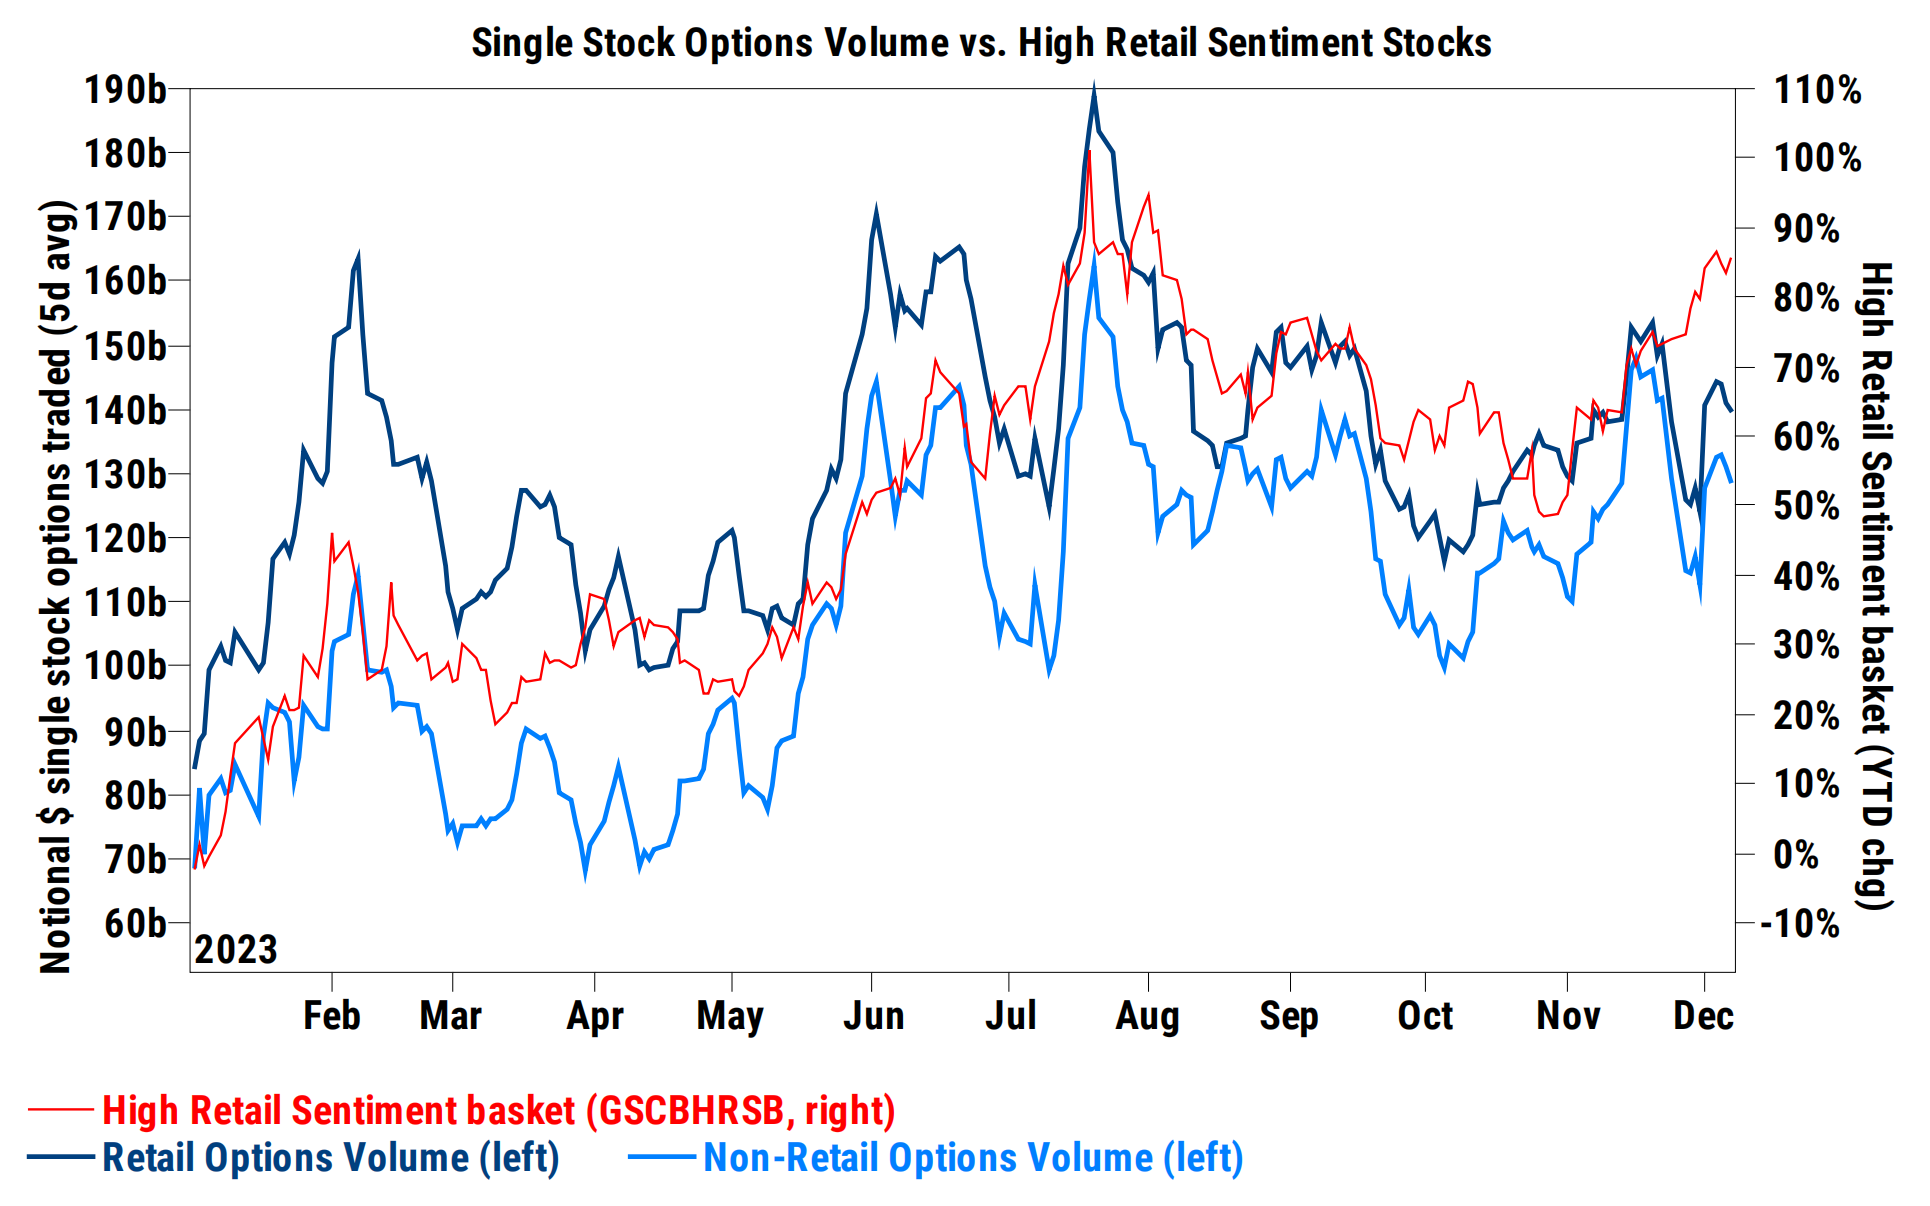
Options buying in the retail market has declined recently, suggesting the short squeeze may have passed its peak:
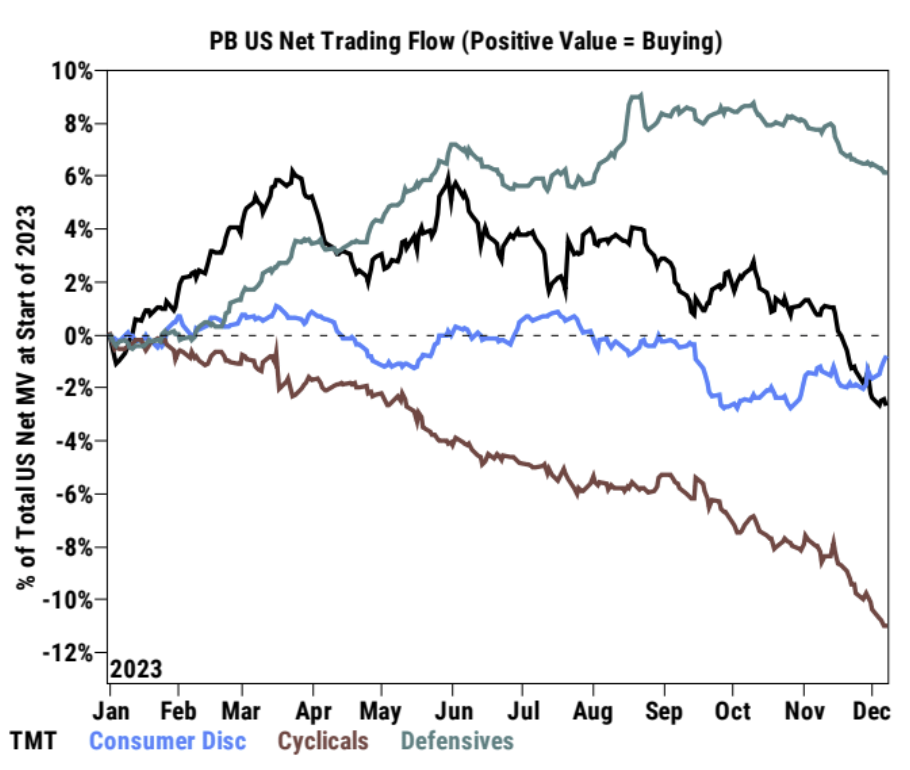
Cumulative net trade flows show that cyclical stocks fell to new lows overall, mainly due to net selling in the energy, financial sectors, technology, media and telecommunications (TMT) stocks: TMT stocks posted a fourth consecutive week of net selling, mainly Led by short selling, the pace of selling has slowed significantly compared to November when long selling was the dominant trend. After Big Tech has been aggressively selling in recent weeks, The Mag 7 is collectively net buying this week and has posted net buys in each of the past three sessions:
Stocks and high-yield bonds maintained inflows over the past week, but investment-grade bonds and government bonds saw large outflows. This suggests investors are moving from safer assets to more speculative assets.
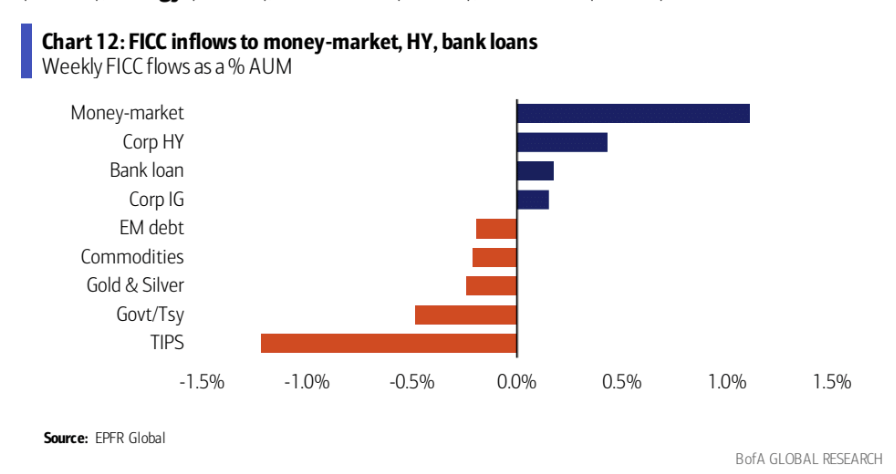
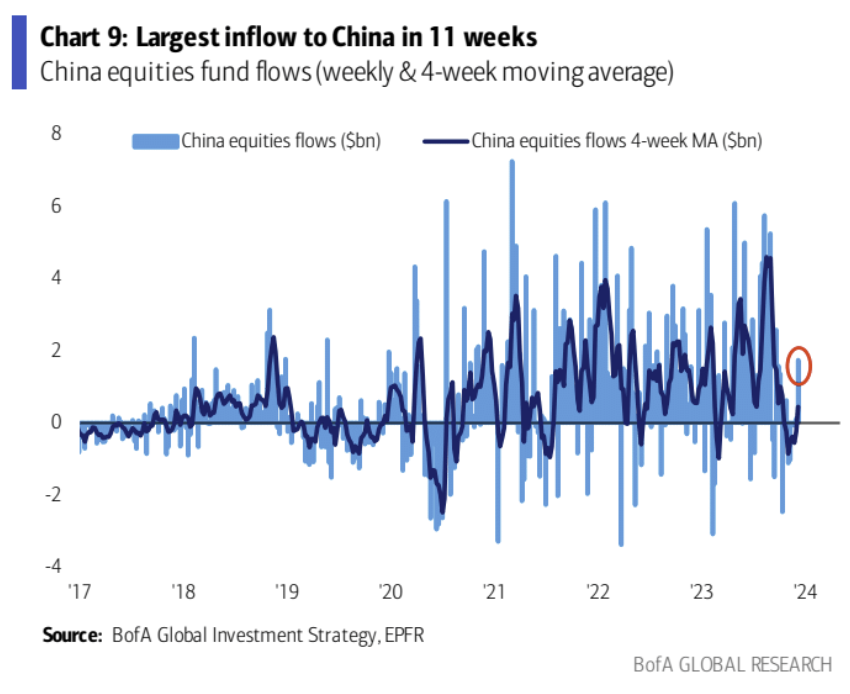
Notably, public market funds saw their largest weekly inflows in 11 weeks despite the plunge in Chinese stocks:
mood
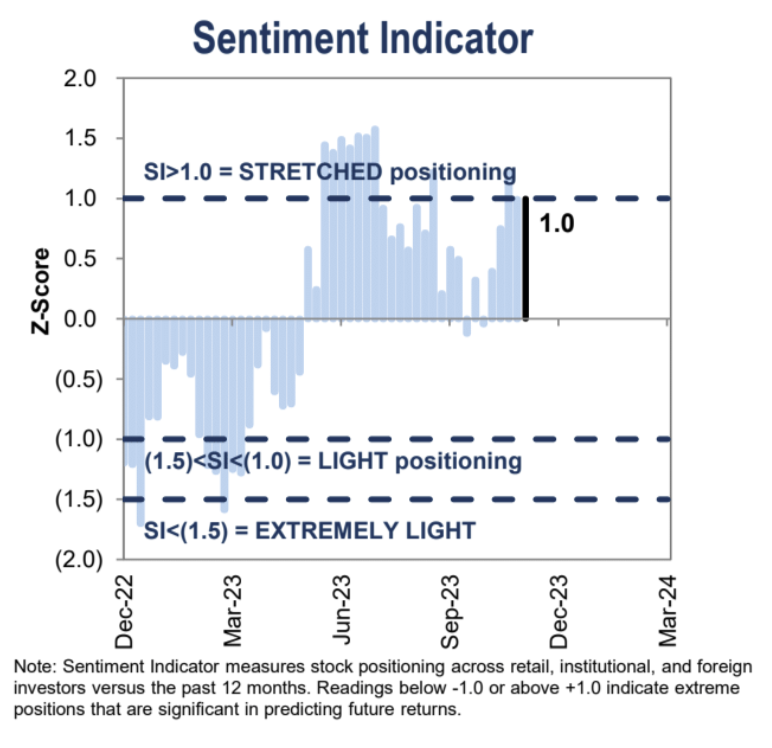
Goldman Sachs sentiment gauge remains at an excessive level of 1.0 or above for the third week in a row
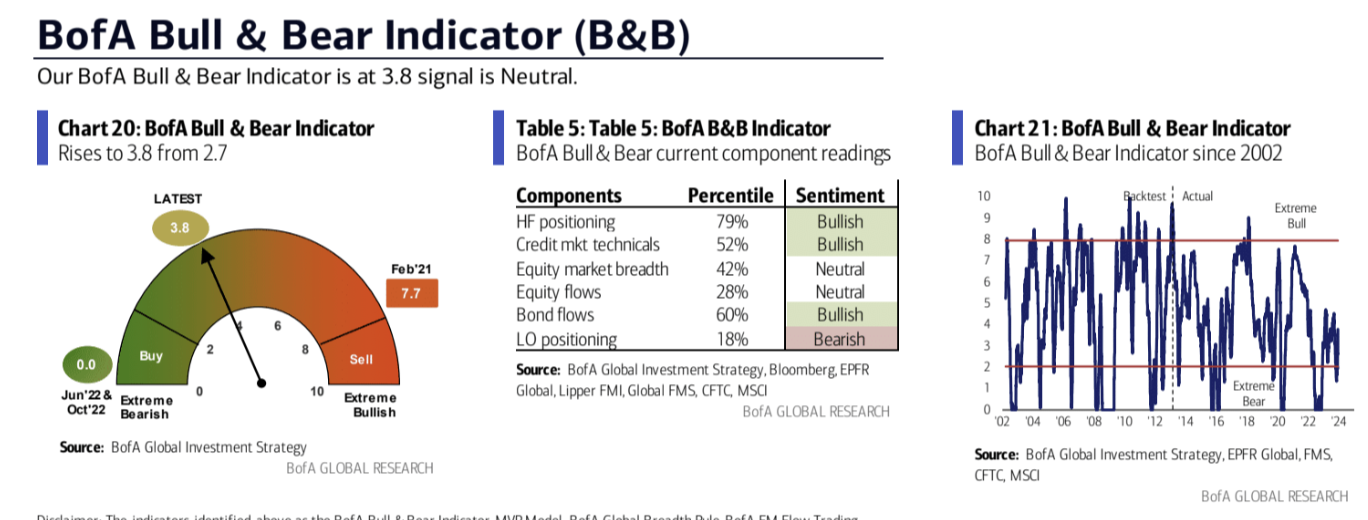
The BofA Bull Bear Indicator rose sharply to 3.8, indicating that investor pessimism is improving significantly. However, the indicator is close to the neutral zone, which means that the market sentiment shift is no longer favorable for risk assets.
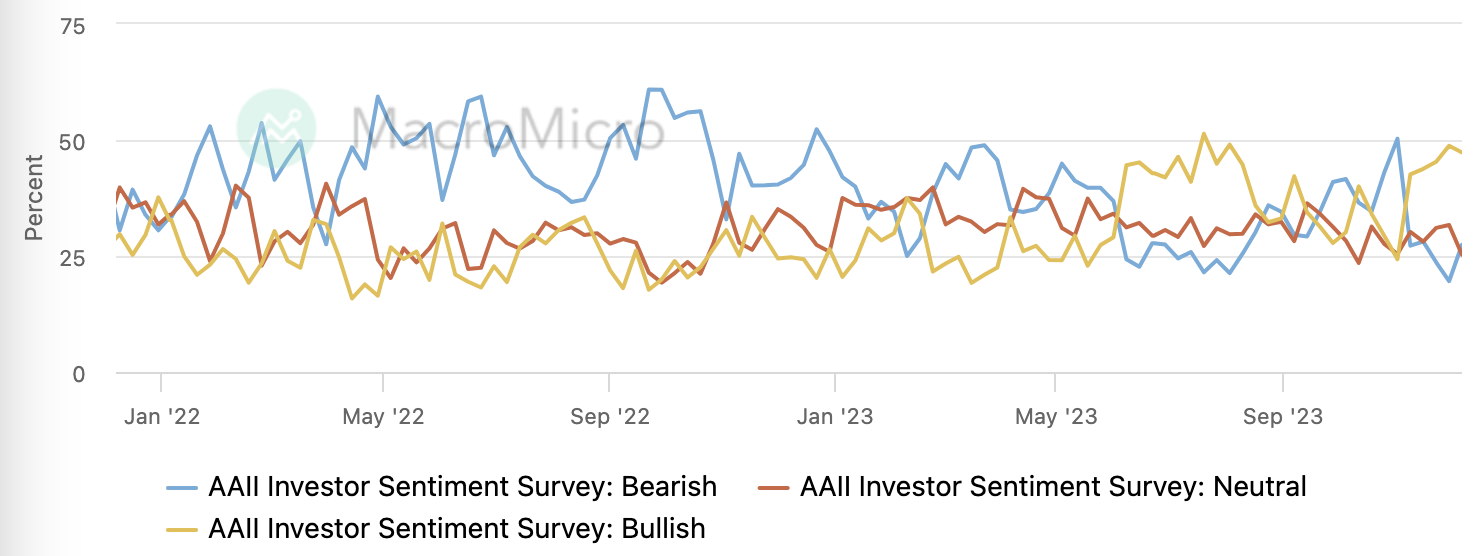
Bullish sentiment in the AAII investor survey dropped slightly, while bearish sentiment rose slightly:
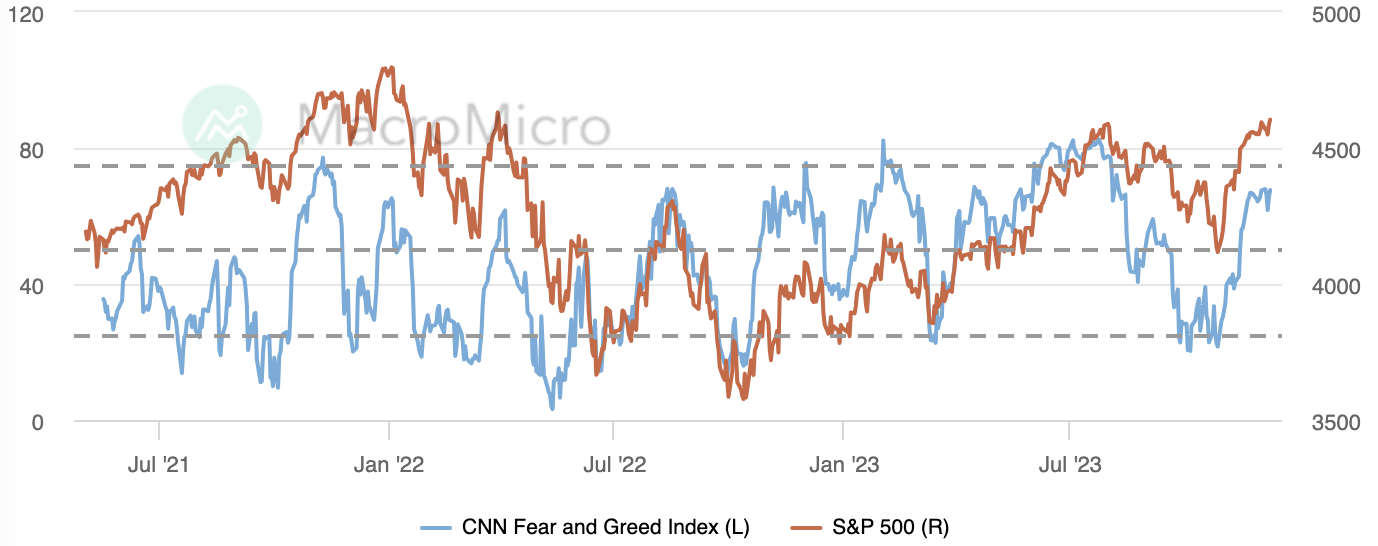
The CNN Fear and Greed Index remained at its highest level since early August and was little changed last week:
institutional perspective
GS: Optimistic scenario already priced in, consider downside protection
The SP 500s overall price-to-earnings ratio is just 5% below Goldmans bullish scenario. Goldmans optimistic scenario is based on real yields falling to 1.5% and a price-to-earnings ratio of 20 times. The current real yield is about 2%, and the price-to-earnings ratio is close to 19 times. GS believes that there may be three situations in the future:
If real yields fall modestly further due to lower inflation and an accommodative Fed, the P/E ratio could hit 20x.
If real yields rise modestly due to the elasticity of economic growth, the P/E ratio could be 18x.
If real yields fall further sharply due to economic growth concerns, the P/E ratio could be 17x.
Also consider:
Markets are already pricing in a 130 basis point Fed rate cut in 2024, higher than what Goldman Sachs economists expected. Banking strategists believe it will be difficult for the market to price in a more optimistic rate cut.
The Goldman Sachs Sentiment Indicator rose from a neutral reading in October to a +1 standard deviation streched status today. That said investors were re-accumulating risks during the recent rally.
To sum up, given that the optimistic scenario may already be priced in the current share price, GS suggests that investors may need to buy downside protection, such as by constructing a put option spread:
Buying a Put: Investors can buy a 3-month put option with a strike price 2% below the SP 500s current levels.
Selling Put Options: Meanwhile, investors can sell a 3-month put option with a strike price 7% below the SP 500s current levels.
The difference between the two strikes is 5%. The potential maximum return for this 5% wide put spread ranks in the 95th percentile over the past 28 years of history, indicating that this spread strategy has performed well relative to other strategies in the past. The strategy has high potential returns (the basis of this strategy is that the normal correction of U.S. stocks generally does not exceed 5%):
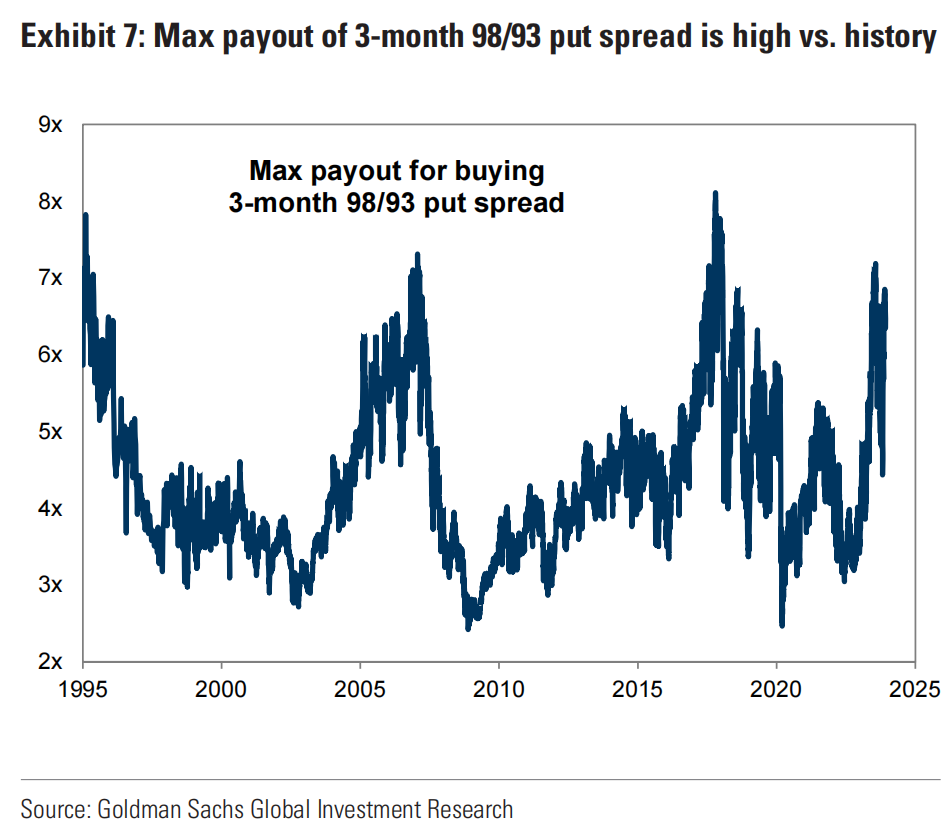
The advantage of this strategy is that if the market falls, the put option purchased will increase in value, but if the market falls by less than 7%, the put option sold will expire, and the benefits are maximized at this time. So the overall loss is just the net royalty. Investors who buy a single put option risk only the premium they pay.
GS: You should bet on high-growth companies next year
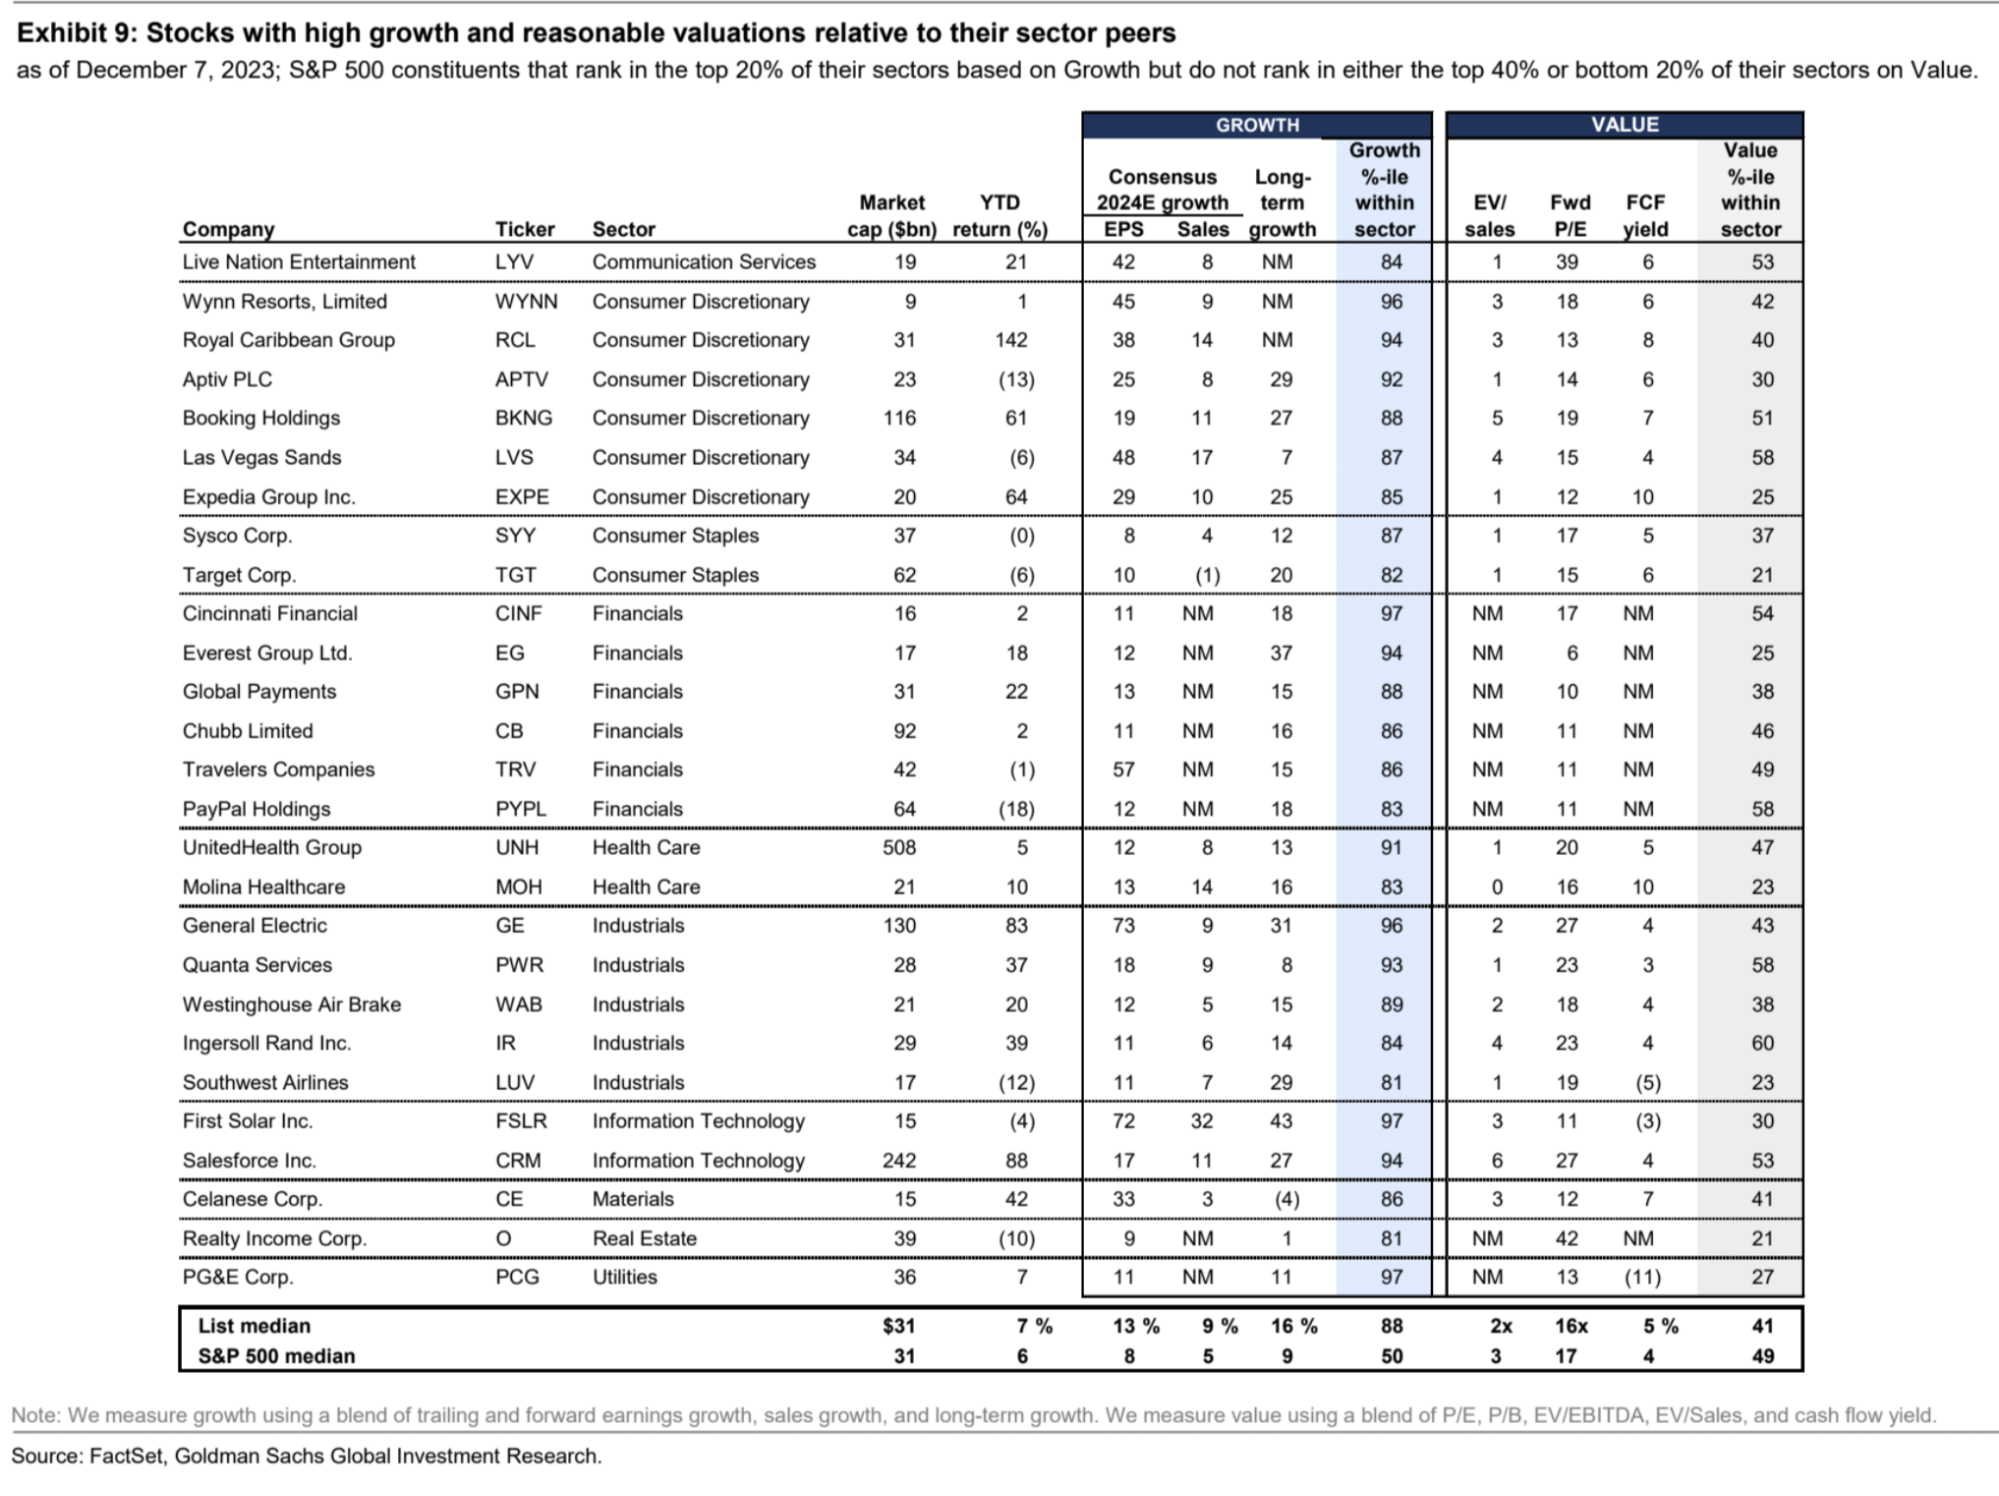
According to the GS macro model, growth stocks perform better than value stocks when economic growth is close to trend, economic growth is slowing, and interest rates and inflation are declining. Goldman Sachs economists expect U.S. GDP growth to be 2.1% in 2024, and interest rate strategists expect interest rates to have peaked, which will be an environment conducive to growth stocks outperforming value stocks. Growth stocks are also expected to lead if interest rates fall further due to weak data, unless the economy enters a recession. Significant acceleration in economic growth may also cause value stocks to outperform growth stocks. But Goldman Sachs thinks this scenario is unlikely.
The chart below shows GSs selection of stocks with high growth and reasonable valuation relative to industry peers. These stocks rank in the top 20% of their industry in terms of growth, but neither rank in the top 40% nor the bottom 20% of their industry in terms of valuation:
Follow next week
The last meeting of the year between European and American central banks. Recent weakening economic data supports the Feds downward revision of its economic outlook, including its dot-plot interest rate forecast, but Powells speech may continue to maintain a tough tone in order to maintain the Feds credibility. If these contents occur, at least they will not be negative for the market, but given the recent high sentiment, it does not rule out selling facts to realize recent gains. The biggest surprise may be that the dot plot does not adjust downward enough. For example, the dot plot predicts an interest rate cut by the end of next year below 50 bp, which may cause the market to be disappointed. Currently, most institutions predict an interest rate cut of more than 100 bp next year, such as ING forecasting 150, UBS forecasting 275, Barclays forecasting 100, and Macquarie forecasting 225.
December inflation data will be released on the eve of the FMOC meeting. Analysts expect the core CPI annual rate excluding food and energy to stabilize at 4%, 0.3% month-on-month, basically the same as Octobers 0.2%; automobile, electricity and heating costs and The drop in gasoline prices has been significant. Overall, the data may show that inflationary pressures are easing significantly. Since the nominal CPI was 0% month-on-month last month, if this number falls into negative numbers, it will greatly boost risk sentiment.


