
Crypto market sentiment research report (12.01-12.08): BTC is far ahead in gains
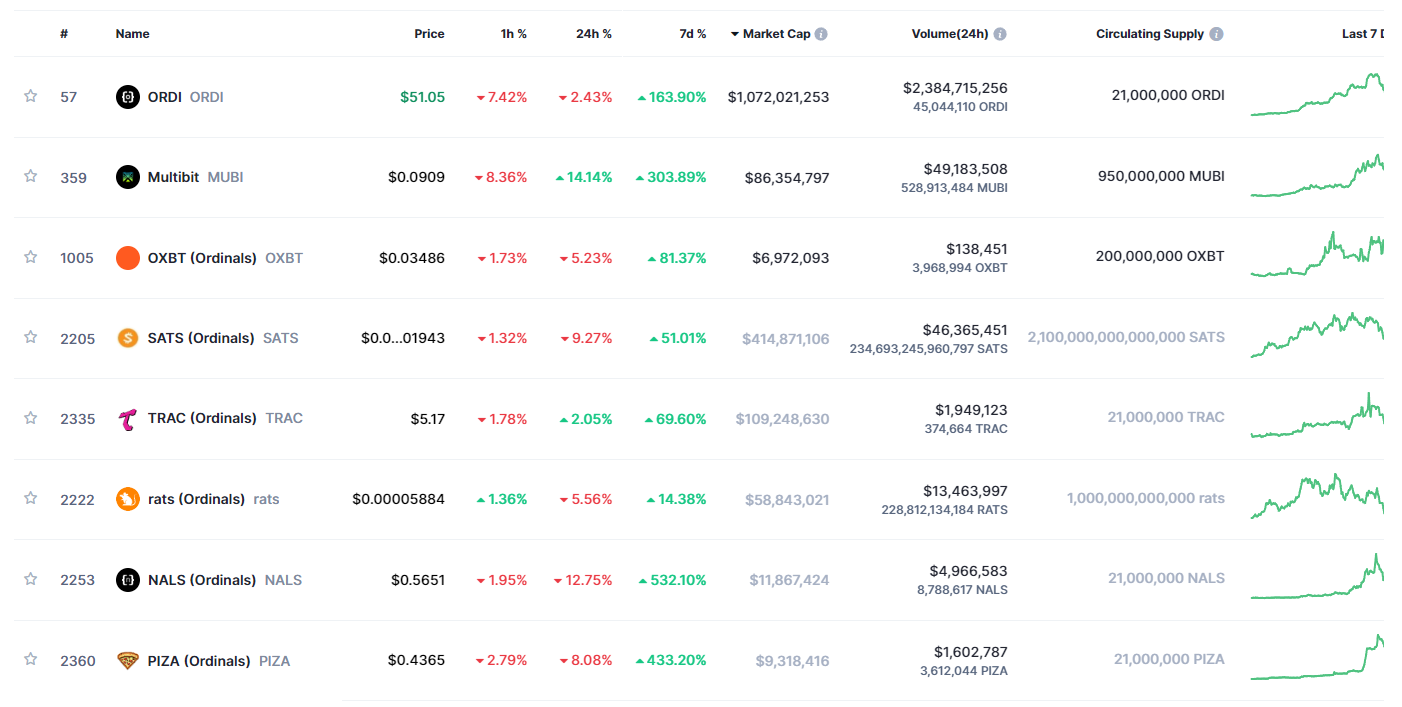
BTC has increased by 11% in the past week, far ahead of US dollar assets such as the Nasdaq and gold. BRC 20 has experienced an astonishing increase due to the popularity of Inscription. Among them, the leading ORDI has increased by 163.9% in the past 7 days, and its market value has reached 1 billion US dollars.
Deploy hot spot tracking to capture bull market opportunities
Binance’s copying function: Trusted performance data, one-click to start copying, no third-party custody fees!
Now, Binance has launched a new copy feature that allows you to easily follow the best trading strategies on the platform. We provide trusted performance data, allowing you to choose the copy strategy that works best for you, without paying the hosting fees of a third-party platform. The investment threshold is low and capital operations are flexible, allowing you to participate in the market more conveniently.
With the help of Binance’s copy trading function, you can use public sentiment data to monitor a large number of products and gain accurate insights into market sentiment fluctuations. We track the trend of contract prices in the market in real time and select potential investment targets. You only need to configure positions with one click to enjoy the best investment strategy.
The follow-up function combines the markets upward trend opportunities, uses public sentiment data to monitor the market, tracks contract price trends in real time, selects potential investment targets, and allocates positions in a timely manner, which will be the next best strategy. Never miss out on great trading strategies and market opportunities again!
Bitcoin halving is about 164 days away from today (2023.12.08)
Countdown to halving:https://www.nicehash.com/countdown/btc-halving-2024-05-10-12-00?_360safeparam=1289146171
Market technical and emotional environment analysis
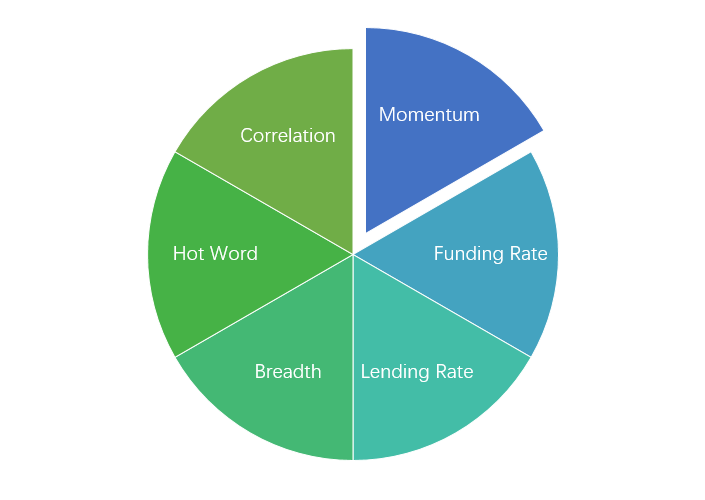
Sentiment analysis components
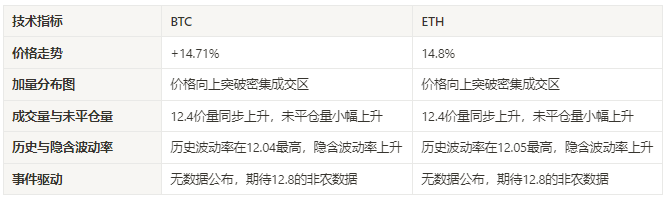
Technical indicators
Price trend
BTC prices increased by 14.71% and ETH prices by 14.8% in the past week.
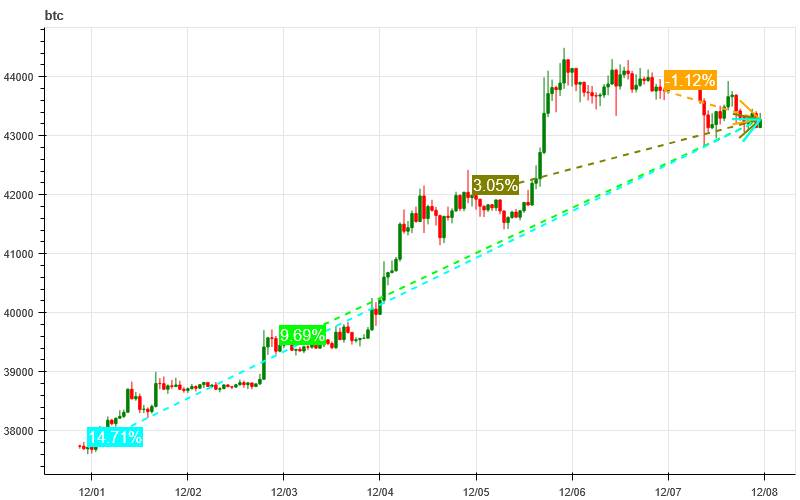
The picture above is the price chart of BTC over the past week
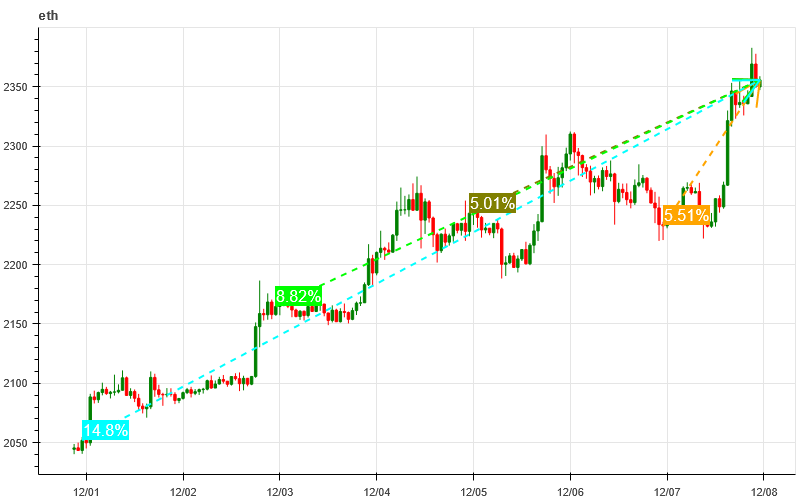
The picture above is the price chart of ETH over the past week
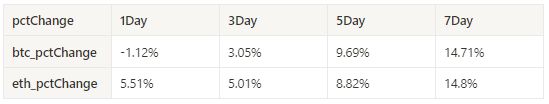
Table showing the rate of price change over the past week
Price and volume distribution chart (support and resistance)
In the past week, the prices of BTC and ETH both rose and broke through the intensive trading area to form new highs.
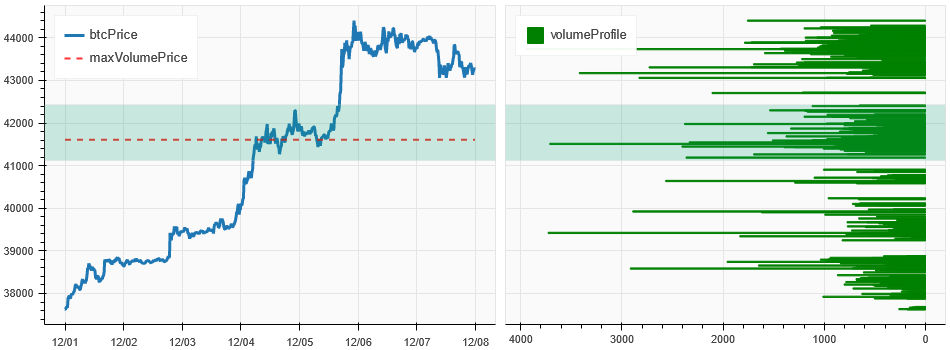
The picture above is the distribution map of BTC’s intensive trading areas in the past week.
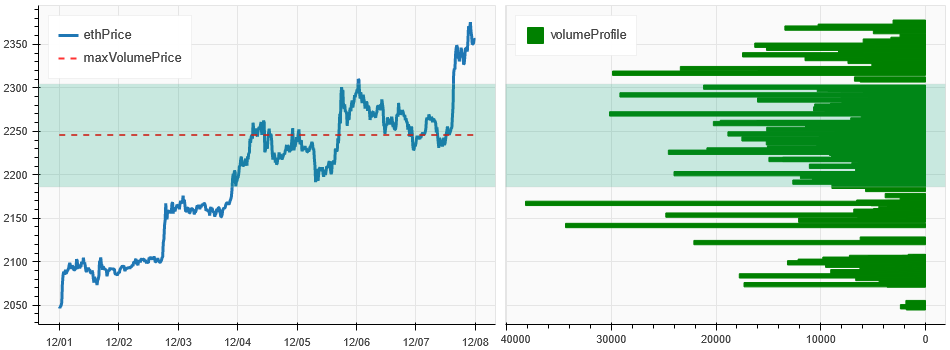
The picture above is the distribution map of ETH’s intensive trading areas in the past week.
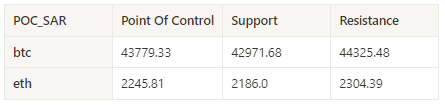
Table showing the intensive weekly trading ranges for BTC and ETH over the past week
Volume and Open Interest
In the past week, both BTC and ETH started their upward trend with heavy volume on 12.4, with the largest trading volume on 12.5; open interest rebounded after falling from highs.
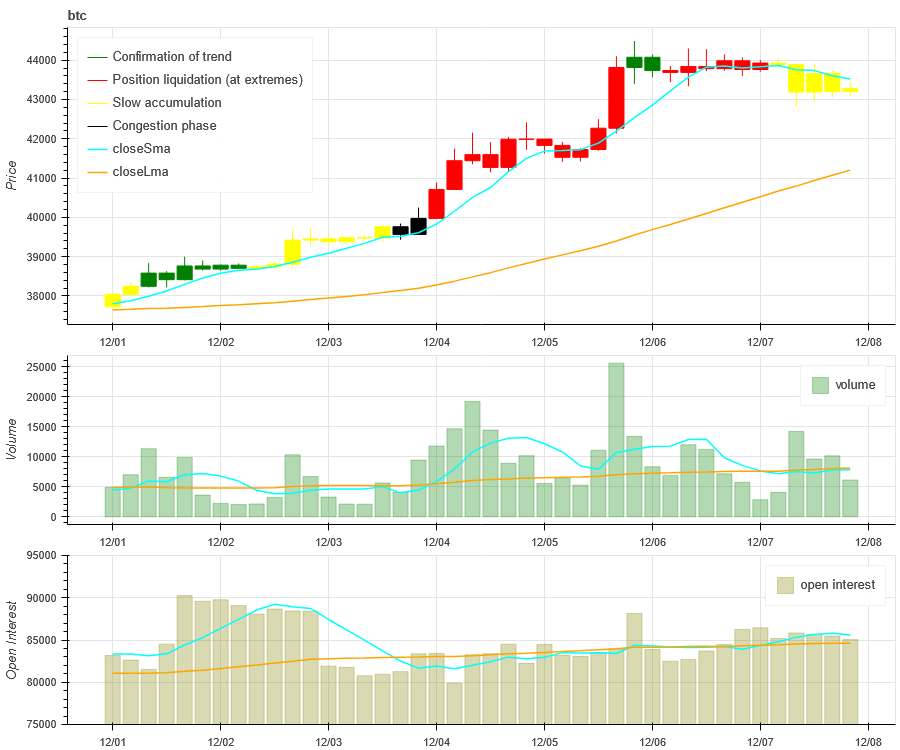
The price trend of BTC at the top of the picture above, the middle is the trading volume, the bottom is the open interest, the light blue is the 1-day average, and the orange is the 7-day average. The color of the K line represents the current status. Green means that the price rise is supported by trading volume, red means positions are being closed, yellow means positions are slowly accumulating, and black means congestion.
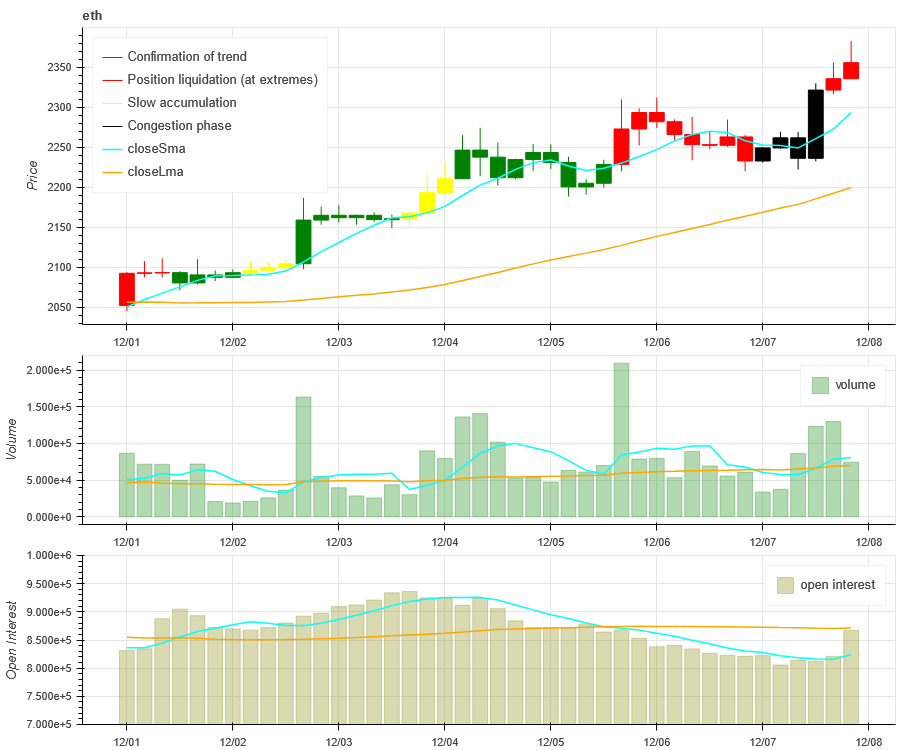
The price trend of ETH at the top of the picture above, the middle is the trading volume, the bottom is the open interest, the light blue is the 1-day average, and the orange is the 7-day average. The color of the K line represents the current status. Green means that the price rise is supported by trading volume, red means positions are being closed, yellow means positions are slowly accumulating, and black means congestion.
Historical Volatility vs. Implied Volatility
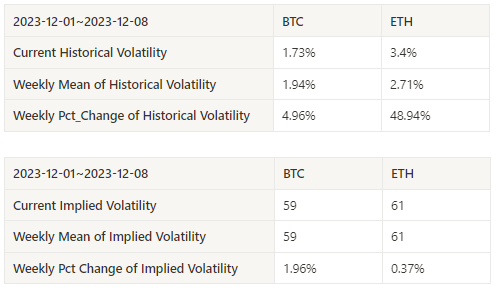
In the past week, the historical volatility of BTC and ETH was the highest at 12.04, and the implied volatility increased.
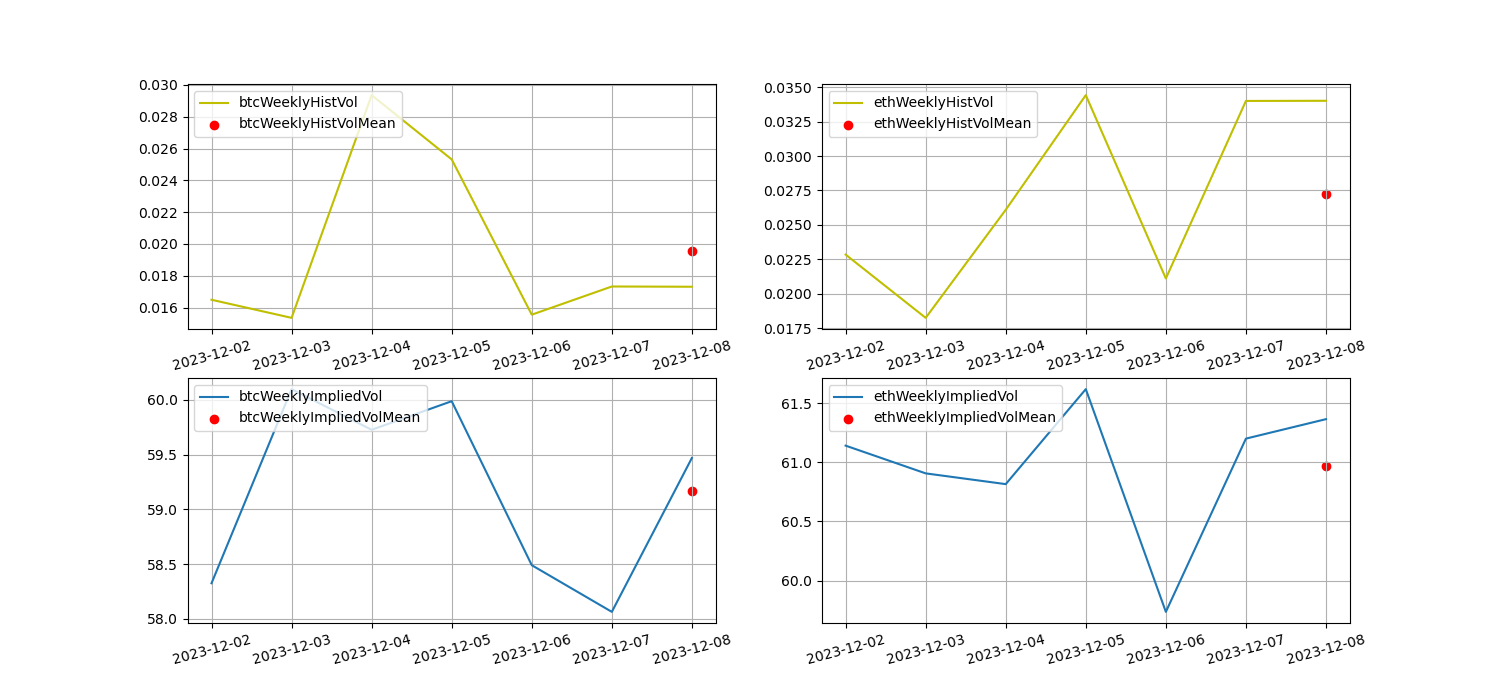
The yellow line is historical volatility, the blue line is implied volatility, and the red dot is its 7-day average
event driven
There is no data released this week, and we are looking forward to the non-agricultural data tonight on 2023.12.08.
sentiment indicator
momentum sentiment
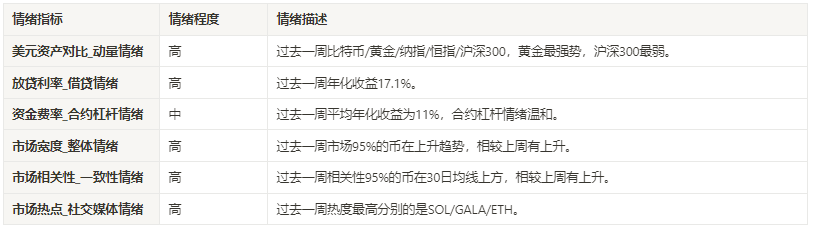
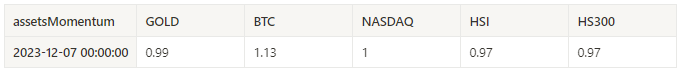
In the past week among Bitcoin/Gold/Nasdaq/HSI/CSI 300, Bitcoin was the strongest and Yaoyao took the lead, while the worst performer was the Hang Seng Index.
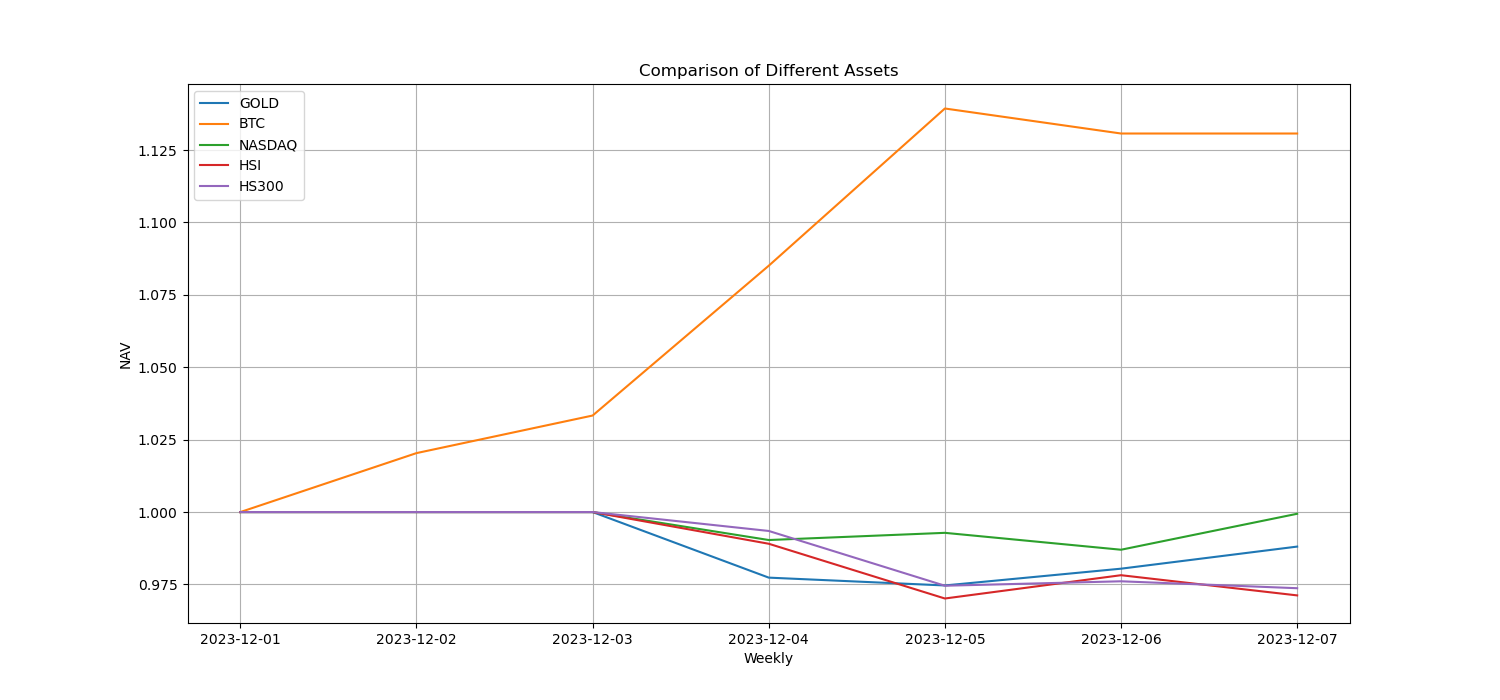
The picture above shows the trends of different assets over the past week.
Lending interest rate_Lending sentiment
The average annualized return on USD lending in the past week was 16.6%, and interest rates fell slightly.
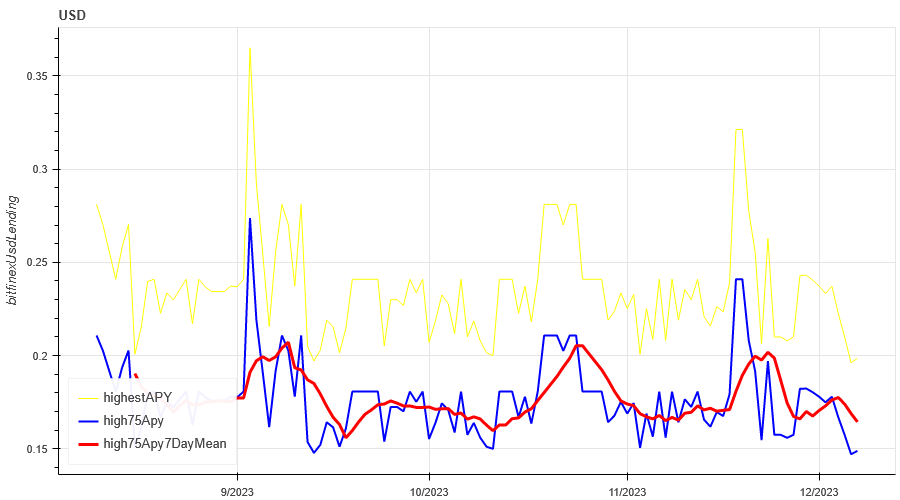
The yellow line is the highest price of the USD interest rate, the blue line is 75% of the highest price, and the red line is the 7-day average of 75% of the highest price
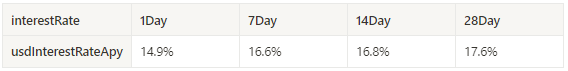
The table shows the average return of USD interest rate for different holding days in the past
Funding Rate_Contract Leverage Sentiment
The average annualized return on BTC tariffs in the past week was 11%, and contract leverage sentiment continued to flatten.
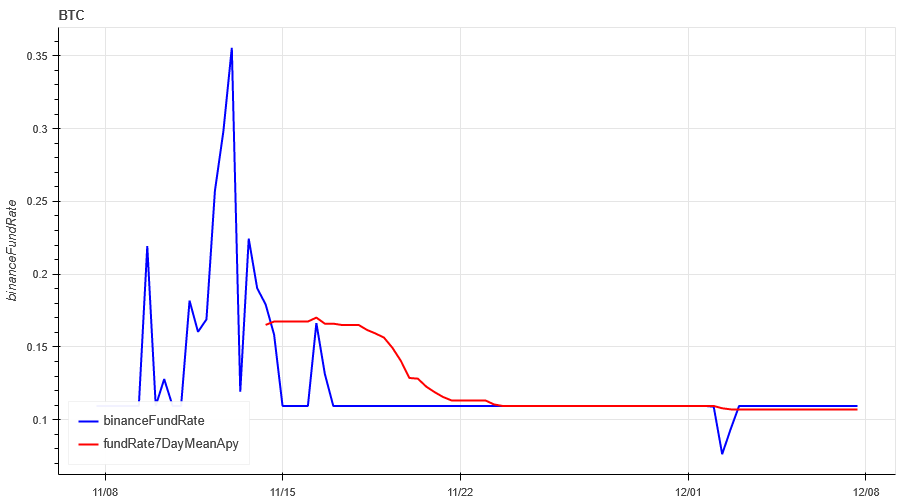
The blue line is the funding rate of BTC on Binance, and the red line is its 7-day average
The table shows the average return of BTC fees for different holding days in the past
Market Breadth_Overall Sentiment
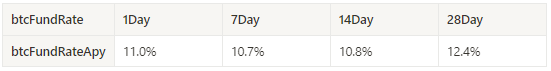
95% of the 46 coins selected in the past week were above the 30-day moving average, an increase compared to last week.
The picture above is [btc, eth, bnb, ltc, bch, doge, matic, sol,link,uni, enj,gala , mana, axs, dydx, fet ,gmx, xlm, xrp, ada, trx, sol, dot, avax, shib, atom, xmr, etc, ldo, hbar, apt, vet, qnt, vet,crv, aave, algo , ftm, ape, neo, sand, eos, xtz, rndr, theta, mkr] proportion above the 30-day moving average
Market Correlation_Consistent Sentiment
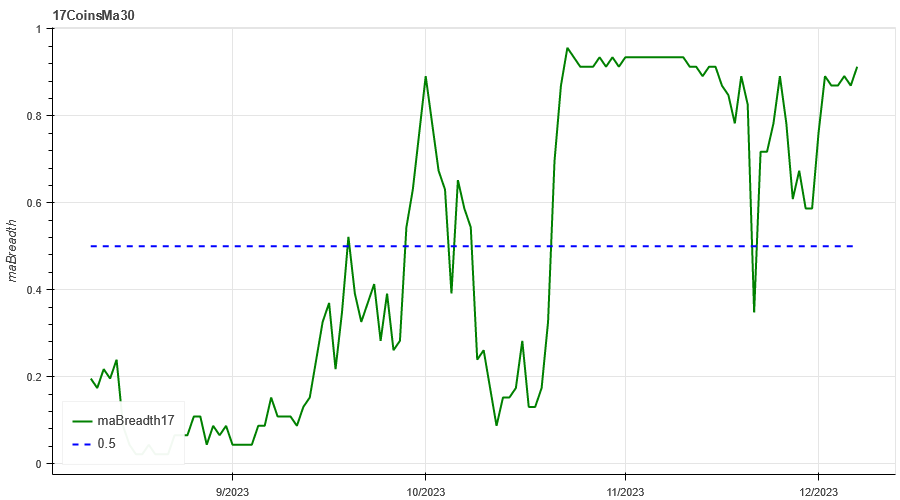
The correlation has risen to around 0.75 among the 46 coins selected in the past week, resulting in consistent upward movements across different varieties.
The blue line in the above picture first shows the Bitcoin price, and the green line is [btc, eth, bnb, ltc, bch, doge, matic, sol, link, uni, enj,gala, mana, axs, dydx, fet ,gmx, xlm, xrp, ada, trx, sol , dot, avax, shib, atom, xmr, etc, ldo, hbar, apt, vet, qnt, vet, crv, aave, algo, ftm, ape, neo, sand, eos, xtz, rndr, theta, mkr] overall Correlation
Market Hotspots_Social Media Sentiment
The most popular stocks in the past week were SOL/GALA/ETH, with sentiment rising and prices also hitting new highs.
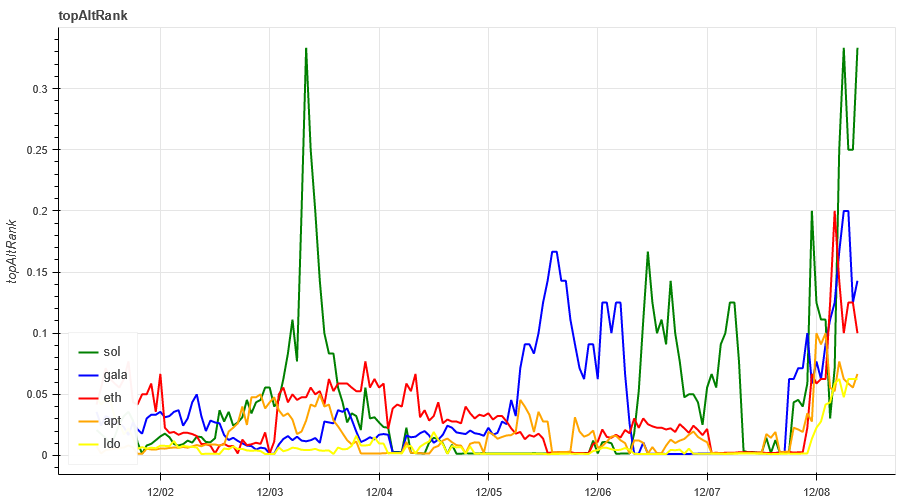
Data Sources:https://lunarcrush.com/categories/cryptocurrencies
Summarize
The market has gone out of trend this week. Both BTC and ETH have increased by about 14%, and the implied volatility has increased. In terms of price trends, BTC and ETH have both hit new highs in the past week. In terms of hot spots, SOL/GALA/ETH have recently been relatively high. , prices are gradually reaching new highs, so you can focus on it; in terms of events, you need to pay attention to tonights non-agricultural data.
Binance: CTA_ChannelCMT
Twitter: @DerivativesCN
Website: https://dcbot.ai/


