
Gryphsis Academy: DYDX valuation report, unlocking the truth about panic and data
1 Introduction
In the previous report dYdX v4: Economic model improvements and valuation outlook》In this article, we mainly studied the update of the dYdX v4 version, discussed the version features of v4, the marginal improvements compared to v3 and the reasons why dYdX left Ethereum to choose Cosmos, and concluded that Layer 1 staking, fee distribution, and Cosmos native stability The introduction of the three coins will jointly improve the fundamentals of the DYDX token and bring continued benefits to the token.
dYdX has seen some exciting improvements and developments since our last report. Recently, the new version has been launched on the mainnet. The market response has been good and the currency price has increased strongly. But it is also worth noting that dYdX will face a large number of initial allocation tokens being unlocked in December (accounting for 15% of the total token supply). How will the market react to potential selling pressure? Will the token release bring inflation and dilute the empowerment of v4? Can the benefits of the new version continue to drive the growth of DYDX tokens? Is December the last chance to get on board? In order to further explore the development prospects of dYdX and the expected value of the DYDX token, this article will be data-oriented and analyze from the valuation level based on the previous work. Use DCF and comparable analysis models to make reasonable predictions on dYdXs revenue and currency price, and predict the v4 staking yield to discuss the possible impact of this selling pressure.
2.dYdX Introduction
dYdX is a pioneer in decentralized perpetual contract exchanges. Its unique order book model brings a high-quality user experience comparable to centralized exchanges. Today, its market penetration reaches 60% of the total DEX volume. The new architecture and marginal innovation of v4 give dYdX greater competitiveness. On October 24, dYdX announced the release of dYdX Chain V1.0 and open sourced its code, marking the official start of the exchange’s v4 upgrade and the transition from the Ethereum Layer 2 network to an independent blockchain in the Cosmos ecosystem. . Open source code is at the heart of the blockchain ethos, bringing transparency to developers so they can review, detect bugs and improve quality. According to dYdX Trading Inc., the initial developer behind the exchange, the dYdX Chain V1.0 version and its order book have beenDevelopment completedand passed the finalaudit, the v4 upgrade will make dYdX fully decentralized and community-operated, meaning the company will no longer control the dYdX protocol and will not charge transaction fees.
October 27,dYdX Chain is officially launched on the mainnet. As an independent Cosmos Layer 1, dYdX Chain was officially launched on the mainnet by dYdX Ops subDAO. The validator created the genesis block of dYdX Chain at 01:00 (UTC+ 8) on October 27. The dYdX Operations subDAO public front-end for bridging will be launched on October 30, 2023, pending official confirmation and testing. After creation, it will be divided into two phases: Alpha and Beta. The Alpha phase will start on October 30, 2023, focusing on enhancing the stability and security of the network. The Beta phase will enable transactions but no rewards, and the transition from Alpha to Beta will be determined by factors such as governance voting.
This article will be in the previous articleReportOn the basis of, combined with the token unlocking situation and v4 version characteristics, conduct a valuation analysis of dYdX.
3. Valuation model
Our valuation is based on discounted cash flow analysis (DCF) and comparable analysis methods, both of which are included in our valuation model (DYDX Valuation Model) has a more detailed derivation, and the valuation can be adjusted accordingly based on actual future market conditions. Below is a detailed description and explanation of the valuation method.
DYDX supply in valuation
Although the verifiers and pledgers of dYdX Chain receive all the protocol fees (that is, only the pledged DYDX tokens can obtain cash flow from the protocol), since the freely circulating, unlocked DYDX can freely choose to be entrusted to nodes to obtain pledge income , so in the valuation, we choose the total token circulation as the basis, rather than excluding the token circulation after pledge. Our valuation time point is December 31, 2023. Considering the circulation after unlocking in December, the effective token base is 446 M.
top down
This article adopts a top-down valuation method. For each forecast year, the total derivatives trading volume of that year is taken as the starting point and multiplied by the DEX penetration rate to estimate the DEX derivatives trading volume of that year. Then, the transaction volume of dYdX for that year is obtained through the market share of dYdX, and finally the annual agreement income is calculated based on the effective commission rate.
3.1 Discounted cash flow analysis (DCF)
dYdX earns revenue by charging users fees to generate cash flow. The protocol was managed by dYdX Trading Inc. prior to v4, with all cash flow owned by the company. After v4 improvement, dYdX is controlled by dYdX Operations subDAO and implements completely decentralized management.dYdX OfficialAnnounced, dYdX Chain will distribute all protocol fees, including USDC-denominated transaction fees and DYDX-denominated Gas fees, to validators and stakers. We can assume that DYDX token holders can capture 100% of the cash flow from the development of the protocol.
Based on the above conditions, we believe that the discounted cash flow method is most suitable for DYDX currency price valuation. Discounted cash flow (DCF) is an absolute valuation method used to estimate the value of an asset based on its expected future cash flows. The principle is that the value of a company is calculated based on the cash flows it can generate in the future, which is equal to the cash flow discounted at a discount rate that reflects its risk. Our model is based on the data before September 30, 2023, takes 5 years as the prediction period, and uses the terminal value to represent the future long-term cash flow under the ongoing operation of the agreement, and estimates the value of DYDX tokens on December 31, 2023. value.
3.1.1 Assumptions
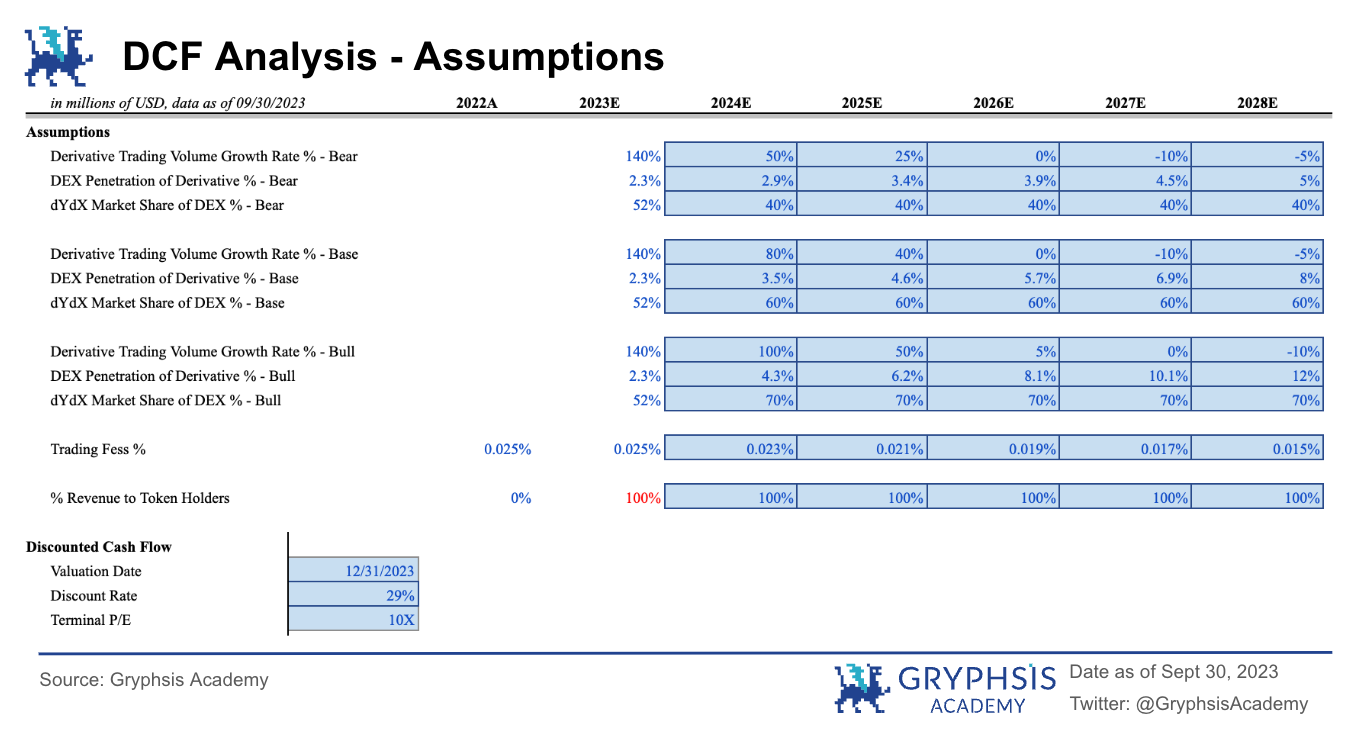
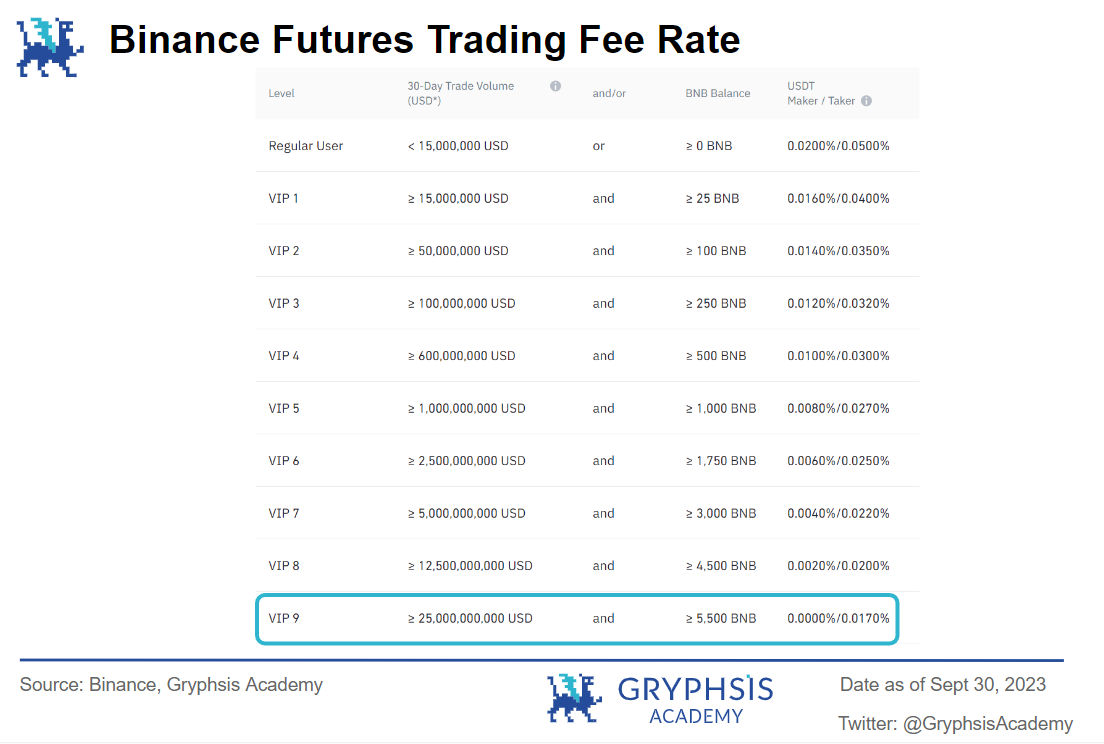
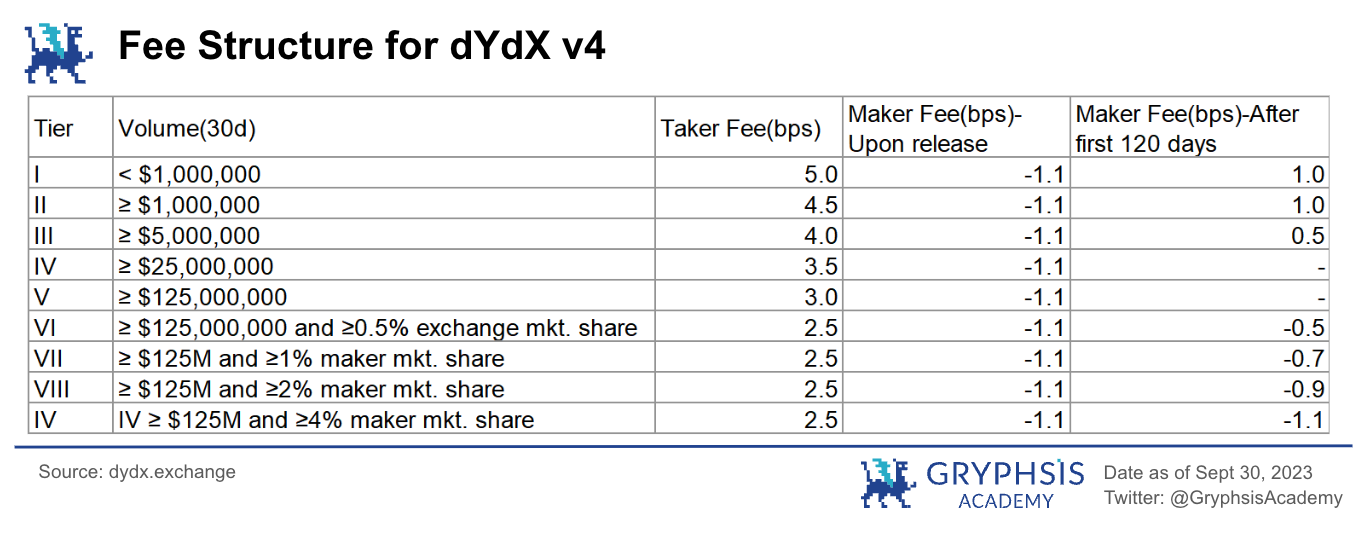
Transaction Fees:Compared with various perpetual contract agreements, dYdX has a lower handling fee level and has certain advantages. Based on v3, v4 divides the handling fees into 9 levels and provides different transaction rewards. Dividing the handling fee income by the transaction volume in 2022, we calculated an average rate of 0.025% as the protocols handling rate. As market competition becomes more intense, the overall handling rate of the exchange decreases. Finally, the effective handling rate of dYdX decreases linearly to 0.015% (shared by both buyers and sellers), which is close to the largest centralized exchange Binance VIP 9. Monthly trading volume $2.5 billion in preferential rate levels.
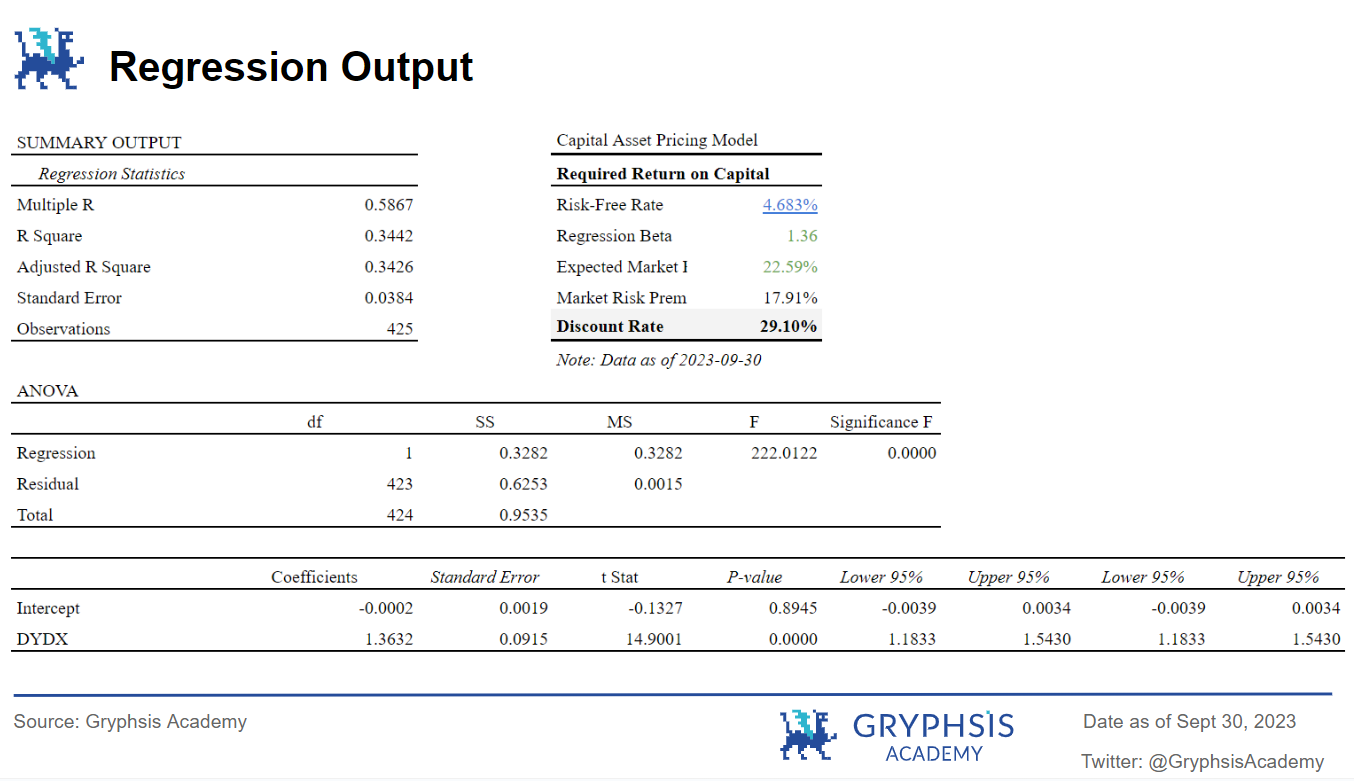
discount rate:Based on our assessment of current protocol developments and market risks, we set a cash flow discount rate of 29% from 2023 to 2028. When calculating the discount rate, we use the 10-year US Treasury bond as the risk-free rate and BTC as the market benchmark. The β value is obtained from a regression model of DYDX returns as a function of BTC returns. The regression analysis is based on one year of data and selects the starting time when the currency price is consistent with the current market price, that is, the data from August 1, 2022 to September 30, 2023. The Capital Asset Pricing Model (CAMP) calculates the capital cost rate to be 29.10%. Regression analysis shows that DYDX price is significantly positively correlated with BTC returns. To sum up, we choose 29% as the discount rate, which is similar to the average return rate of venture capital funds of 30% and is more reasonable.
Terminal value price-to-earnings ratio:DeFi is an asset-light industry, so we choose to use the exit multiple method to back-calculate the final value. Referring to the price-to-earnings ratios of publicly listed traditional exchanges, 10 times was finally selected as the final exit multiple of DYDX.
Expected trading volume:Trading volume is directly related to the protocol’s revenue and is the core driver of DEX value. In order to predict the potential value range of DYDX under different market conditions, this report assumes three different trading volume growth scenarios.
Each forecast period starts with annualized total derivatives trading volume since September 30, 2023, from which annual growth rates are applied. According to the law of industry development, we assume that during the forecast period (2023 to 2028), the annual growth in derivatives trading volume will be rapid from 2024 to 2025, and then gradually slow down every year, and reach negative growth in the final period. The reason is that considering the expected reduction in BTC production next year and the Federal Reserves interest rate cut, the crypto world is likely to usher in a bull market in the next two years, so we give higher growth expectations for 2024 and 2025.
In order to obtain the trading volume of dYdX, we set based on historical data that the protocol has a constant market share of 40% -60% (varies according to different market conditions) in the total derivatives DEX trading volume. Heres an overview of DYDXs expected trading volume under each scenario:
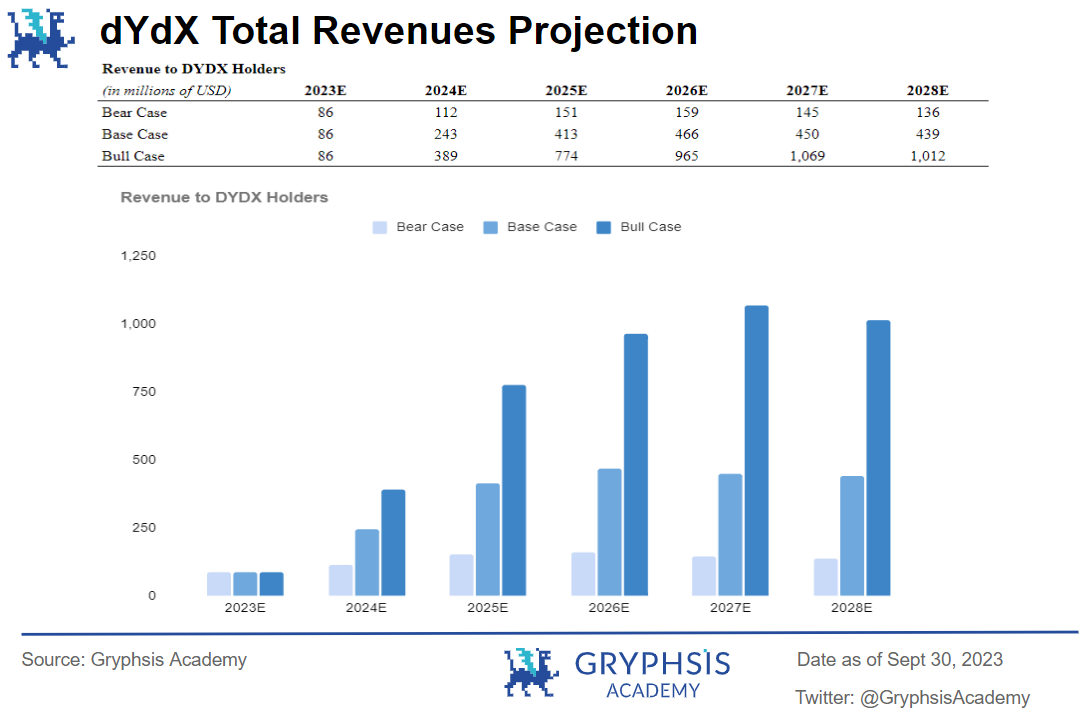
Baseline situation: The trading volume of derivatives will grow at a rate of 80% in 2024 and gradually decrease to -5% in 2028. With the booming development of DeFi or the increase in the adoption rate of DEX, the total trading volume of dYdX in 2028 is expected to be $2.93 trillion.
Bear market scenario: The trading volume of derivatives will grow at a rate of 50% in 2024 and gradually decrease to -5% in 2028. As cryptocurrencies are subject to regulatory sanctions, growth slows down or the overall usage of DEX decreases, users are more inclined to CEX, the total dYdX trading volume in 2028 is expected to be $0.91 trillion.
Bull market scenario: The trading volume of derivatives will grow at a rate of 100% in 2024 and gradually decrease to -10% in 2028. With the successful implementation of the dYdX chain and v4 version, the cryptocurrency industry will receive major regulatory benefits and is expected to dYdX’s total trading volume in 2028 is $6.75 trillion.
In the past 9 months, the total trading volume of the top 20 derivatives DEXs has reached approximately US$0.49 trillion, of which dYdXs share accounted for US$0.26 trillion. The total trading volume of derivatives on the top 10 centralized exchanges is 20.49 trillion. At the time of writing, DEXs account for approximately 2%-3% of total CEX trading volume.
Multiplying the expected transaction volume by the fee rate, we get the following expected revenue:
3.1.2 DCF analysis
It should be noted that the current value of the tokens in this article is based on the token circulation on December 31, and does not involve the increment of token unlocking in subsequent years. But considering the more aggressive discount rate of 29%, dYdXs dilution risk in the current situation can be offset to a certain extent.
The following are the corresponding DCF results in the three scenarios:
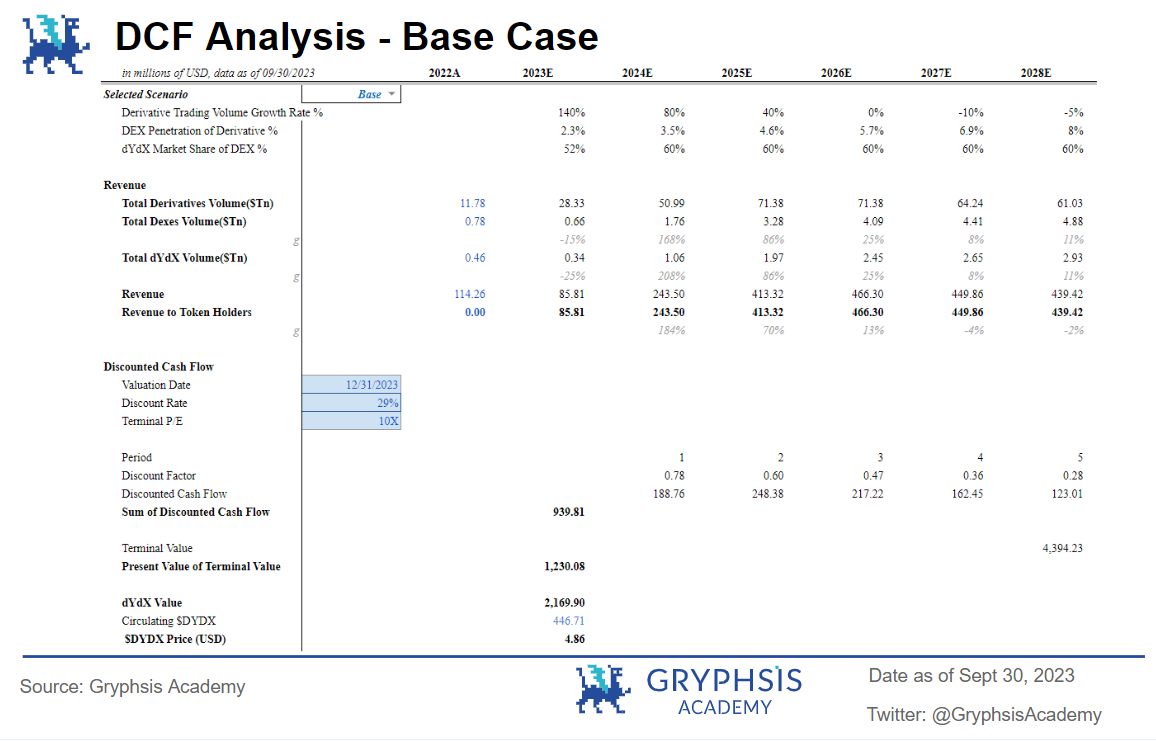
Baseline Scenario: In this scenario, the DYDX token price is expected to be $4.86, with the protocol valuation on December 31, 2023 being $2.170 billion.
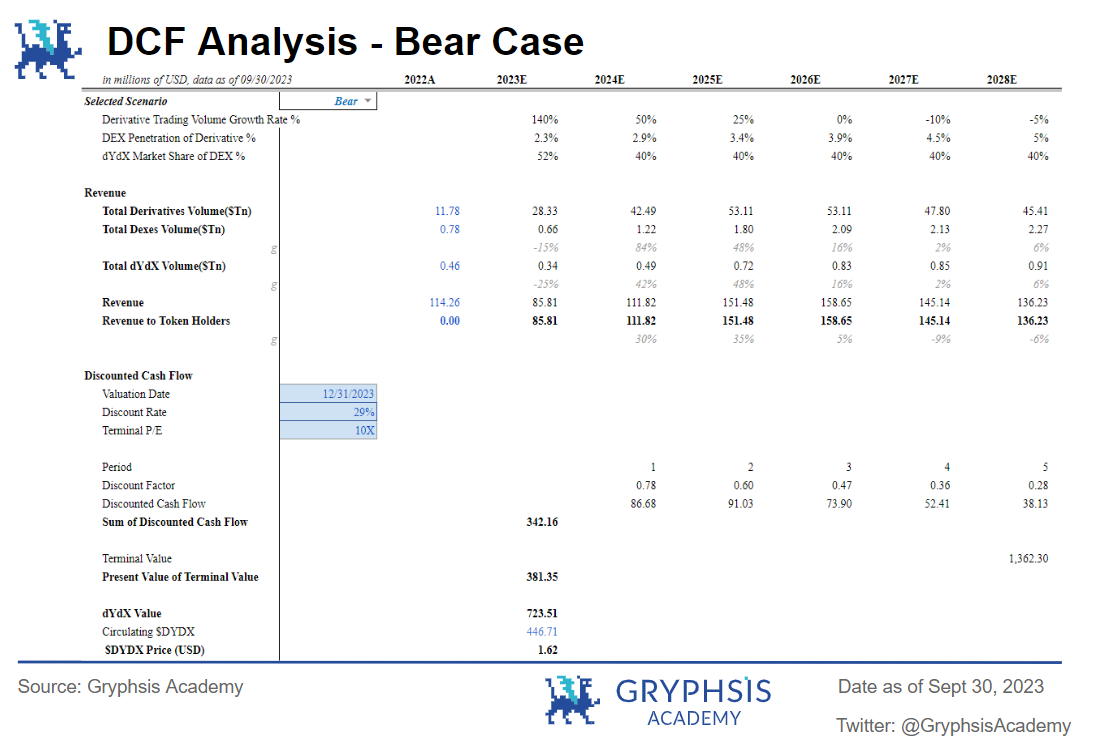
Bear market scenario: In a bear market, the DYDX token price is expected to be $1.62, with the protocol valuation on December 31, 2023 being $724 million.
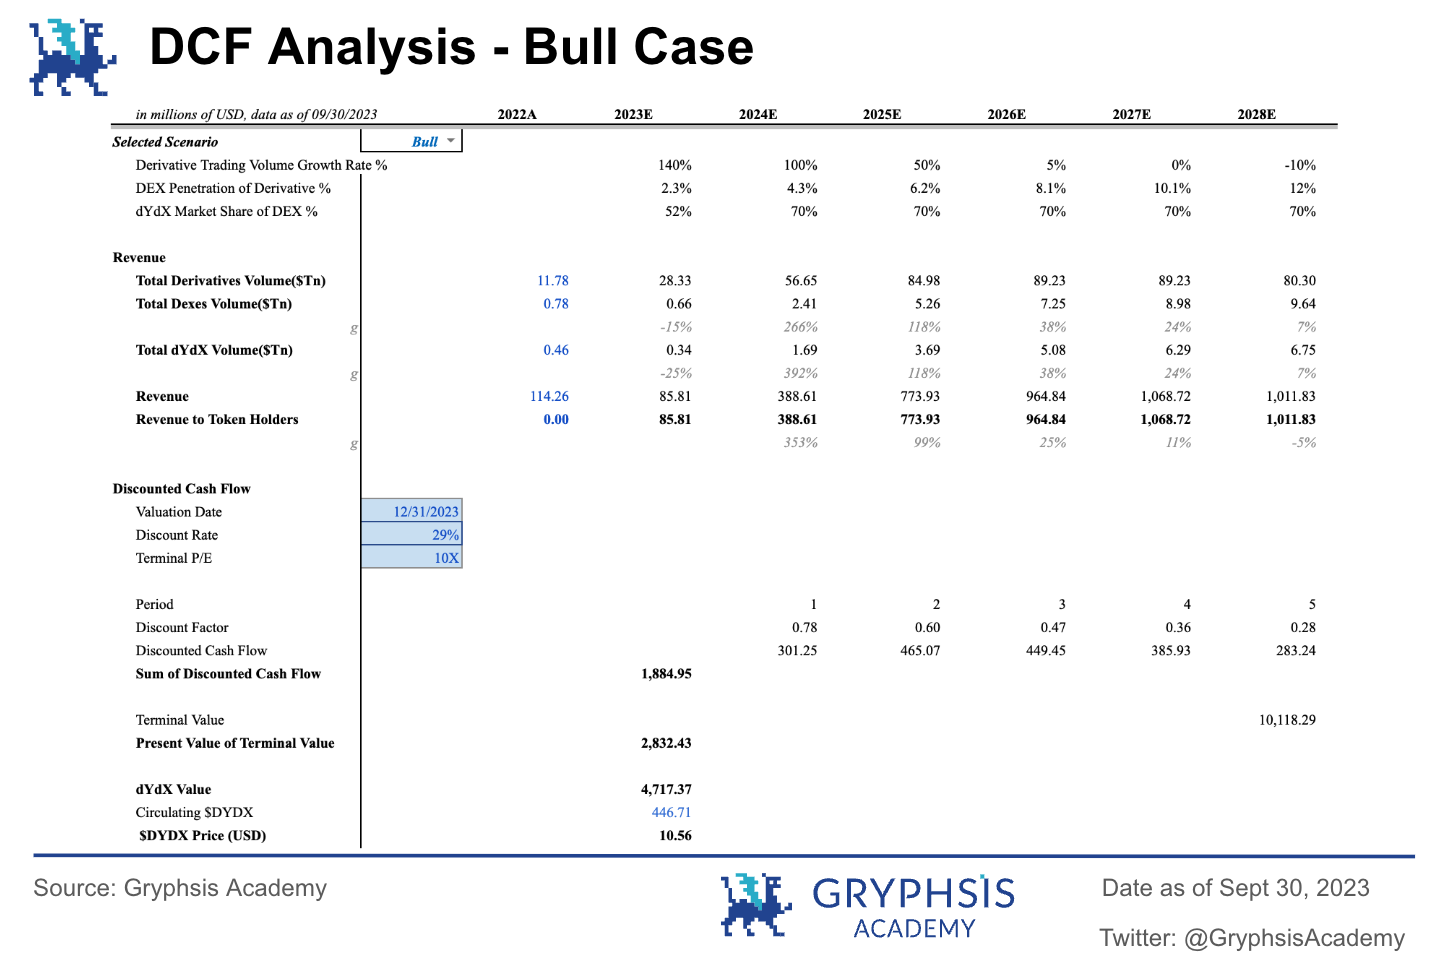
Bull market situation: In the bull market, the DYDX token price is expected to be $10.56, and the protocol valuation on December 31, 2023 is $4.717 billion.
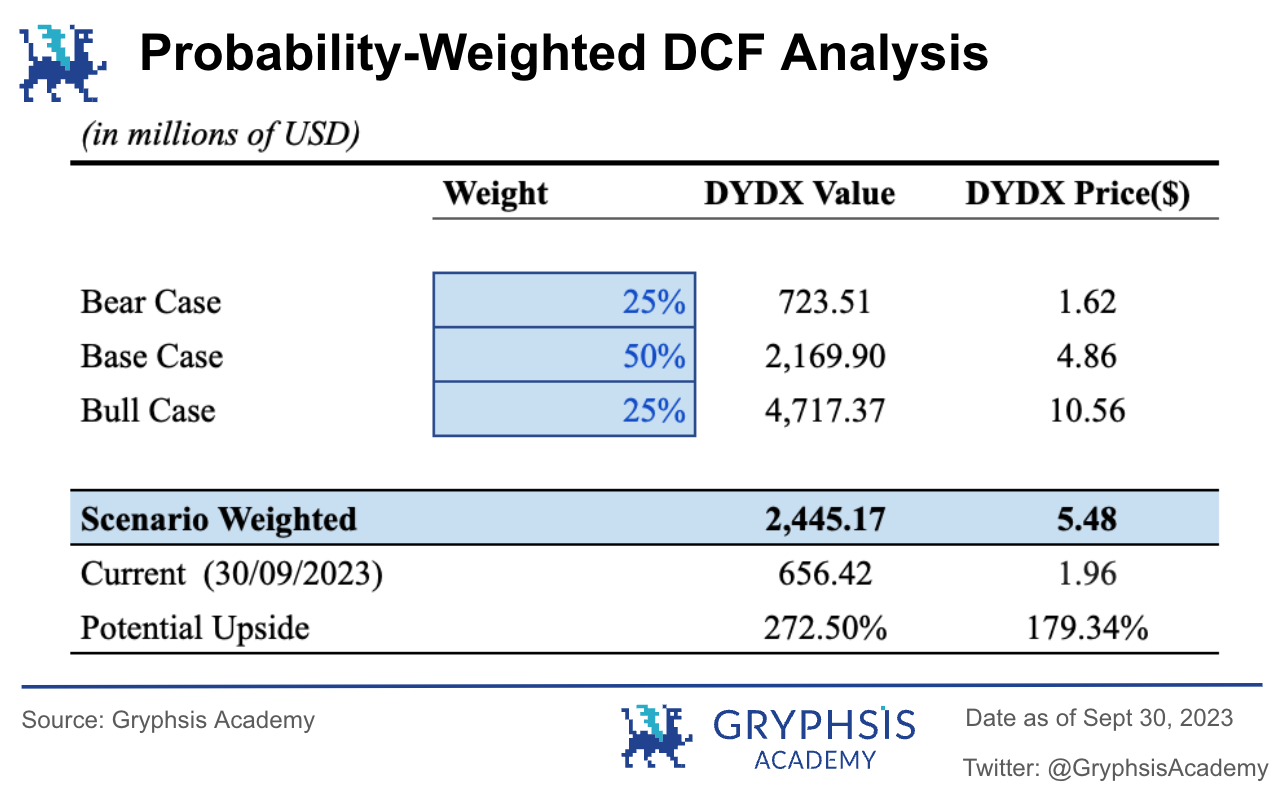
3.1.3 Probability weighted scenario analysis
We assign a probability of 25% to the bull and bear markets respectively, and a probability of 50% to the baseline scenario. After calculation, the probability-weighted DCF valuation of the DYDX price is US$5.48, and the protocol is valued at US$2.445 billion. The DYDX price on September 30, 2023 is $1.96, so DYDX has a potential upside of 179.34%.
3.2 Comparable analysis
Comparable analysis is a method used to assess the value of a company or project relative to its peers. The basic assumption is that blockchain projects of similar scale and nature should theoretically have closer valuation multiples. Comparable analysis methods usually use the price-to-sales ratio (P/S) and the price-to-earnings ratio (P/E) to conduct comparative valuations of the objects being evaluated.
When conducting comparability analysis, it is crucial to select a reference object that is as similar as possible to the company or project being analyzed in terms of industry, business model, risk profile and market dynamics. By ensuring the comparability of these aspects, the impact of external factors on the analysis can be reduced, allowing us to focus more on the intrinsic value factors of the analyzed enterprise or project. The four comparable projects we selected all belong to the decentralized derivatives contract trading industry, namely Synthetix, GMX, Gains Network and Perpetual Protocol. They have similar business characteristics and risk profiles, and these four projects have all been in the lead Blockchain exchange Binance is listed for trading in compliance with the exchange’s market standards, which will help enhance the effectiveness of comparative analysis. Finally, by using DEX derivatives projects within the same decentralized financial market as comparable objects, differences in market risk analysis between different industries can be resolved.
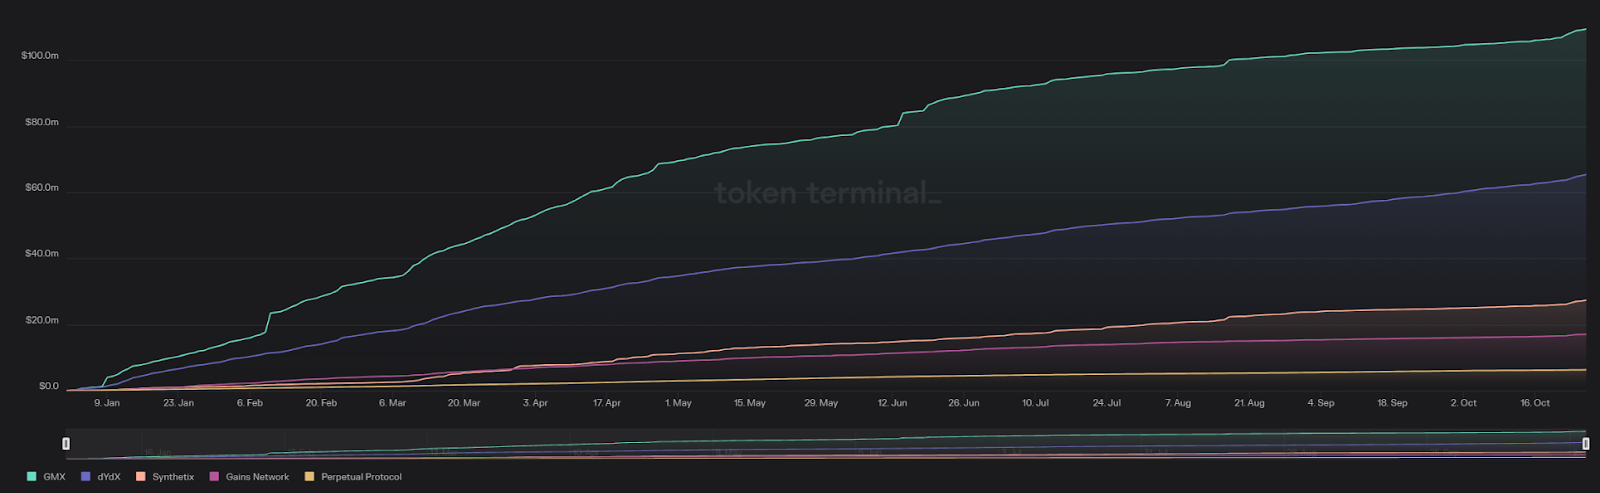
2023 Cumulative Revenue for 5 Protocols, Source: Token Terminal
The above is a comparison chart of the annual cumulative income of these five projects as of October 27, 2023. As can be seen from the figure, GMX’s project has the highest income and is the only one among the five that has received more than 100 million US dollars. , dydx’s revenue was second, reaching 65.4 million U.S. dollars, and Perpetual Protocol’s revenue was the lowest, at 63 million U.S. dollars.
The following is a summary of the analysis of comparable items:
dYdX: Since its launch in 2021, the DYDX token has faced challenges from scarcity of supply and lack of utility. Although it has a market share of over 50% in the DEX perpetual contract market, its token circulation ratio is much lower than that of peer projects. Before v4, the main uses of DYDX tokens were governance and staking to obtain fee discounts, butNew version planIntroducing more uses, such as all fees generated by dYdX Chain will be distributed to validators and token stakers in the future. Of course, investors may still be concerned about future large-scaleToken unlockthe impact brought about.
GMX: GMX is a DEX platform that supports spot and perpetual contract trading, focusing on derivatives trading. Unlike other comparable projects, GMX adopts a global liquidity model, where users provide liquidity by purchasing and staking the liquidity token GLP issued by the GMX protocol. Holders of $GMX can stake their tokens and earn 30% of the protocol fees generated by the GMX protocol. Stakeholders of $GMX can also earn $esGMX and Multiplier Points (MP) to further increase their yields. Owners of $GMX are also granted voting rights to participate in the governance of the GMX protocol, giving them a say in the community fund.
SNX (Synthetix): Synthetix’s perpetual contract products are not intended for end users, but are provided as back-end products to support developers and DeFi derivatives liquidity platforms. Users can interact with DeFi products that have integrated Synthetix Perps contract functions without having to directly use or directly interact with the Synthetix Perps contract. Currently, the trading volume of Synthetix perpetual contracts is mainly generated by the spot and derivatives trading platform Kwenta, and Kwenta is actually a decentralized contract product for trading users, which is built based on the Synthetix Perps component. The circulating supply and total supply of SNX tokens are almost equal. SNX still uses a weekly inflation system as a reward for SNX stakers. Stakeholders have different SNX reward pools on Optimism and Ethereum, and have different annual staking returns. SNX currently has the lowest inflation, and its inflation varies based on the staking ratio. However, SNX inflation rewards are subject to a one-year lock-up period, further reducing the impact on the token supply. However, the utility of the SNX token may change in the future.
Gains Network: Gains Network revolves around the ecosystem’s ERC 20 utility token ($GNS). $GNS is designed to serve as the platform’s utility token, enabling ownership of the protocol through revenue capture and platform governance (coming soon). It includes $GNS holders receiving platform fees through Single Sided Staking, and using platform revenue to burn $GNS. The leverage limit within the Gains Network platform is 9 times, and the interest limit for opening positions is low. It may not be the ultimate choice for all traders, but it has established a solid position among junior traders. Currently, GNS distributes 61.23% of its revenue to $GNS stakers.
Perpetual Protocol: Perpetual Protocol is a decentralized perpetual contract trading protocol built on Ethereum. The protocol uses a virtual AMM (vAMM) design, which can support up to 20x leverage, allow short positions to be opened, and has lower slippage than other AMMs. Unlike automated market makers, which are used for token swaps and price discovery, vAMM is only used for price discovery to handle leverage and short positions. Similar to Uniswap, traders can trade with vAMM without the need for a centralized authority, and it is designed to be market neutral and fully collateralized. PERP is the protocols ERC-20 native token. Perpetual Protocol allows community members to participate in protocol management and pledge their tokens to the pledge pool within a specific period of time. In return, holders will receive staking incentives, including PERP rewards and transaction fees.
3.2.1 Variable considerations
Price/Earnings Ratio:The price-to-earnings ratio is a financial indicator that can be used to measure the relationship between the current token price and earnings per share of a blockchain project. This ratio is usually used to evaluate the investment value and risk level of the project. P/E ratios can vary significantly across industries and project types, so comparisons with blockchain projects in the same industry or market averages are often required.
Price/Sales Ratio:The price-to-sales ratio is often used to assess the valuation of traditional companies based on revenue. For DEX projects, protocol fees (called “sales revenue” in traditional companies) are a key factor in assessing their financial performance and sustainability. By using the price-to-sales ratio, which takes into account the relationship between the market capitalization (price) and the fees incurred by the protocol, you can understand how the market assesses the earning power of the protocol.
Average P/S ratio:We adopt the market multiple method commonly used in the crypto industry and use the average of the price-to-sales ratios of five comparable projects as the market multiple. By calculating the average, we essentially take into account the upper and lower bounds of comparable items, providing a balanced market multiple estimate. Therefore, we choose to use the average of comparable items as a quantitative market multiple to avoid the potential bias that may arise from relying solely on the maximum or minimum value.
Median:Statistically speaking, the median is not affected by extreme values in the distribution sequence, which improves the representativeness of the distribution sequence to a certain extent. Therefore, we choose the median as the reference factor for the market multiple.
Annualized Total Revenue:By analyzing the revenue generated by a blockchain project, one can evaluate its ability to generate revenue and maintain operations. Revenue is a key indicator of a projects financial health and growth potential. The evaluation of protocol fee income helps to understand the revenue streams directly related to DEX trading activities and the profitability of the DEX protocol. Protocol revenue can come from various sources within the DEX protocol, including transaction fees, margin fees, clearing fees, and funding fees, etc. By considering protocol fee revenue as a variable, analysts can evaluate the diversification of revenue streams. This helps assess a protocol’s ability to withstand market fluctuations and long-term viability.
Profit (Annualized Revenue to DYDX Holders):In the traditional stock market, earnings in P/E refers to the net profit actually earned by a company during a specific period of time (usually quarterly or annually). This is an important financial indicator that investors pay attention to and is used to measure the companys performance. profitability and financial health. However, in the blockchain field,"earnings"concept may not be applicable. This is because DeFi projects don’t make money in traditional ways, and they typically don’t have net profits or earnings per share similar to traditional companies. Instead, their economic models may involve token transaction fees, liquidity mining rewards, loan interest, etc. being converted to net income for the project or token holders.
3.2.2 Valuation using comparable analysis method
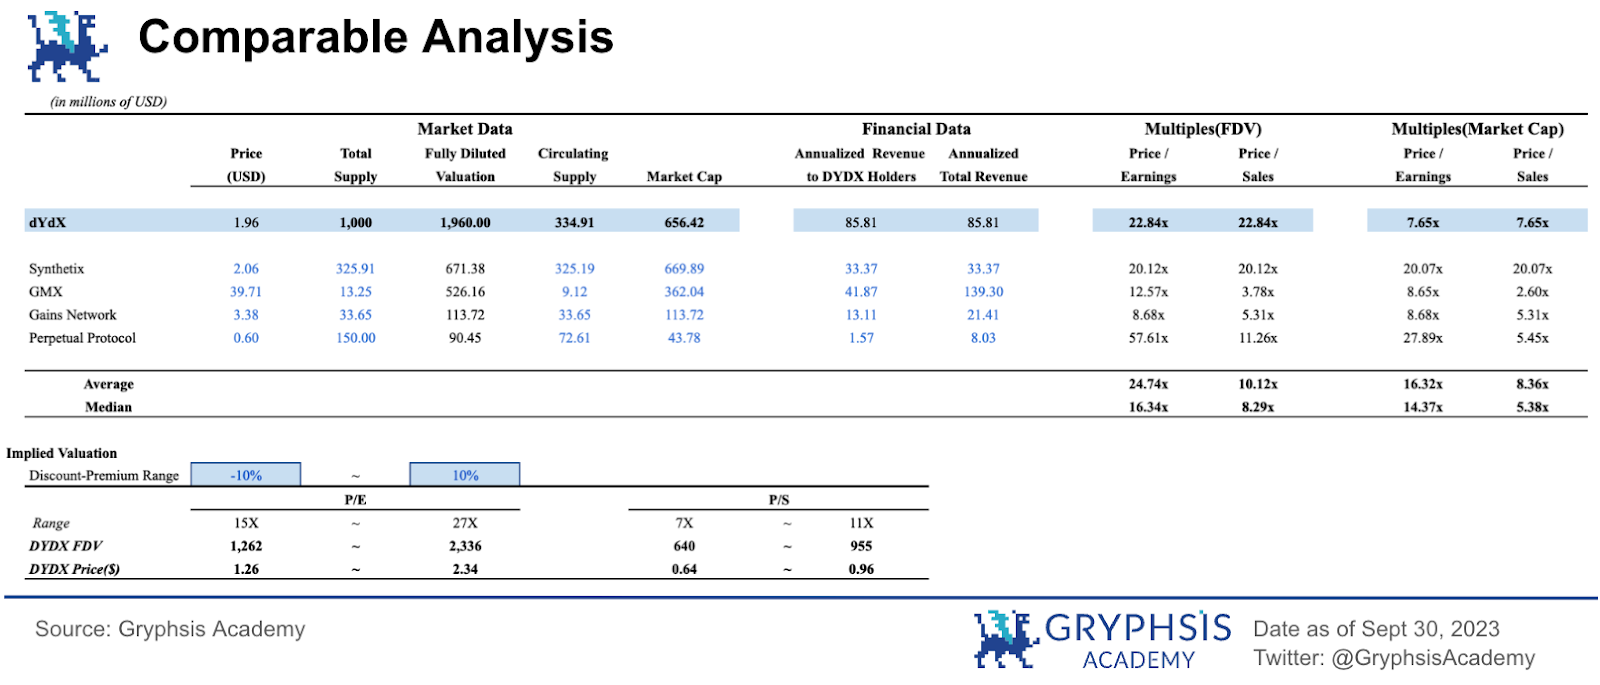
The chart above shows the project valuation and token price based on Price/Earnings Ratio and Price/Sales Ratio. We used data from January to September 2023 to estimate the projects fee income and net income for the entire year. dYdXs estimated annualized total revenue is $85.81 million, indicating that dYdX has good revenue-generating capabilities. Additionally, dYdX’s price-to-earnings ratio is low relative to the average ratio of selected decentralized derivatives protocols, raising the possibility of being undervalued. Finally, based on the price-to-earnings ratio, a potential price for dYdX is deduced to be between $1.26 and $2.34.
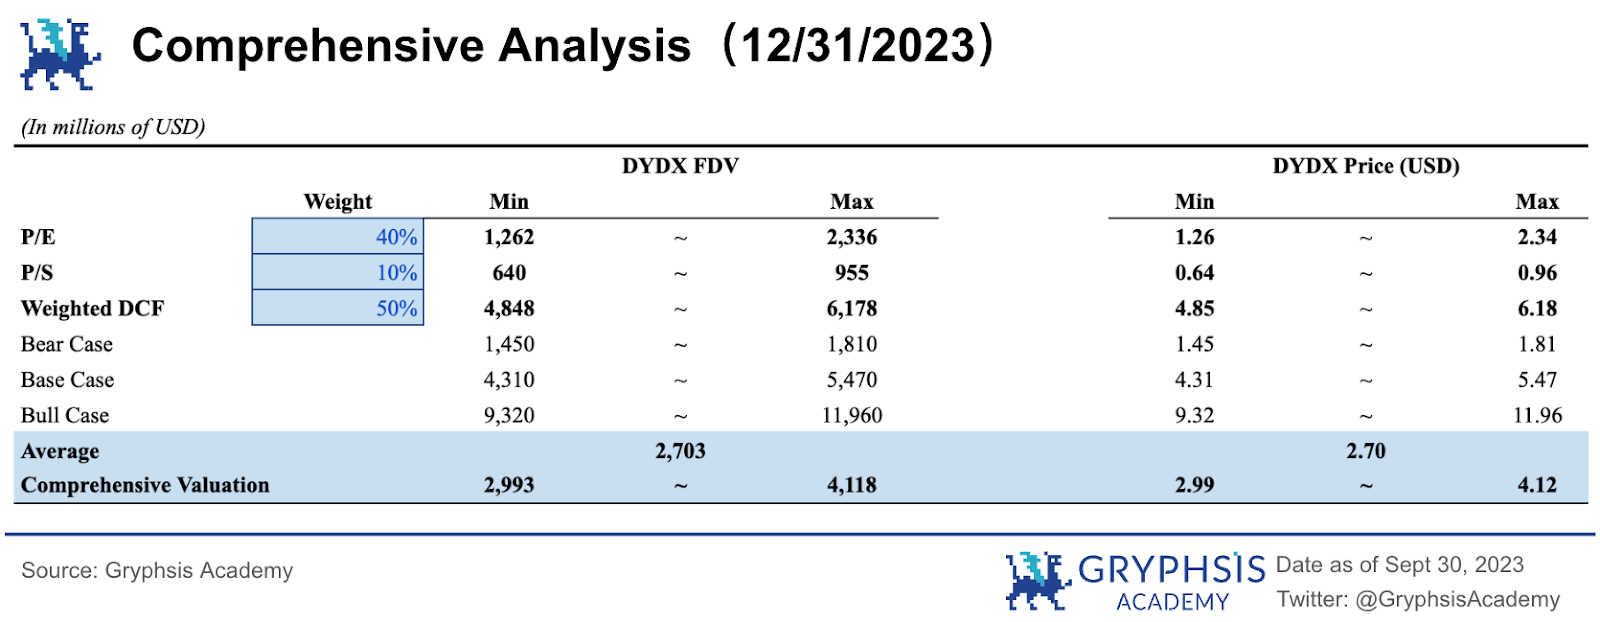
3.3 Comprehensive analysis
Finally, we conducted a sensitivity analysis on the key variables of DCF and obtained the final valuation range.
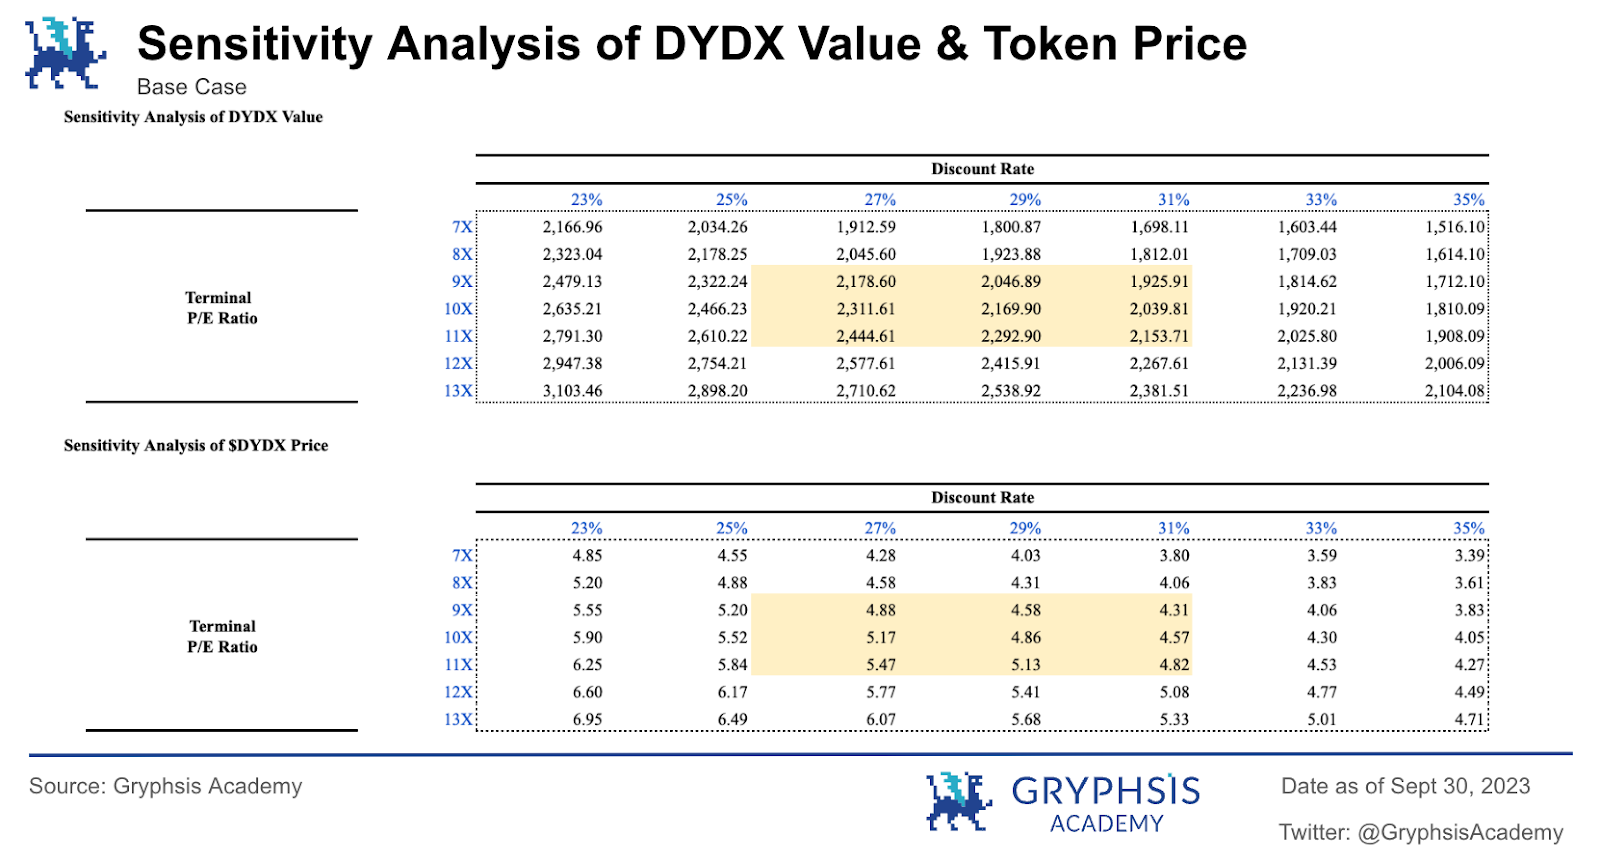
At the same time, we select the maximum and minimum values of the probability-weighted DCF valuation under different terminal value P/E ratios and discount rates from the sensitivity analysis. Due to differences in value capture (Value Caputure) and token economic models (Tokenomics) between the five comparable projects, in the comprehensive valuation analysis, we gave more weight (40%) to the P/E valuation to improve The accuracy of the model, and the P/S valuation also has a certain reference value, so it is given a weight of 10%. Based on this, the total weight of the comparable analysis is 50%. The other 50% is allocated to the weighted DCF valuation. Finally, the comprehensive analysis resulted in a price range of DYDX tokens of US$2.99-4.12, and a fully diluted valuation (FDV) range of US$2.993-4.118 billion.
Since DCF gives a higher valuation, which generally raises the comprehensive valuation, the biggest highlight of v4s impact on the economic model is that the transaction fee is changed from v3s dYdX company to 100% charged by the pledge node. The cash flow captured by the currency has huge room for growth and should be given a higher valuation multiple to reflect its growth potential. Therefore, the valuation method using the average P/E and P/S of comparable protocols will be somewhat underestimated.
It is worth noting that the establishment of the valuation model and the derived token price are based on the current provided data and market operations. Actual future market dynamics and the operational performance of the dYdX project will ultimately determine its true market value.
4. Unlock discussion
4.1 Valuation premium
In the valuation analysis of dYdX, there is an obvious valuation premium, mainly due to the limited liquidity supply caused by staking. DYDX, as the L1 token of the dYdX chain, is used not only for fee payment, but also for validator pledge to ensure on-chain security. Currently, the average staking rate across the Proof-of-Stake (PoS) network is 52.4% , referring to the long-term pledge rate of existing PoS public chains such as BSC and Solana, which is between 40% and 70%, the pledge rate of the dYdX chain is likely to exceed 40%. This will significantly reduce the circulation of DYDX. If the demand for the token remains unchanged, the currency price will rise significantly.
4.2 Calculation of pledge yield
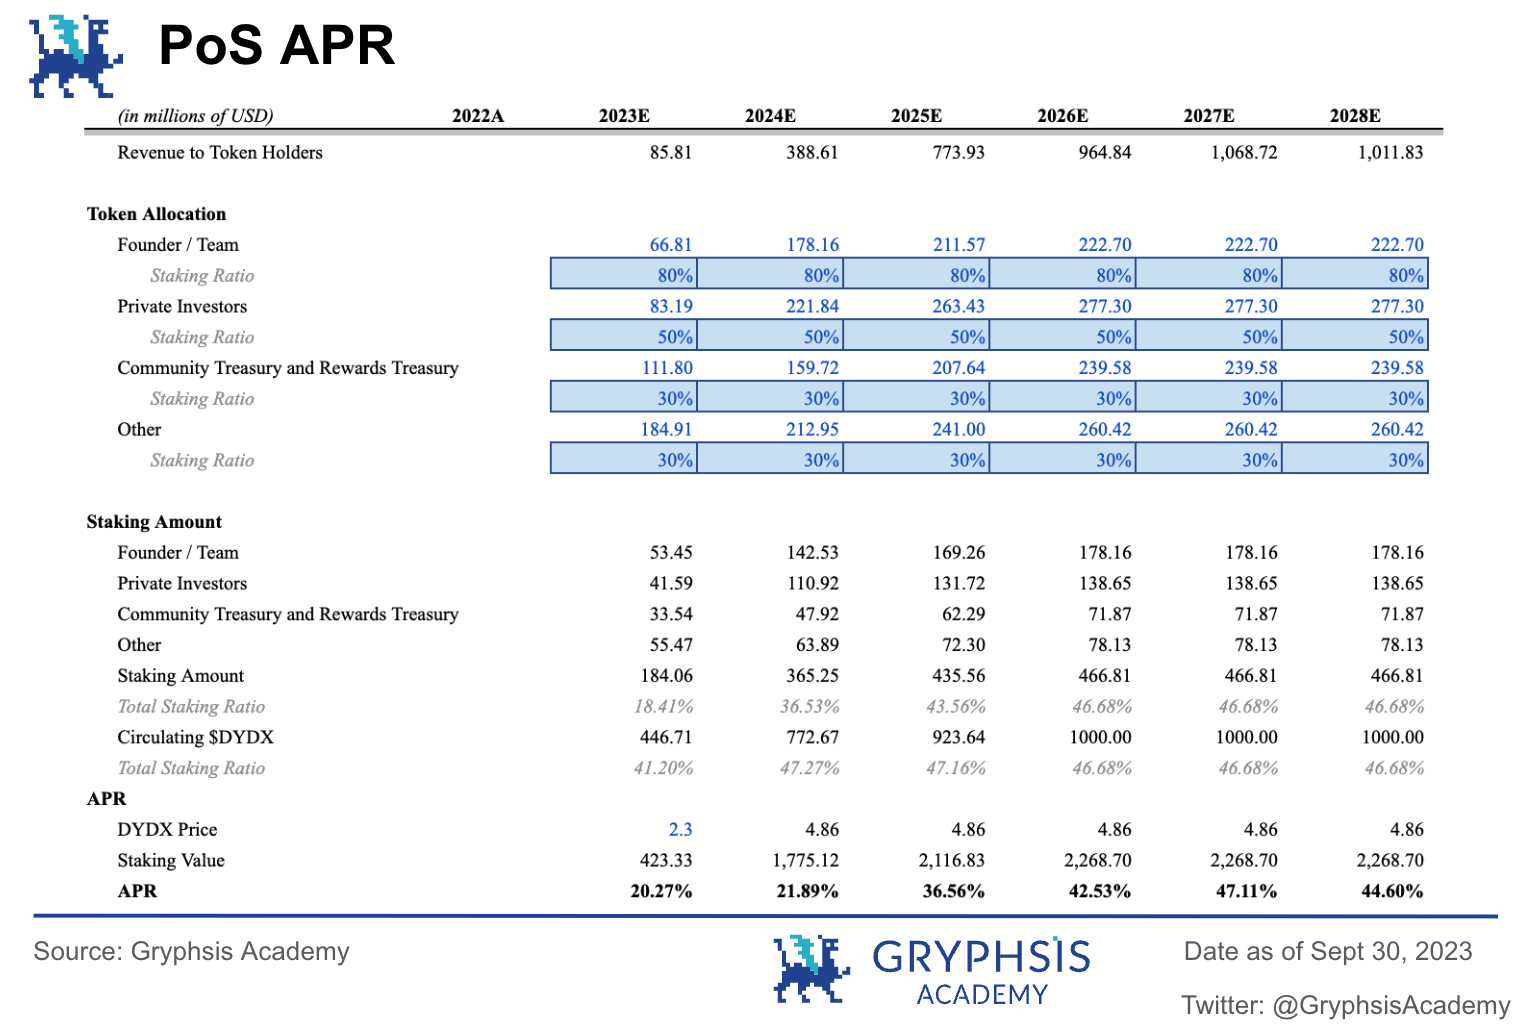
In December this year, dYdX will unlock nearly 150 M tokens (accounting for 15% of the total supply), and the token circulation will increase from the original 296 M to 446 M. The market may be concerned about unlocking such a large number of tokens at once. Will these tokens bring about substantial inflation in the short term and dilute the benefits of v4?
In this regard, we believe that the market does not need to worry about the token unlocking in December. The reason is that unlocking a large number of tokens will not bring about a significant increase in token circulation. We can note that the tokens unlocked this time are the initial shares distributed to the team and investors, and they will most likely pledge most of the tokens. Generally speaking, in the early stages of the development of the PoS public chain, users have a lower pledge rate due to risk considerations, and the corresponding annualized rate is higher at this time. With the development of public chains, the pledge rate will gradually increase. Currently, the average pledge level of Proof of Stake (PoS) networks on the market is approximately52.8% , the yield on the chain is 10.2% . Based on this, we estimate the pledge situation and APR of the dYdX chain (as shown in the figure). According to our valuation model, dYdX’s revenue in 2023 will be 85 M. Assuming that the team and investors pledge 80% and 50% of the unlocked tokens respectively, we can conclude that the annualized rate of return of the pledge is 20.27%. At this time, the pledge The rate is 41.2% (calculated based on the circulation quantity). The pledge rate on the dYdX chain gradually increases every year, and eventually reaches a stable state (around 46.68%). If the price meets the valuation based on the baseline situation, the annualized rate will rise to 44.5% in 5 years, with a high rate of return. Therefore, the token still has a lot of room for growth in the future. In summary, we believe that the team and investors will most likely pledge the tokens, and the unlocking of tokens at the end of the year is less likely to bring dilution risks.
5. Summary
This article adopts a top-down valuation method and uses cash flow analysis (DCF) to reasonably calculate the protocol value currency price of dYdX. Through probability weighting, the protocol is valued at US$2.445 billion, and the expected price of $DYDX is US$5.48, with a potential upside of 2-3 times. Finally, combined with the P/E and P/S valuation methods, a comprehensive analysis concluded that the token price range of DYDX at the end of 2023 is US$2.99-4.12, which is still a certain increase compared with the current token price of DYDX on the market. potential.
Facing the potential dilution risk brought by the unlocked tokens in December, we believe that since the main distribution targets of the unlocked tokens this time are teams and investors, the dYdX chain staking incentives are strong, and the annualized return rate exceeds 20%. The unlocked tokens There is a high probability that it will be pledged and will not cause major selling pressure on the market.
References
https://docs.dydx.community/dydx-governance/
https://dydx.exchange/blog/v4-rewards-and-parameters
https://dydx.forum/t/dydx-v3-vs-v4-new-trader-rewards-overview/881
https://www.washingtoncompanysearch.com/companies/dydx-trading-inc/
https://help.dydx.exchange/en/articles/4798063-location-restrictions
https://www.binance.com/en-JP/feed/post/818240
https://dune.com/dydxanalytics/dydx-unified-dashboard
https://dune.com/impossiblefinance/derivatives-perpetual-markets
https://members.delphidigital.io/reports/dydx-valuation-analysis-dex-perps-comparison#synthetix-f08e
Disclaimer: This report is produced by@GryphsisAcademystudents@elliett 2077 , @0x CryptoAndrew,exist@CryptoScott_ETHOriginal works completed under the guidance of. The authors are solely responsible for all content, which does not necessarily reflect the views of Gryphsis Academy, nor the views of the organization that commissioned the report. Editorial content and decisions are not influenced by readers. Please be aware that the author may own the cryptocurrencies mentioned in this report. This document is for informational purposes only and should not be relied upon for investment decisions. It is strongly recommended that you conduct your own research and consult with an unbiased financial, tax or legal advisor before making any investment decisions. Remember, the past performance of any asset does not guarantee future returns.


