
Analysis of ETH’s recent price performance and direct influencing factors
Original author: duoduo, LD Capital
Recently, Bitcoin has risen relatively strongly, trying to break through the resistance range of 28000-28500 several times; ETH has been relatively weak, testing the resistance level of 1750 only once. ETH This article briefly analyzes the recent price performance of ETH and possible influencing factors.
1. Price performance
ETH/BTC: Down since 2022 MERGE
In the past year, ETH has been in a weak position relative to BTC. Judging from the ETH/BTC indicator from 2022 to the present, it was in a state of decline from the beginning of 2022 to June, falling from 0.081 to around 0.050. Since then, due to the favorable merger, there has been a rebound, returning to around 0.8 in September 2022. After the merge was implemented, the indicator was in an overall downward state, currently at 0.058, which is close to the weekly EMA 200.
However, in the long term, ETH/BTC is in growth mode. Extending the time scale, during the bear market in 2018, ETH/BTC reached a minimum of 0.01, and in the bear market from 2022 to the present, ETH/BTC was recently at 0.05. This is mainly due to the development and growth of the ETH ecosystem, which has accumulated a large amount of on-chain value compared to the previous bear market.
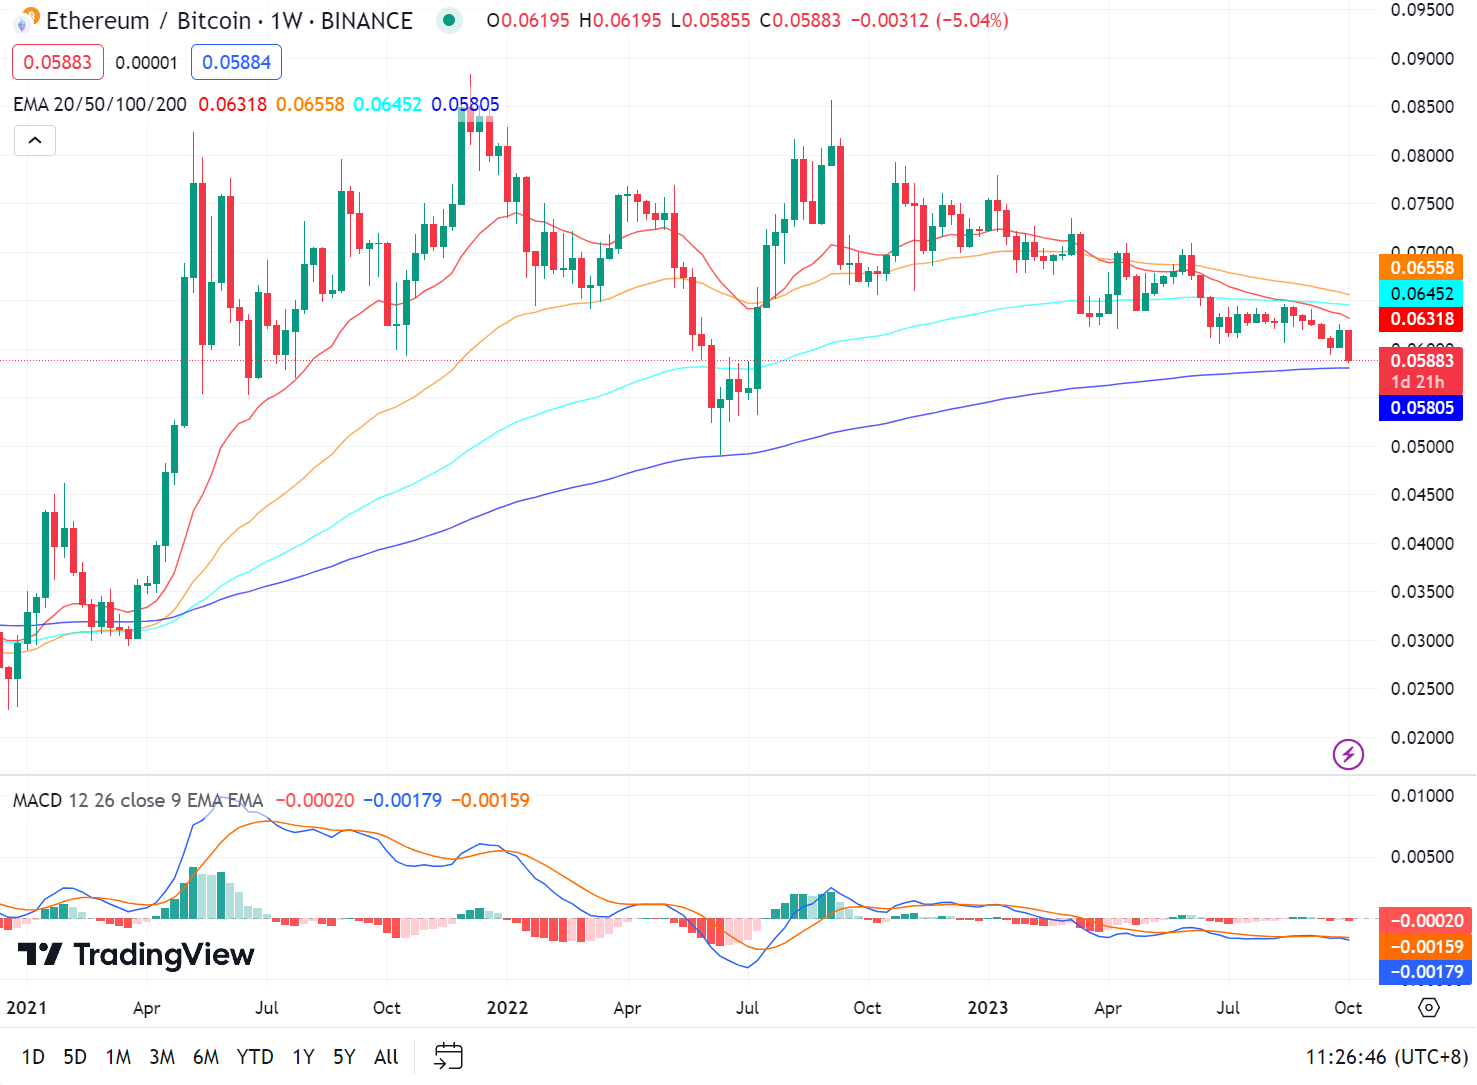
Source: tradingview
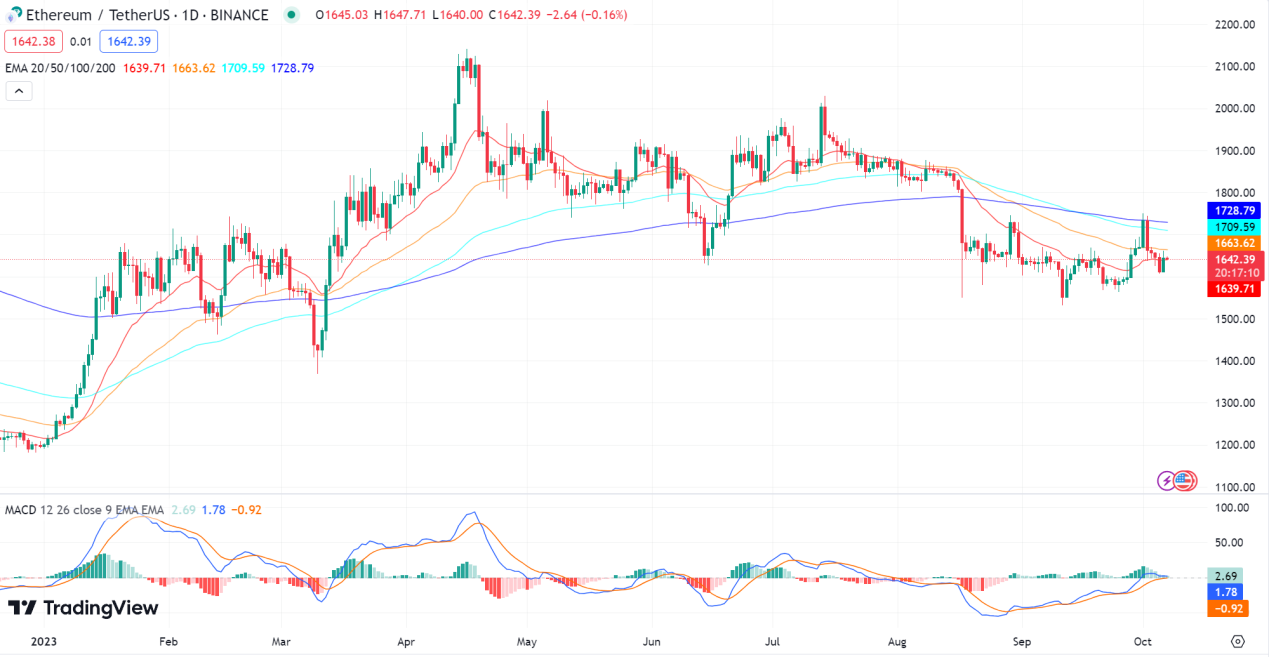
Technical indicators
Looking at the daily line, ETH is below EMA 200 after falling on August 18, and MACD is just close to the zero axis. Compared with BTC, BTC stood above EMA 200 on October 1, and MACD also broke through the zero axis and entered the water area.
2. Influencing factors
The factors that influence the strength of ETH are very complex. At the macro level, it includes changes in the Federal Reserve’s interest rate hike policy and changes in the SEC’s regulatory attitude. At the micro level, it includes the development of the ETH ecosystem, the rise of the second layer, token consumption and supply, enthusiasm for market capital participation, etc. Only factors that have changed significantly in recent times will be analyzed.
Gas consumption is significantly reduced, and ETH returns to inflation
In August and September 2023, on-chain transactions will enter a period of cooling off. On the one hand, there are no new hot projects on the chain, and transactions have decreased; on the other hand, several large potential airdrop projects have seen a large number of hackers stealing coins, project rugs, etc., and the enthusiasm for interaction has decreased.
The gas on the eth chain is basically maintained below 10 gwei. The reduction of on-chain activities and the reduction of gas fees have caused the supply of eth to exceed consumption in the past 30 days, restoring inflation. The inflation rate is 0.275%, and 27,000 ETH have been added in the past 30 days.
However, overall, after the merge, ETH is still in a state of deflation. Since the merge, the inflation rate has been -0.217%, with a total reduction of 277,000 ETH.
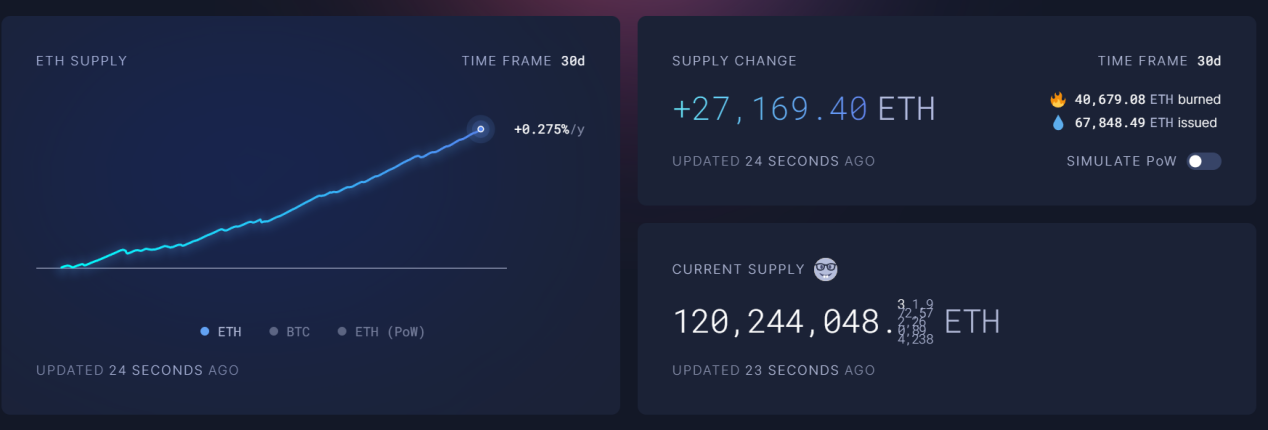
source:ultrasound.money
Staking slows down, queues for staked tokens dwindle
Currently, there are 844,000 active staking nodes in Ethereum, staking approximately 27 million ETH, and the staking rate has reached 25.33%.
Overall, the current number of new pledges is significantly lower than in the second quarter of 2023.
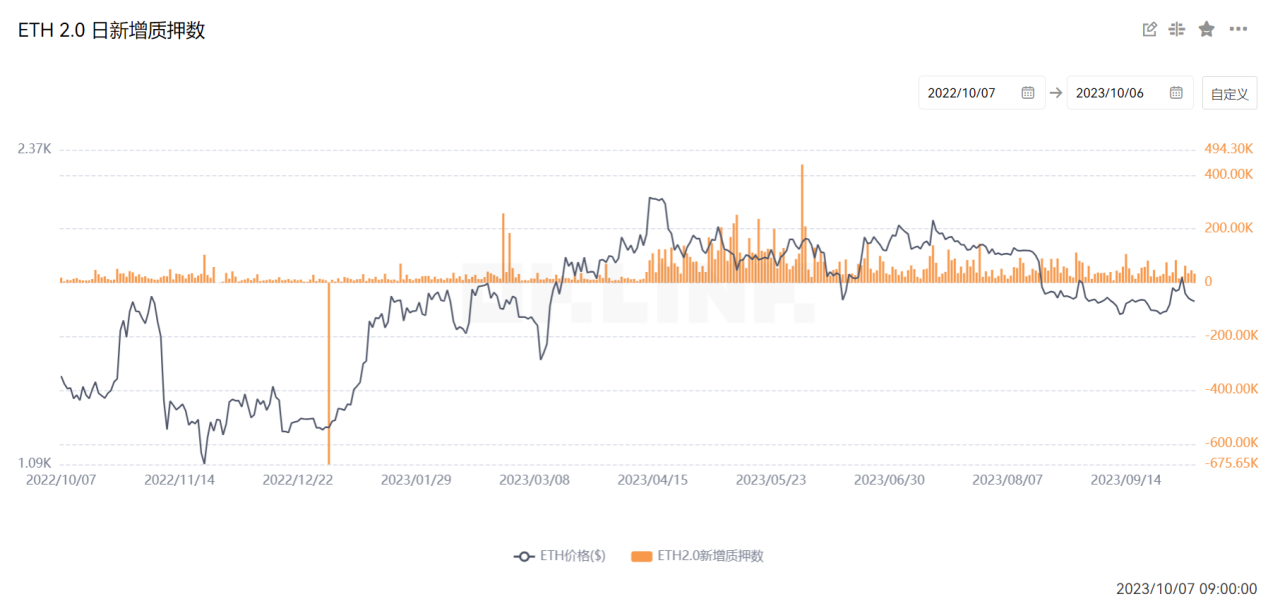
source:OKlink
Currently, there are 5,723 nodes waiting to participate in staking, and Ethereum can add up to 2,700 new staking nodes every day. Therefore, if there are no new tokens, it only takes 2 to 3 days to complete the process. . This is the time period with the smallest number of nodes waiting to participate in staking since the Shanghai upgrade.
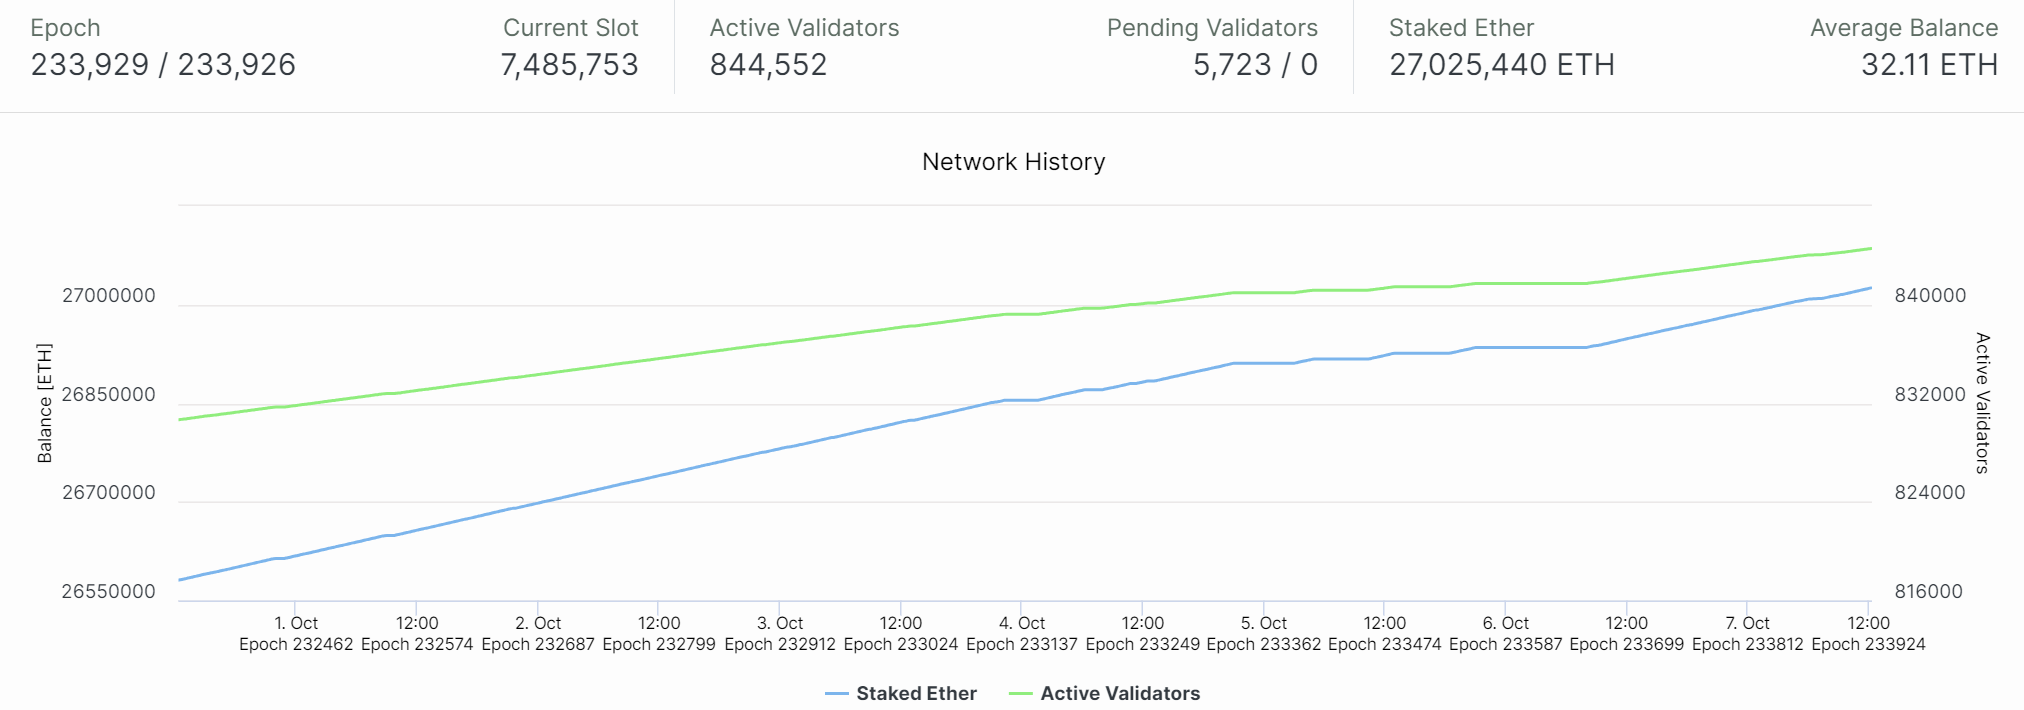
source:beaconcha.in
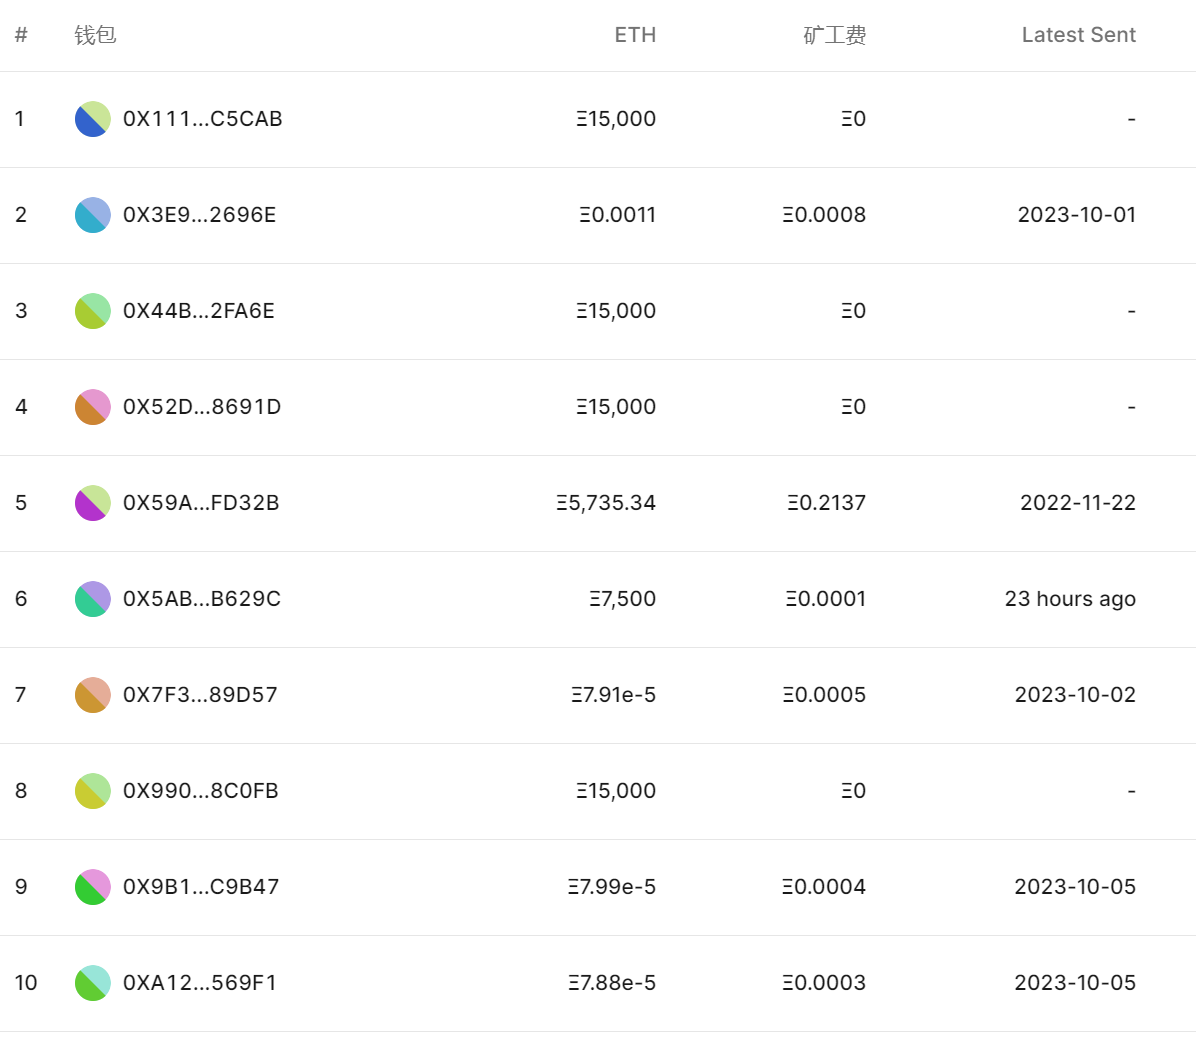
The founder has continued to sell ETH in the past two months
Addresses related to founder Vitalik continue to transfer ETH to exchanges. On October 7, it transferred 1,000 ETH (approximately $1.64 million) to Bitstamp again. In the past two months, this address has deposited a total of 4,400 ETH (approximately $7.23 million) to Bitstamp.
In terms of volume and amount, this is not enough to affect the price of ETH. However, from an emotional point of view, it will affect investors confidence.
FTX hacker sells ETH, causing short-term selling pressure
The main event that has affected ETH in the past seven days is that FTX hackers started selling ETH and buying BTC on October 1.
In November 2022, shortly after FTX filed for bankruptcy, hundreds of millions of dollars began flowing out of exchange balances and into hacker addresses. On November 21, 2022, hackers dispersed and stored 185,000 ETH ($308 million) in 13 addresses and then went into hibernation. After being dormant for 10 months, the hackers began transferring and selling the ETH held in these addresses on September 30.
From September 30th to 6th, 75,000 ETH ($120 million) were transferred from 5 addresses. Among them, 71,000 were exchanged for BTC through THOR Chain cross-chain. 2700 ETH is converted into 165 tBTC and then bridged back to the Bitcoin network through Threshold Network. 1500 ETH transferred via privacy network RAILGUN_Project. This also led to THOR Chain announcing that it would temporarily enter maintenance status on the afternoon of October 6.
The hacker currently holds 110,000 ETH ($176 million) in 8 addresses on the Ethereum network. Five addresses have been cleared out of the original 13 addresses.
source:mest.io
Contract data
Focusing mainly on changes in positions, ETH positions are in a state of decline as a whole. When it rose to 1,600 dollars in January 2023, the holdings were at the highest level of the year, about 2.37 million coins. When it rose to around 2,000 dollars in April, it held 1.22 million coins, the second highest point of the year. Before the decline on August 18, the position was 890,000. The current holdings are 730,000 coins.
Compared with the high point at the beginning of the year, the position has fallen by 45%; compared with the second highest point of the year, the position has fallen by 37%; compared with the position before the decline on August 18, the position has fallen by 17%.
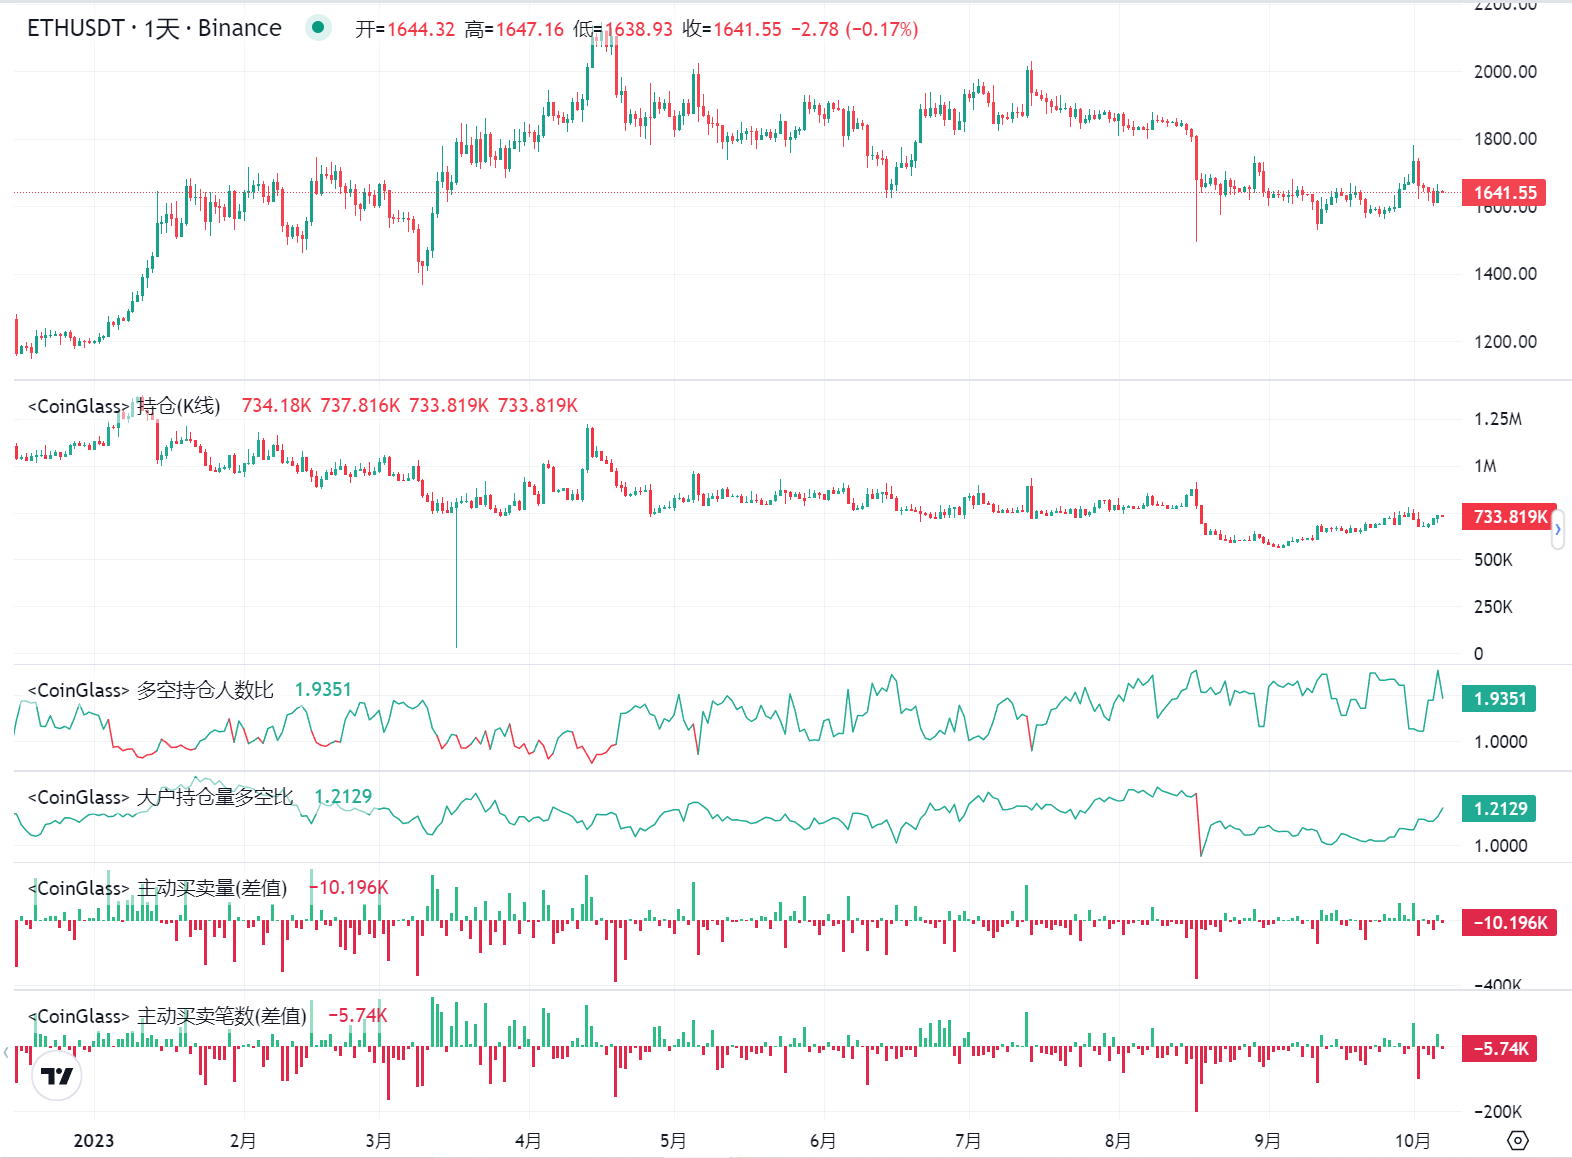
source:coinglass
3. Summary
In the long term, compared with the last round of bear market, due to the development of the ecosystem, the exchange rate of ETH compared to BTC is generally on the rise, rising from 0.01 to more than 0.05. But looking at the past year, ETH is in a weaker position than BTC, and the exchange rate is in a downward trend.
Fundamentally, since the merge, ETH has been in a deflationary state, with an inflation rate of -0.217%. However, in the past two months, on-chain transactions have been deserted, gas income has dropped significantly, and ETH has entered a state of inflation, with the annualized inflation rate in the past 30 days being 0.275%.
In terms of pledge data, ETH pledges have continued to rise since Shanghai’s upgrade, with the current pledge rate at 25.33%. However, new pledge data has slowed down recently. The number of new pledges has been significantly lower than the data in the second quarter of this year; and the number of nodes queuing up to participate in pledges has also been smaller recently, which is the lowest since Shanghais upgrade.
In terms of selling pressure, the founder continues to sell ETH. Although the amount is not large, it has a negative impact on the confidence in holding the token. In addition, due to the influence of FTX hackers selling ETH and buying BTC, it is facing greater short-term selling pressure.
According to contract data, ETH contract positions are in a downward trend this year. Compared with the high point at the beginning of the year, ETH contract holdings fell by 45%; compared with the second highest point of the year, the holdings fell by 37%; compared with the holdings before the decline on August 18, the holdings fell by 17%.
Note: The data in this article are as of October 7, 2023.


