Data Interpretation Blur Trading War: What changes will the continuous airdrop plan bring to the NFT market?
In the early morning of February 15th, the NFT trading platform Blur conducted the first round of airdrops, airdropping a total of 360 million tokens to over 120,000 addresses, with over 120,000 addresses. Calculated based on the price on the day of listing, 5,835 addresses obtained more than 10,000 coins, with a profit of more than 6,500 US dollars, and 23 addresses obtained 1 million coins, with a profit of approximately 650,000 US dollars.
At present, the second round of airdrops has started. Although the incentive details have not yet been announced, before April 1, all bidding (Bidding) and listing (Listing) behaviors will receive double points. Stimulated by the first round of "creating wealth myths", many people turned their attention to "scrubbing points", which brought long-lost vitality to the NFT market, and the transaction volume continued to rise.
What changes will Blur's continuous airdrop plan and the Bidding and Points mechanism behind it bring to the NFT market? PANews data column PAData will combine the recent NFT transaction market data and Blur's transaction data to focus on the following issues:
At the macro level, did the Blur airdrop stimulate "consumer surplus" for the entire NFT trading market, or did it seize the "cake" of other trading markets?
At the micro-transaction level, the closer to the floor price Bidding can get, the higher the Points will be. Will this push NFT prices down? What is the difference between the bidding depth of different projects?
How do high-scoring users accumulate points through Bidding and Listing behaviors: What items do they mainly bid for? What is a bidding strategy? What is the current estimated revenue situation?
Data analysis revealed:
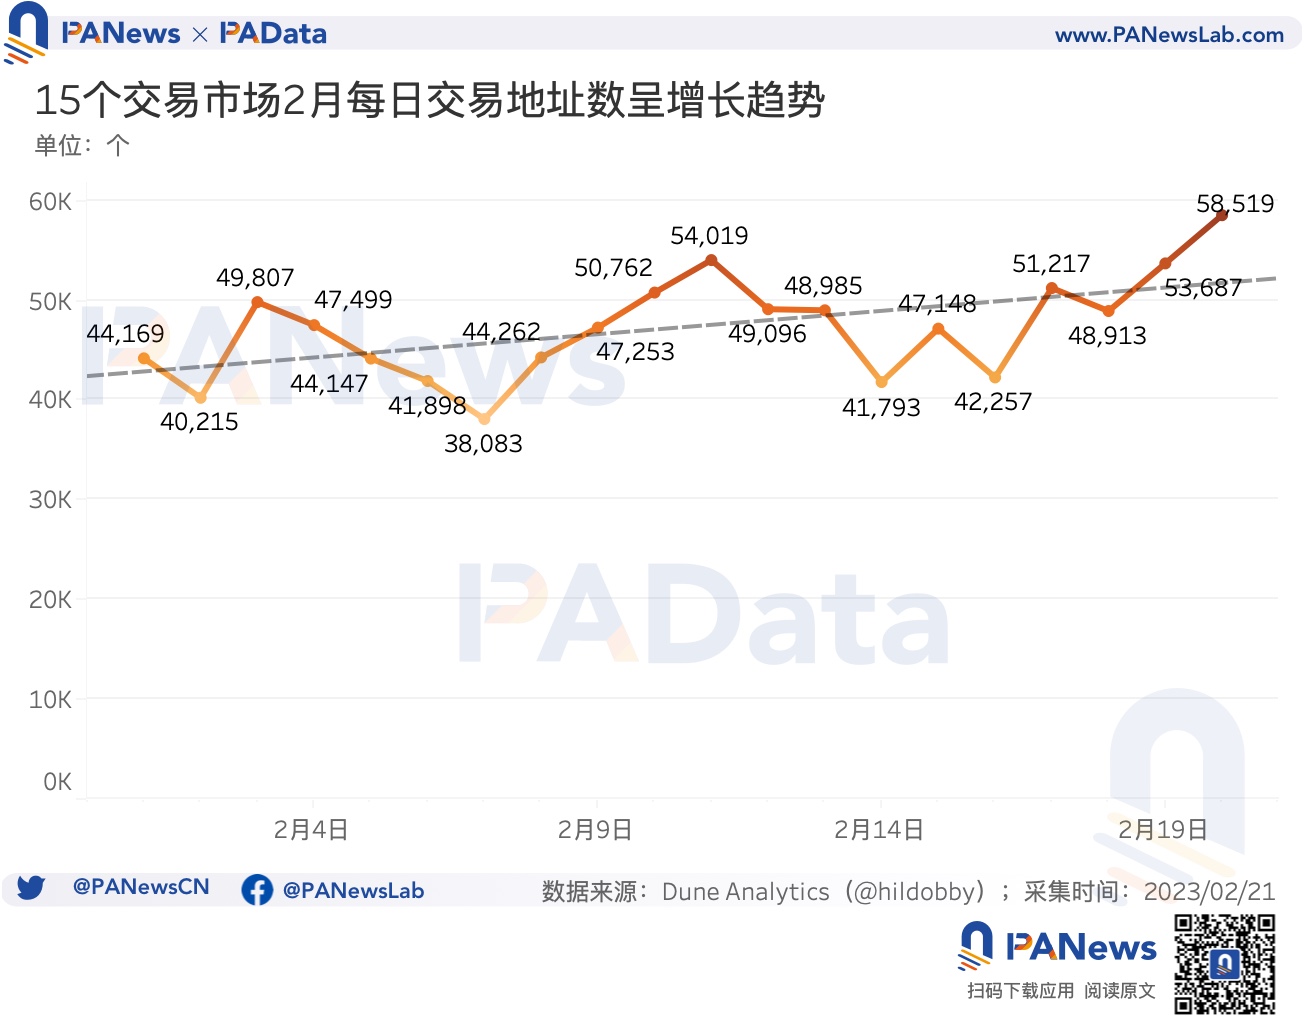
Blur spurs new transaction demand. The daily trading volume of the 15 trading markets in the last week (02/13-02/20) increased by 229.05%, and the number of daily trading addresses increased by about 19.46%. Blur’s daily transaction volume increased by 467%, and the number of daily transaction addresses increased by 46%.
In the recent market increment process, Blur has squeezed other multi-part trading markets, especially in terms of transaction volume, and has less pressure in terms of user scale. This also shows to a certain extent that Blur has attracted more "high net worth" users in this growth.
The bidding depth of the 10 leading projects is the best within the range of the floor price and 1% above the floor price, and the best bidding depth of the 6 popular projects is within the range of 5% below the floor price.
The Points rule works as expected, bringing the bid price closer to the floor price. According to statistics, for the 100 projects with the highest transaction volume in the last 7 days on Blur, the average deviation of the highest bid from the floor price is about 0.72%. This eventually makes the floor price has a downward momentum.
For the top 100 projects by trading volume, the floor price on Blur is 4.97% lower than the average on Opensea, and the 7-day trading volume on Blur is 0.59% higher than the average on Opensea. However, there is no volume-price relationship at the cross-market level, that is, the higher trading volume on Blur has nothing to do with the floor price, and the lower floor price is mainly affected by the Bidding-Points mechanism.
For top projects, the floor prices on Blur are all lower than Opensea, especially BoredApeYachtClub and Doodles, which are 9.98% and 6.51% lower respectively, which also explains why the bidding depth of these two projects is concentrated above the floor price5 % In the range.
17 projects were bid by 3 or more high-scoring users, among which, PudgyPenguins, Moonbirds, CloneX and BoredApeKennelClub were bid by 8 high-scoring users.
The total number of effective bids (Open) by 10 high-scoring users is about 62,700 times, the average bid deviation from the floor price is about -16.32%, and the average bid execution rate is about 92.87%. Its Bidding mode can be roughly divided into three categories.
The total value of the NFT currently held by the 10 high-scoring users is lower than the cost after the floor price estimate, that is, they are currently in a state of estimated loss. The average estimated loss is 90 ETH, which equates to $144,900.
first level title
Blur Spurs Demand for New Deals, 12 of 15 Marketplaces See Volume Growth
Before and after the airdrop, the more users trade NFTs on Blur, the more tokens they get. So, is this airdrop only stimulating for Blur or for the entire NFT trading market? In other words, does Blur's airdrop stimulate new transaction demand, stimulate "consumer surplus", or redistribute the "cake"?
PAData has counted the transactions of 15 trading markets including Blur, OpenSea, LooksRare, Gem, Alpha Sharks, X2Y2, Reservoir, CryptoPunks, Sudoswap, Foundation, Element, OKX, Uniswap, Rarible, and BitKeep since this month. Judging from the data results , the number of trading addresses in multiple trading markets has increased significantly, and Blur has stimulated new trading needs, making the "cake" bigger to a certain extent.
From the perspective of trading volume (healthy trading volume after going to WashTrading), the daily trading volume of the 15 trading markets in the latest week (02/13-02/20) increased from 21,000 ETH to 69,200 ETH, a weekly increase of 229.05%. Zooming in on the time period, the overall daily trading volume rose by 284.97% this month, showing a significant growth trend, with the highest value exceeding 72,100 ETH at one point.
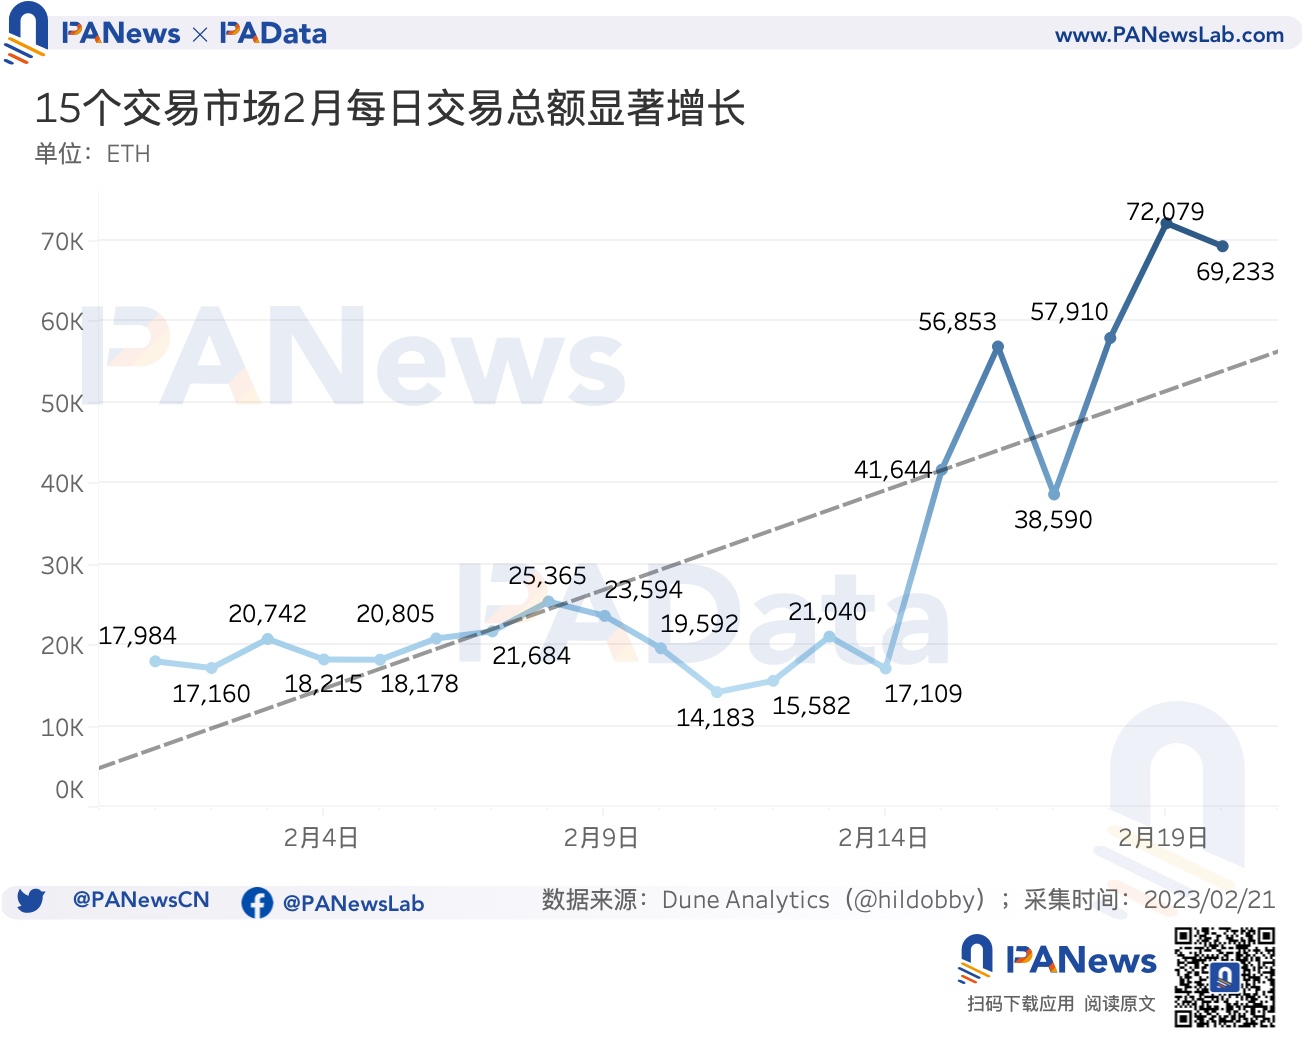
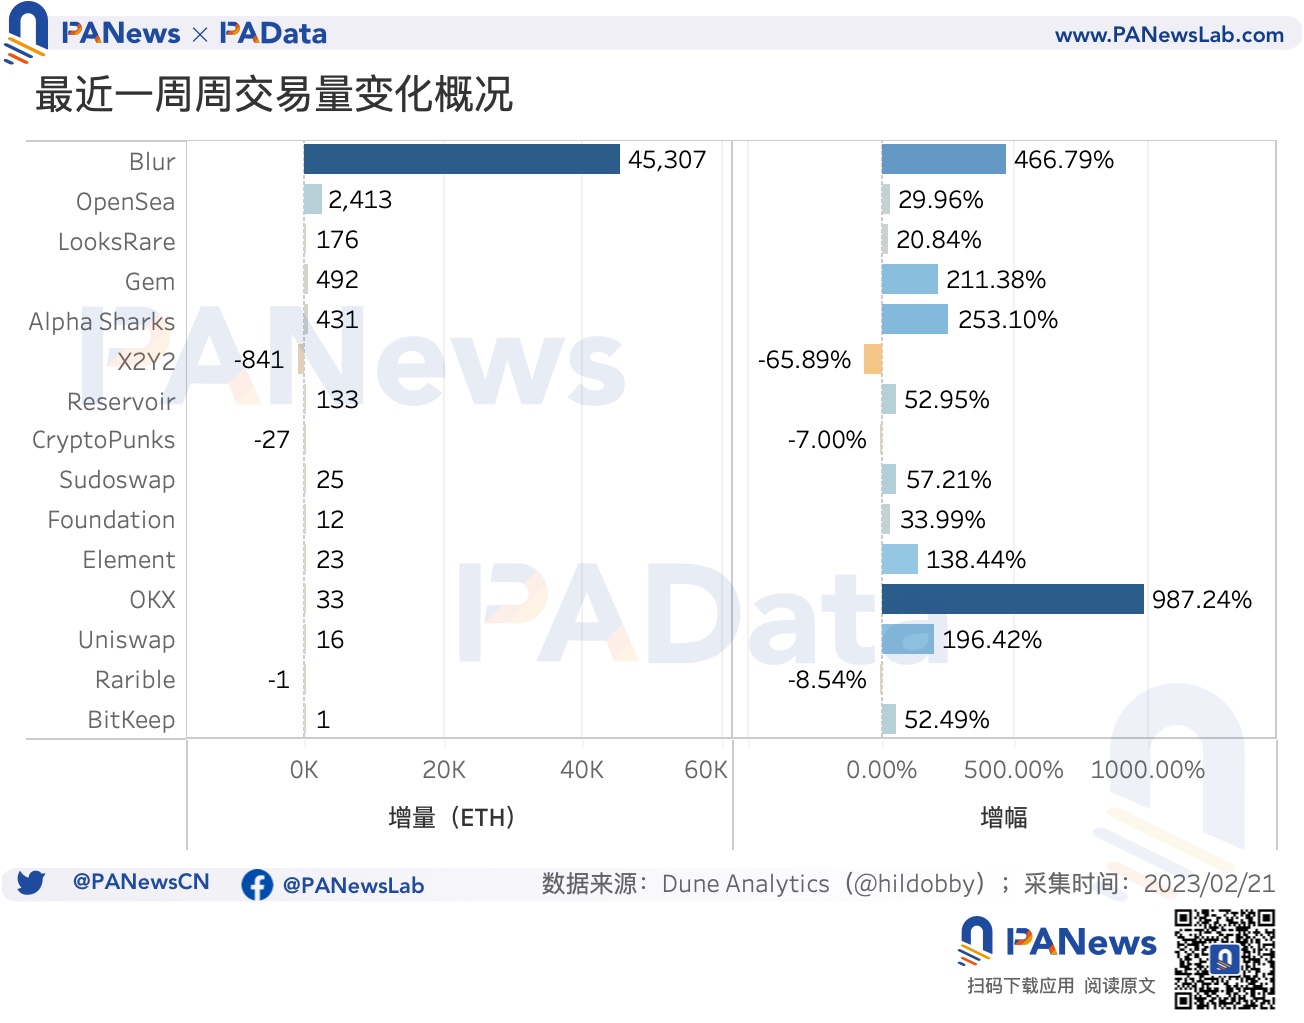
The increase in overall transaction volume wasn't entirely driven by Blur. From the perspective of various trading markets, among the 15 trading markets within the statistical range, 12 markets have seen an increase in trading volume in the latest week. Among them, in the last week, Blur’s daily trading volume increased by 45,300 ETH, an increase of 467%. Secondly, Opensea’s daily transaction volume also increased by 2413 ETH, an increase of 30%. In addition, there are Gem and AlphaSharks with a slightly larger trading volume. The daily trading volume has increased by 492 ETH and 431 ETH respectively, which is about 211% and 253% respectively.
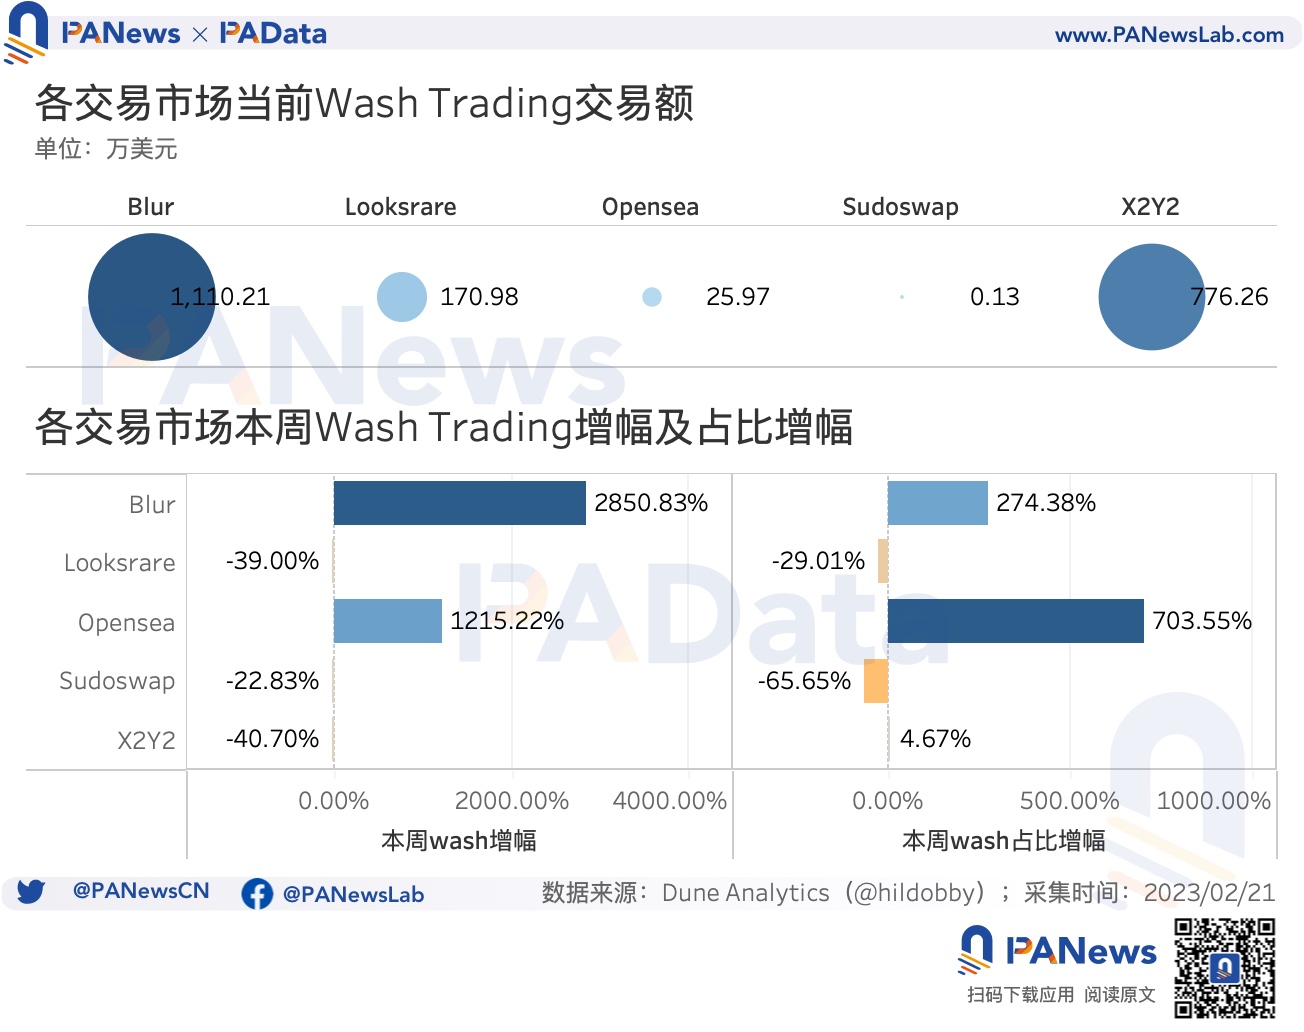
However, it should be pointed out that the trading volume of each trading market is not all healthy. In the recent increment, the unhealthy trading volume (WashTrading) has also increased. Especially for Blur, the unhealthy trading volume has surged by 2851% in the last week, and the proportion of unhealthy trading volume has increased by 274%. The current unhealthy trading volume is the highest among the five observed markets, at about 11.1 million US dollars. However, what is interesting is that the unhealthy transaction volume of the largest competitor Opensea also increased significantly in the last week, reaching 1215%, and the proportion of unhealthy transaction volume increased by 704%.
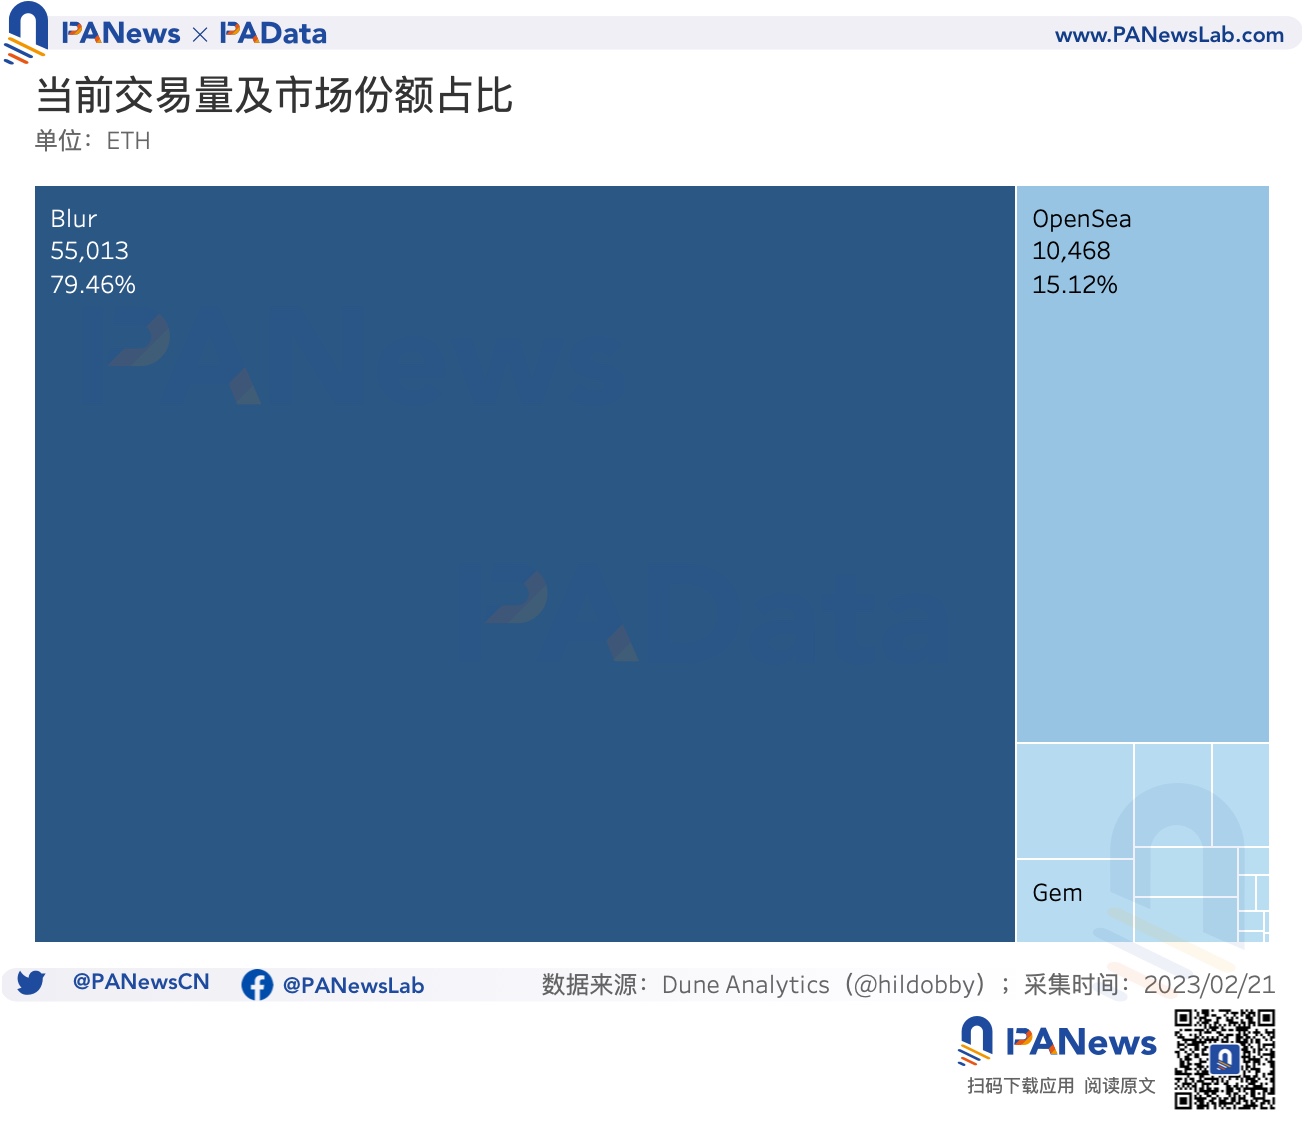
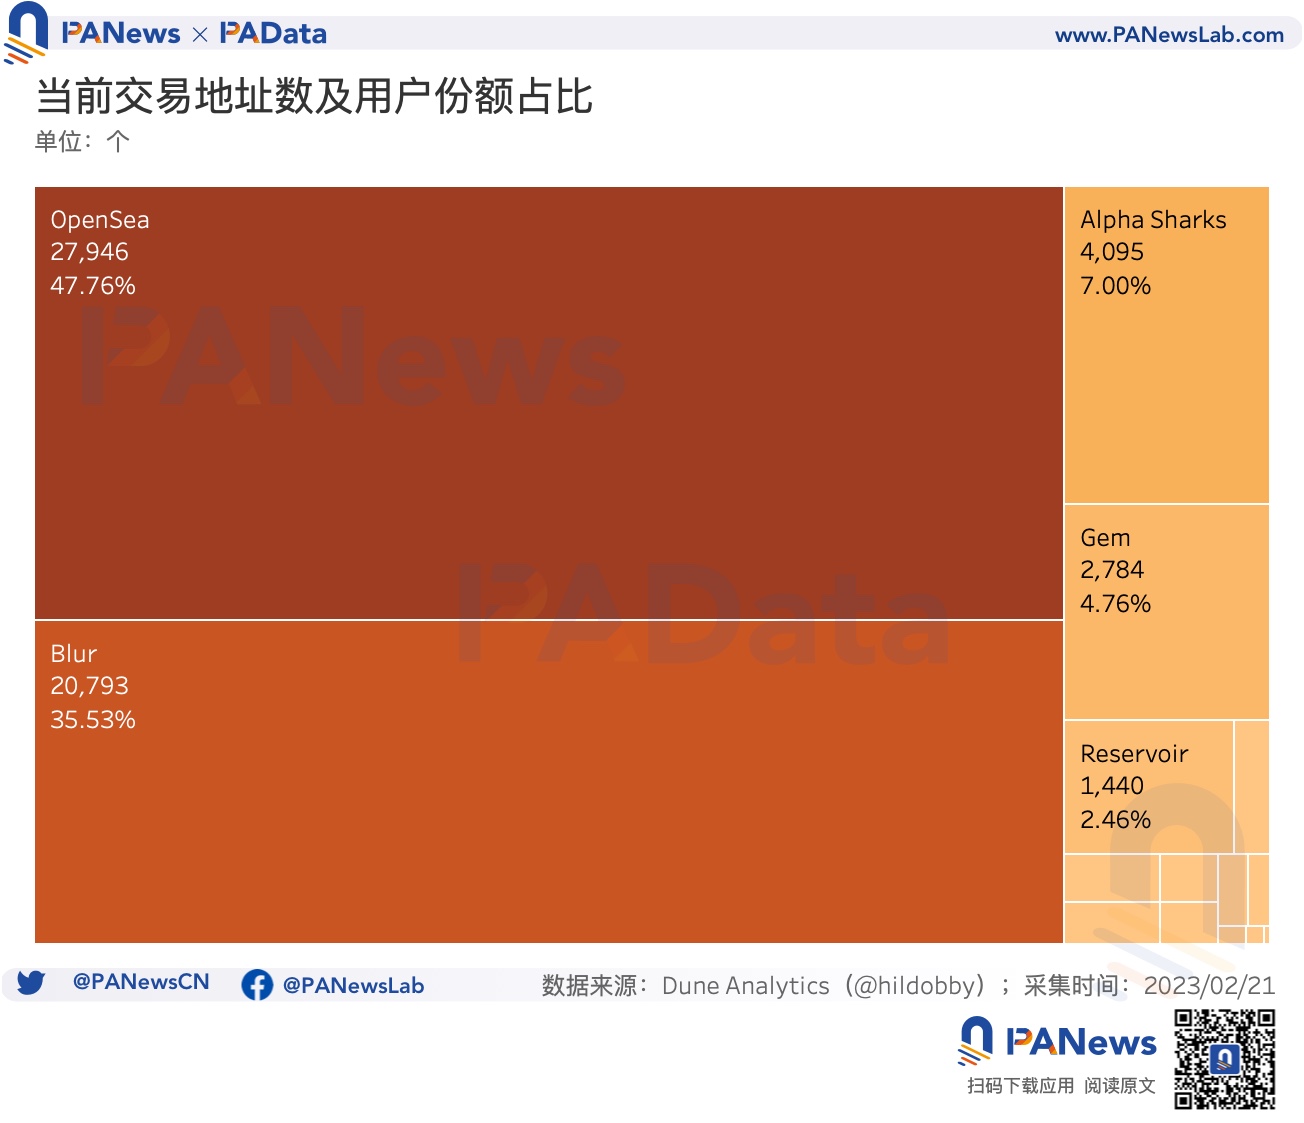
Currently (02/20), Blur's daily trading volume is about 55,100 ETH, accounting for 79.46% of the total trading volume of the 15 trading markets, and it is an absolute dominant position. Opensea’s daily transaction volume was 10,500 ETH, accounting for 15.21% of the total transaction volume. From the perspective of transaction share, the combined market share of the two reached 94.56%, leaving little room for other transaction markets to survive. Among the remaining trading markets, only LooksRare and Gem accounted for more than 1% of the trading volume.
From the perspective of changes in the market share of transaction volume, in the last week, only OKX with a small base and Blur, the leading market for this growth, have increased, with an increase of 230% and 72% respectively. In addition to the 13 trading markets, their trading volume market share has all declined, and the largest decline is X2Y2, reaching 89%. Also down more than 50% are Sudoswap, Reservoir, Foundation, Opensea, LooksRare, CryptoPunks and Rarible.
It can be said that although Blur has stimulated the growth of the transaction volume of the entire market, due to its dominant force being too significant, it has squeezed other parts of the transaction market during this incremental process.
The change of transaction address is also similar. The number of daily trading addresses in the 15 trading markets in the latest week (02/13-02/20) increased from 49,000 to 58,500, a weekly increase of about 19.46%. If the time period is extended to this month, the increase will expand to 32.49%. Overall, the increase in transaction addresses is far less than the increase in transaction volume. This may mean that the recent prosperity of the NFT market is driven by a small number of incremental addresses.
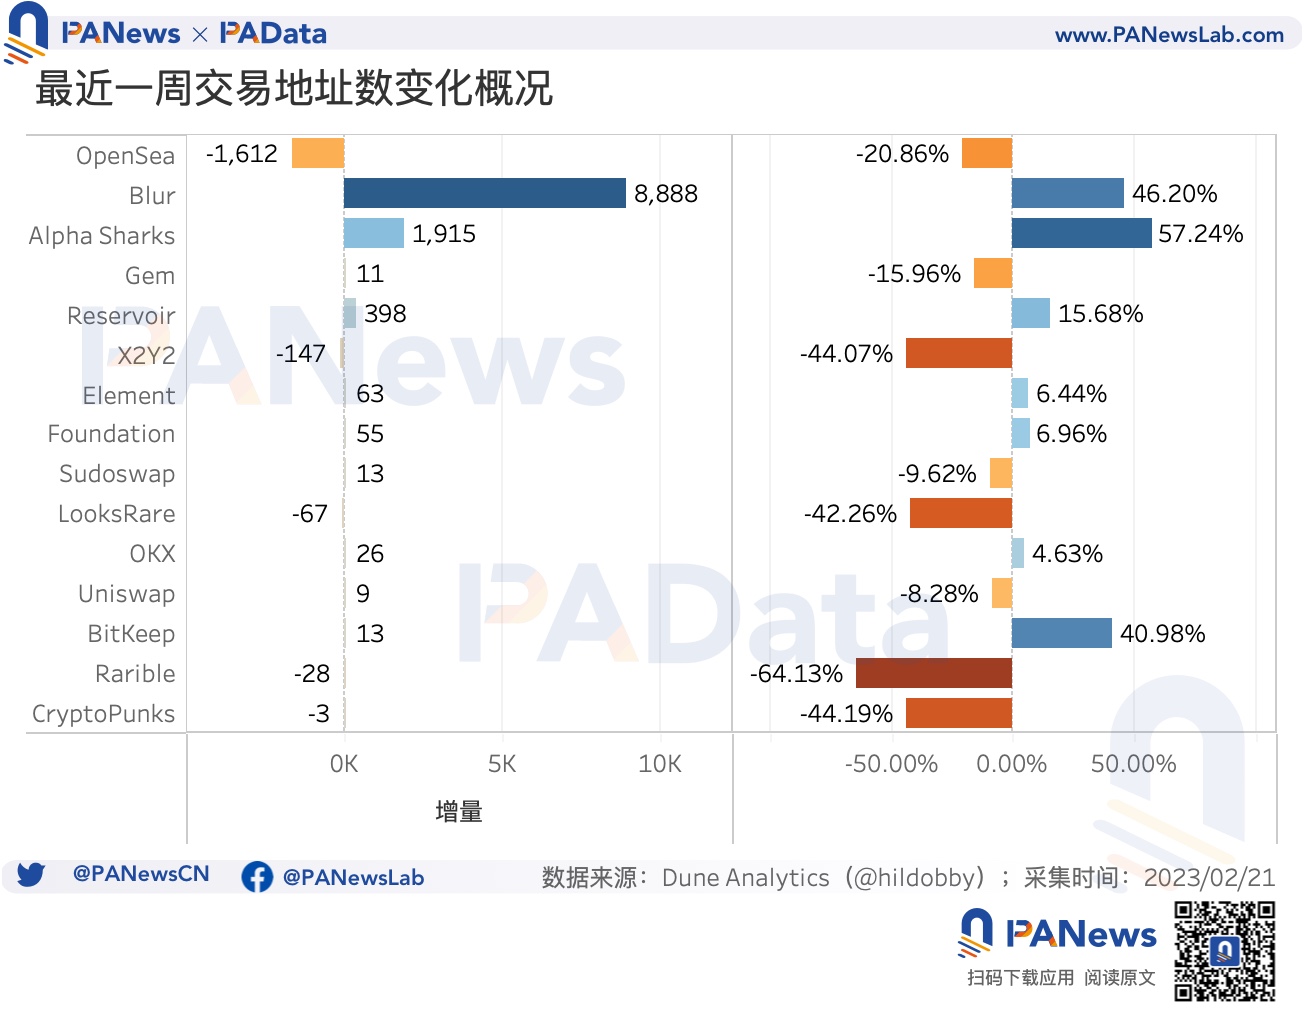
However, unlike the increase in trading volume in most trading markets, only seven trading markets saw an increase in the number of trading addresses in the last week, accounting for about half of the observed range. Among them, the number of Blur's transaction addresses increased by 8888, an increase of 46%, and the growth was more obvious. AlphaSharks, which has a larger increase in other transaction addresses, has increased by 1915, an increase of about 57%. On the contrary, Opensea saw the largest drop in trading addresses, with a drop of 1,612 in the latest week, or about 21%.
Currently (02/20), Blur has about 20,800 daily trading addresses, accounting for 35.53% of the total number of trading addresses in the 15 trading markets, ranking second. The largest number of users is still Opensea, with a daily transaction address of 27,900 ETH, accounting for 47.76% of the total number of transaction addresses. If the number of transaction addresses is understood as the number of users, then from the perspective of user share, the combined share of the two reaches 83.29%. In the remaining trading markets, only Gem and Alpha Sharks have a user share of more than 5%, and most of the others are less than 0.5%.
Judging from the changes in the share of users, in the last week, the rise and fall of the 15 trading markets were basically split in half. Alpha Sharks, Blur, BitKeep, Reservoir, Foundation, Element, and OKX all saw growth, with Blur’s user share up 46%. Uniswap, Sudoswap, Gem, OpenSea, LooksRare, X2Y2, CryptoPunks, and Rarible declined, with Opensea’s user share falling by 21%.
first level title
Bids on Blur deviate from the floor price by 0.72% on average. The bids for top projects are mostly higher than the floor price, and the opposite is true for popular projects
In the past, large trading markets such as OpenSea, LooksRare, X2Y2 and other trading markets mainly adopted a model similar to an order book, which made poor liquidity the core pain point hindering the development of NFT. Now, Blur has innovatively introduced the Bidding mechanism, making the transaction mode similar to AMM in DeFi. Since the transaction object of this mechanism is aggregated from a single NFT to a collection of NFTs, and encourages bids close to the floor price, this blurs the particularity of NFTs in the transaction process, and both buyers and sellers need to bear price risks. One of the functions of BLUR is to bridge risks. And to encourage the provision of liquidity.
So, what is the current status of this Bidding mechanism? What are the actual impacts of this mechanism on prices at the micro transactional level?
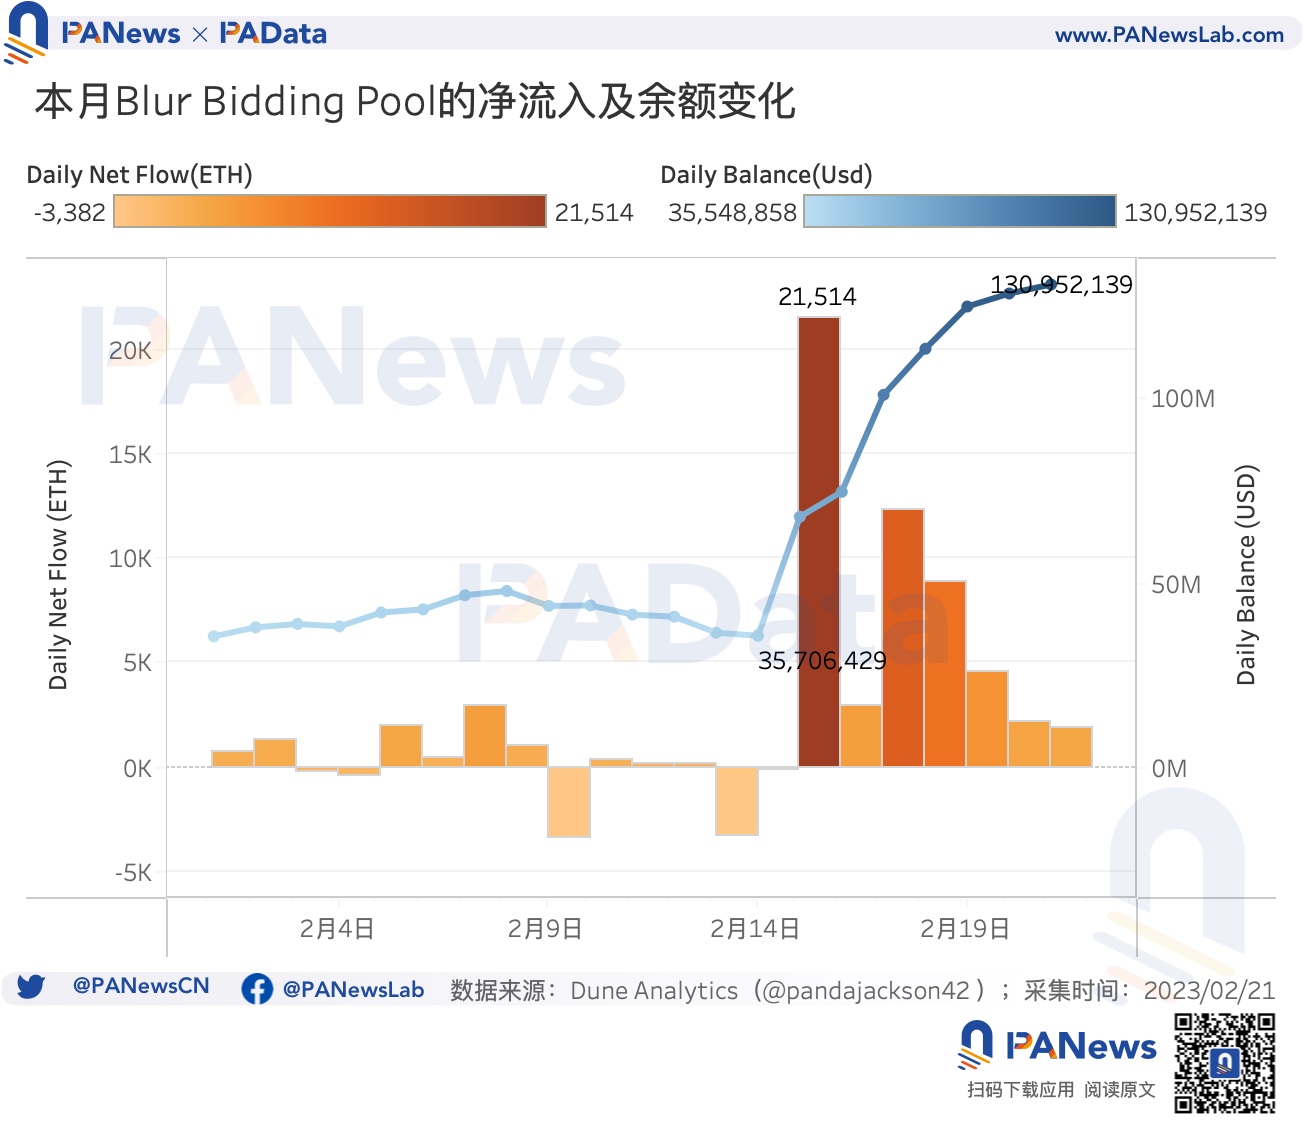
Currently (02/20), Blur’s BiddingPool balance has reached $131 million, a sharp increase of 258.53% from $36.5246 million a week ago (02/13). From the perspective of inflow, the recent growth mainly started on February 15, when the net inflow reached 21,500 ETH. Although the net inflow dropped immediately thereafter, the average daily net inflow as of the 20th still reached about 5,450 ETH, much higher than the daily average of 117 ETH before this month.
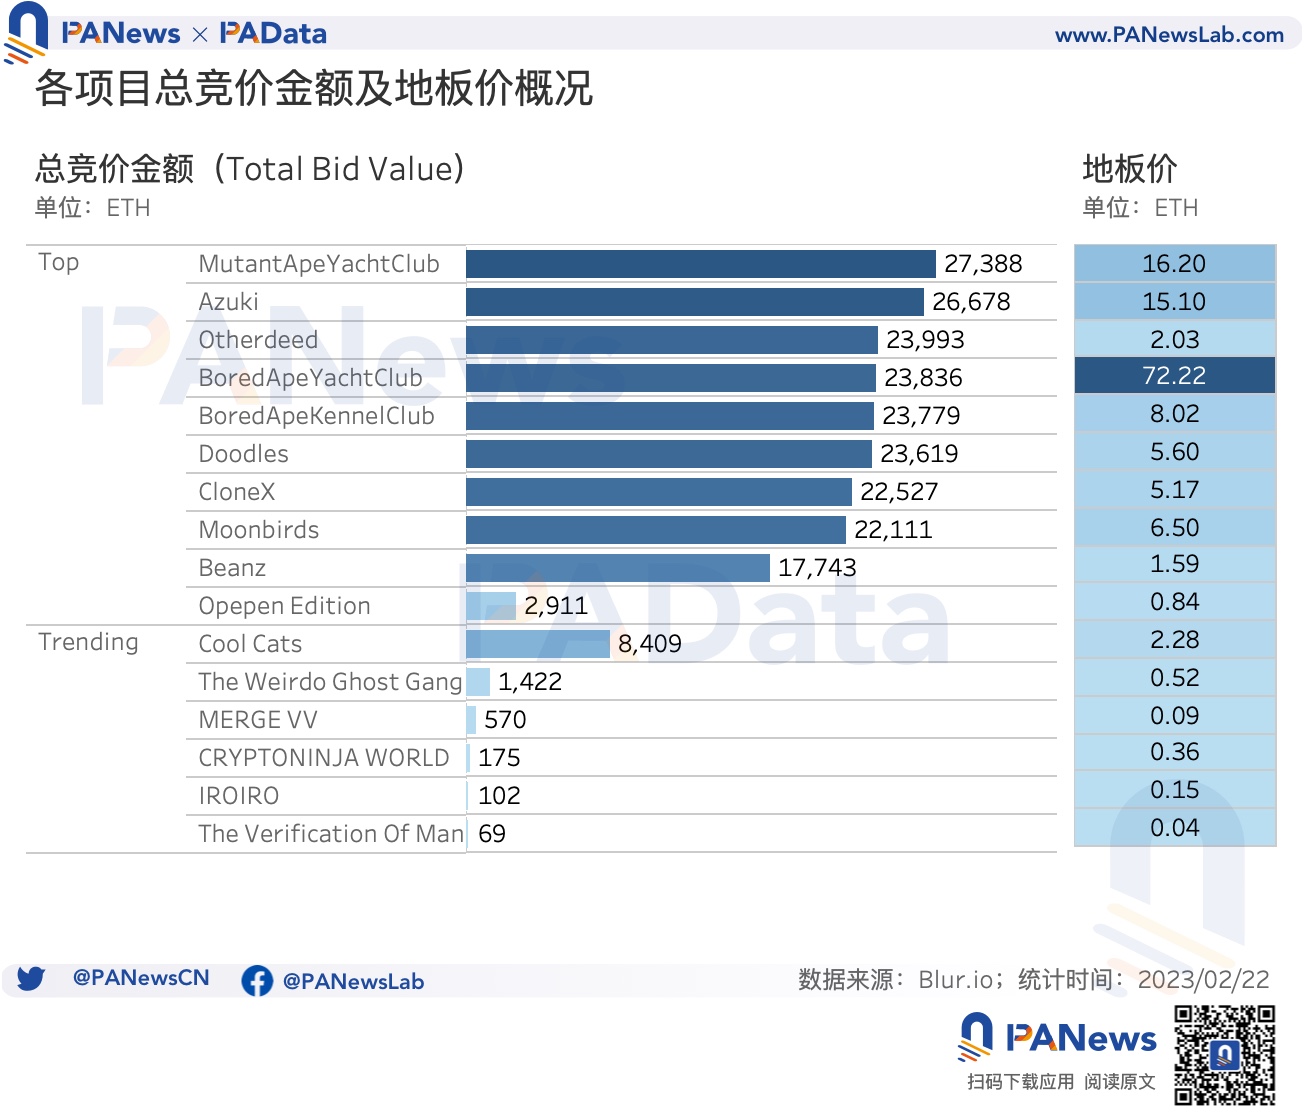
In order to observe the impact of the Bidding mechanism on different types of NFTs, PAData selected the 10 projects with the highest trading volume in the last 7 days on Blur (hereinafter referred to as top projects) and the 10 projects with the highest trading volume in the last 1 hour (remove and head For items with repeated items, 6 items are reserved at the end, hereinafter referred to as popular items) for observation.
Judging from the BiddingPool (bidding pool), the balance of the top project bidding pool is mostly above 22,000 ETH, while the balance of the bidding pool of popular projects is mostly below 1,500 ETH. This has a certain relationship with the floor price of the project. The floor price of the top project is more than 2 ETH, the highest BAYC is more than 70 ETH, while the floor price of popular projects is less than 0.5 ETH, and the highest CoolCats is not more than 2.5 ETH , the lowest The Verification Of Man is only 0.04 ETH.
According to the official scoring rules, “the closer you bid to the floor price, the more points you will get for top collections.” From this, it can be deduced that the transaction depth on Blur should be concentrated around the floor price. If it is concentrated on the left side, it is possible to push the floor price down, and it is likely that the purpose of bidding is not for the transaction, but to gain points; if it is concentrated on the right side, it is possible to push the floor price upward, and it is likely that the purpose of bidding is It's for the sale, and then earns more points by listing it again.
PAData further captures the total bids of 10 leading projects in the price range of ± 2% of the floor price, and the total bids of 6 popular projects in the price range of ± 10% of the floor price, in order to observe the bidding depth of different projects[ 1 ] Structure. In general, top projects have the best depth within the range of the floor price and 1% above the floor price, and popular projects have the best depth within the range of 5% below the floor price.
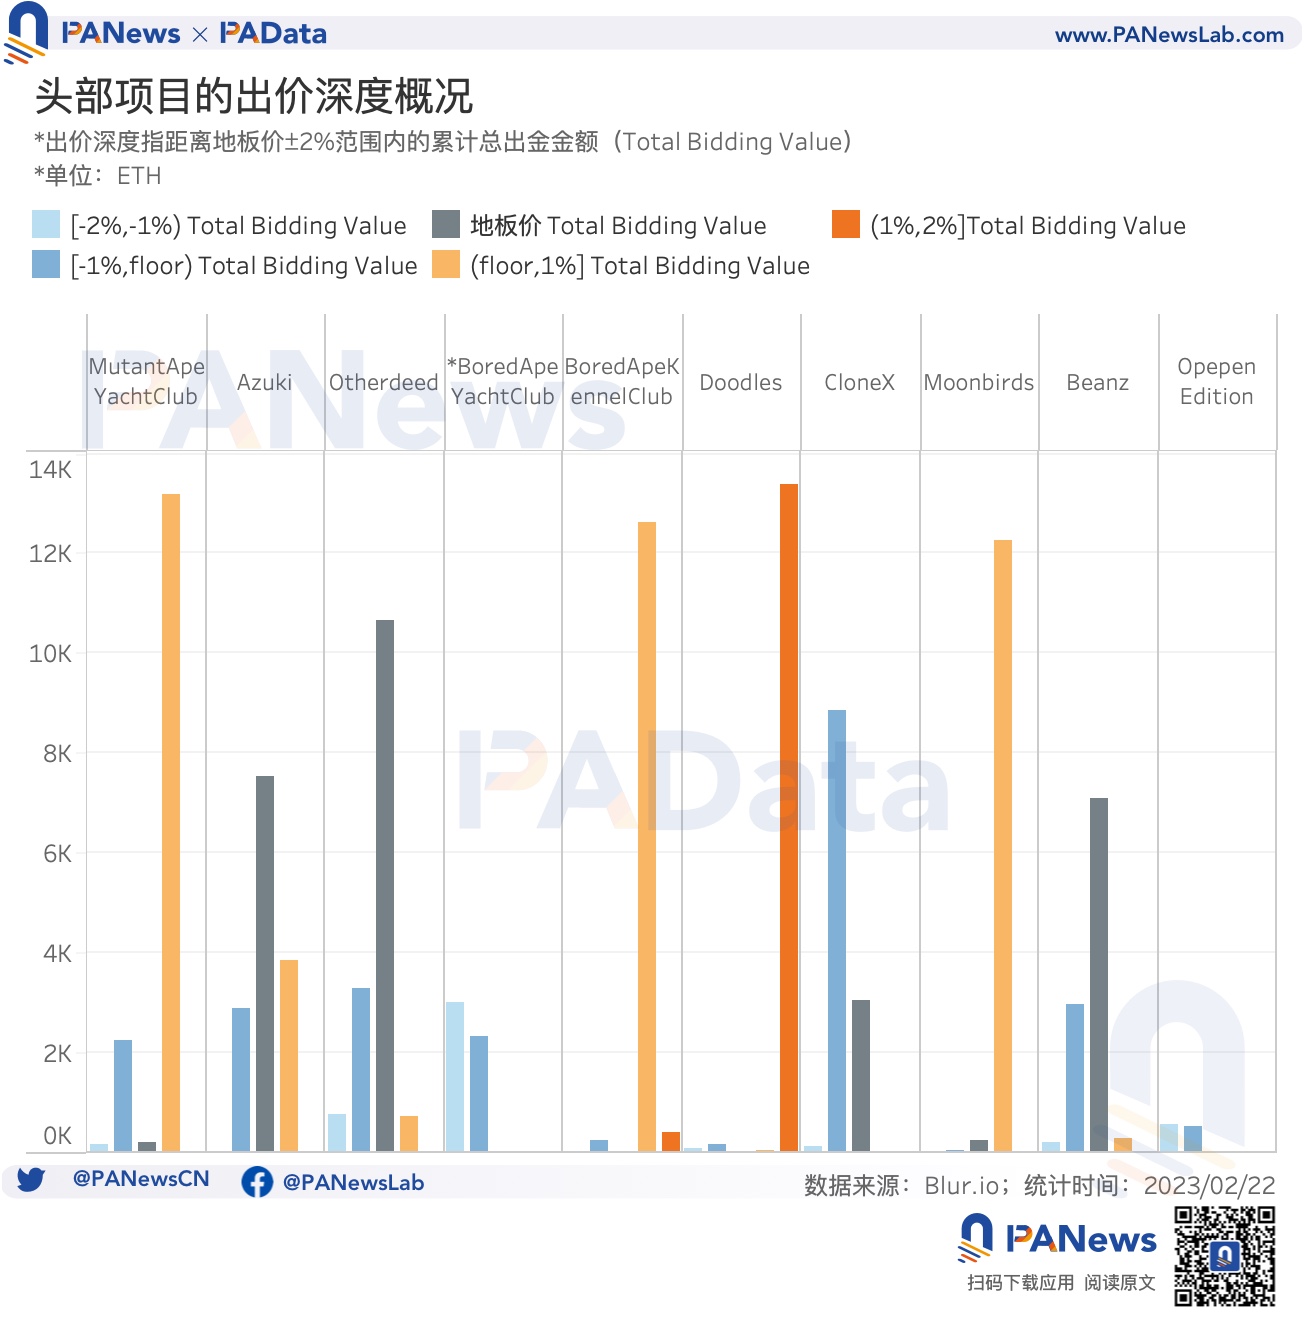
Specifically, among the 10 top projects, the structure of bidding depth is relatively diverse. The two most common structure types are that the depth of bidding is concentrated on the floor price and 1% above the floor price. The former includes the three projects of Azuki, Otherdeed and Beanz, and the latter includes the three projects of MutantApeYachtClub, BoredApeKennelClub and Moonbirds. Another type of structure that deserves attention is that the bidding depth is concentrated in the range of 2% and above the floor price, including Doodles and BoredApeYachtClub. In particular, BoredApeYachtClub still has a lot of bids above + 5%, which are not shown here, and this phenomenon does not appear in other projects within the statistical range. The distribution of the bidding depth may be related to the price difference of the same item in different trading markets, which will be analyzed later.
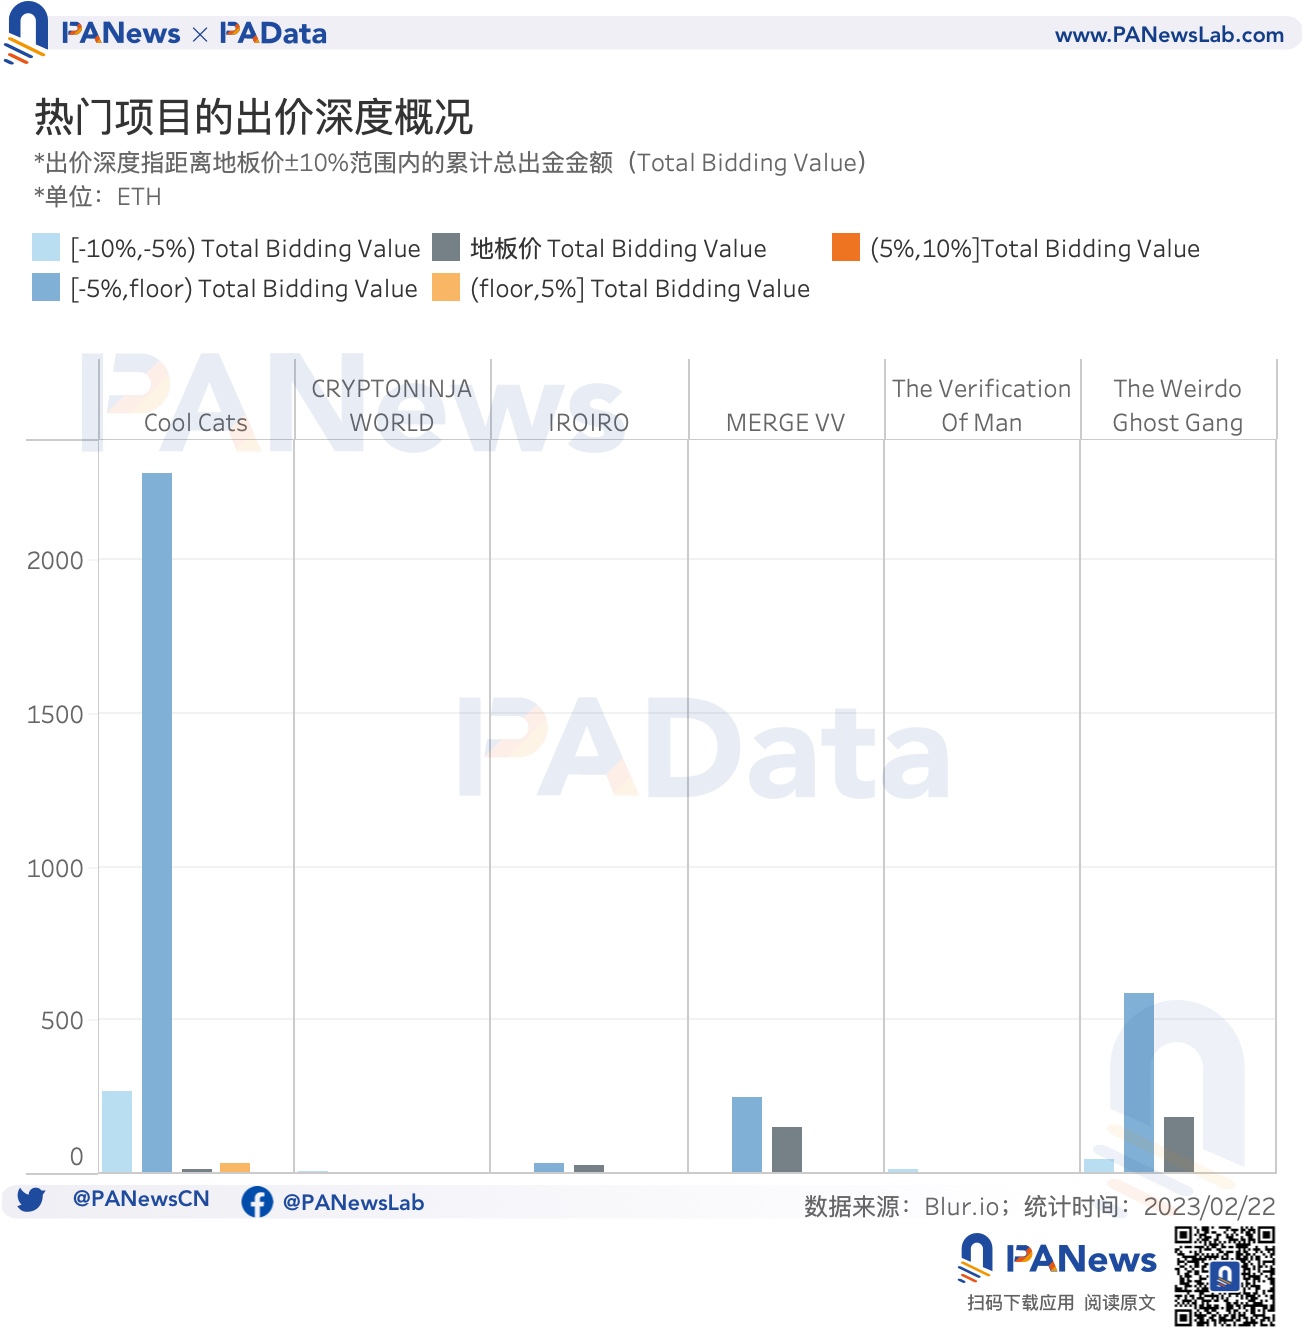
Among the 10 popular projects, the structure of the bidding depth is relatively simple, and it is just the opposite of the top projects. The bidding depth of all projects is at the floor price level, and the difference is only at the level below the floor price. Among them, the bidding depth of Cool Cats, IROIRO, MERGE VV and The Weirdo Ghost Gang is mainly concentrated in the range of 5% below the floor price, while the bidding depth of the two projects The Verification Of Man and CRYPTONINJA WORLD is mainly concentrated on the floor 10% below the price range. But CRYPTONINJA WORLD has some extreme quotations that are 114% higher than the floor price and 20% lower than the floor price. It can be seen that the price fluctuations of popular projects are relatively large, and the consensus on prices is unstable.
Overall, the Points rule has played its intended role, making the bidding price close to the floor price. According to statistics, for the 100 projects with the highest transaction volume in the last 7 days on Blur, the average deviation of the highest bid from the floor price is about 0.72%, and the deviation of the highest bid of 95% of the projects from the floor price is between -2.06% and 3.5%. Bid deviations for other short-term popular projects will be higher. In this way, the floor price has a downward momentum, such as BoredApeYachtClub, the floor price recorded on February 23 was still 69.99 ETH, but the floor price recorded on the 25th was only 66.20 ETH.
The cross-market price performance of the same project can provide a more comprehensive understanding of the impact of the bidding mechanism. PAData also compared the gap between the transaction volume and floor price of the 100 projects with the highest transaction volume in the last 7 days on Blur and the gap between the projects in Opensea, removed the unmatched projects, and retained a total of 86 projects for analysis.
Overall, the average floor price of these projects on Blur is 4.97% lower than that on Opensea, and the 7-day transaction volume on Blur is 0.59% higher than the average on Opensea. However, the statistical results show that for the same project, the difference in transaction volume between Blur and Opensea has nothing to do with the difference in floor price. High or lower floor prices.
It can be said that for now, the Bidding mechanism has no impact on the formation of the floor price at the cross-market level, because this is not a price change driven by trading volume, but is completely affected by the bidding-point system, so the impact of this The length depends on how long the mechanism has been in effect.
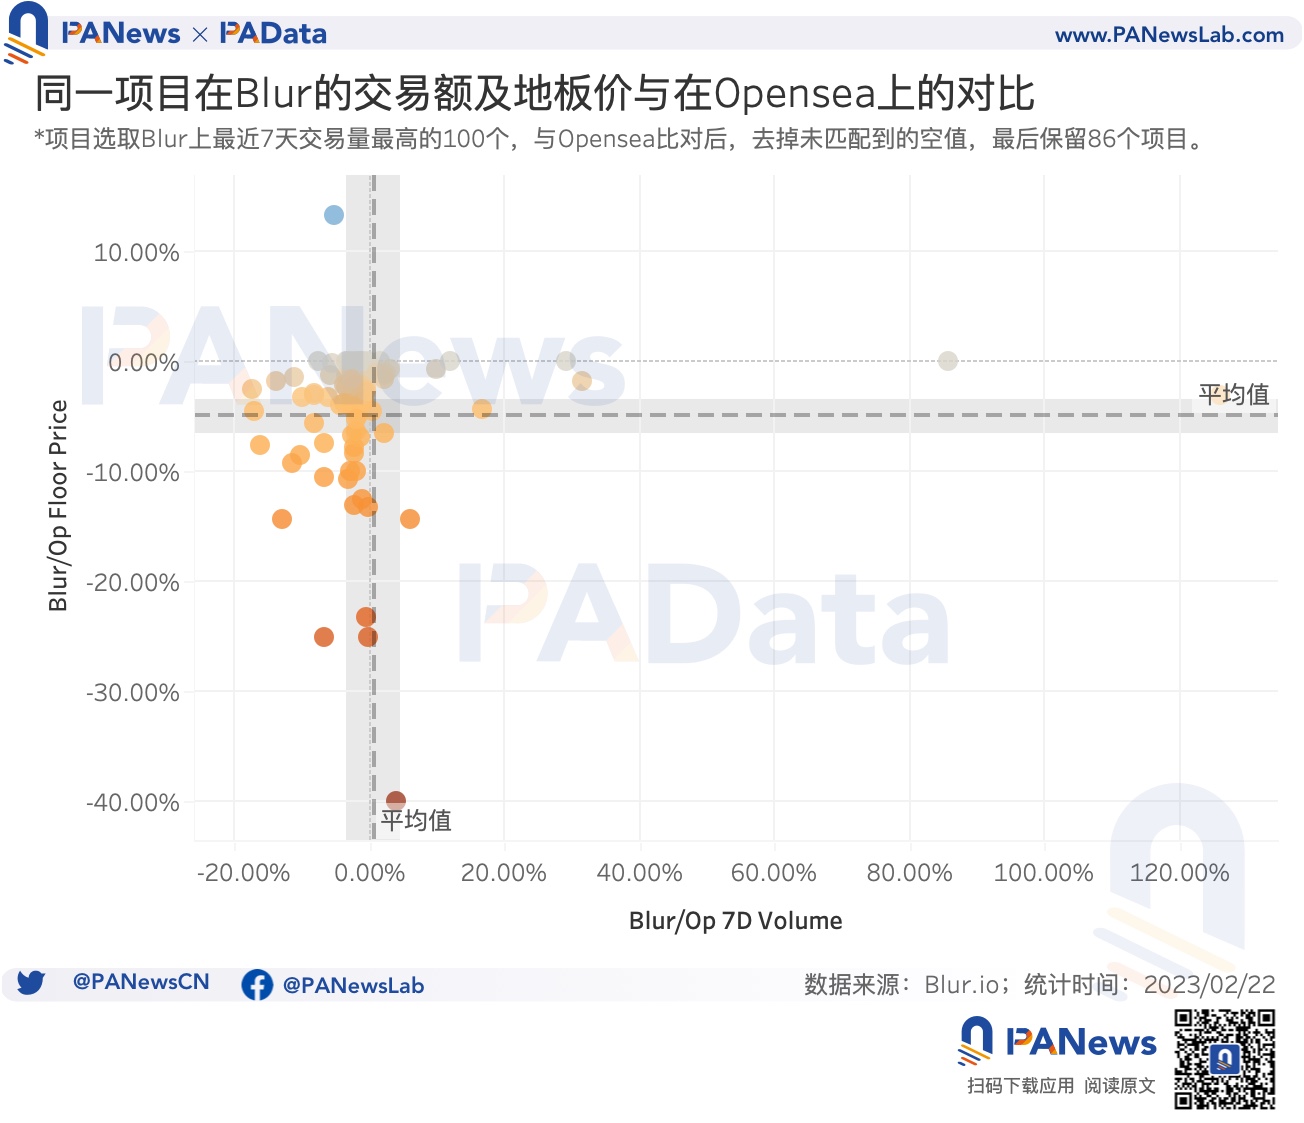
However, there are two points here that require special attention.
First, there are some NFT cases where the transaction volume on Blur far exceeds that on Opensea, and its floor price on Blur is also lower than that on Opensea. For example, Sewer Pass has 126% more transactions on Blur than Opensea, and its floor price is -3.1% lower than Opensea. But such cases are very few.
first level title
The trading strategies of high-scoring users are differentiated, and the current estimated revenue is negative
How do high-scoring users accumulate points through Bidding and Listing behaviors? PAData counts the transaction data of the top 10 users (users with high points) in history. At the same time, 8 of these 10 users are also among the top 10 users in the latest 24-hour scoreboard. By analyzing the trading behavior of these 10 users, we can get a glimpse of the "giant whale"'s strategy of scoring points.
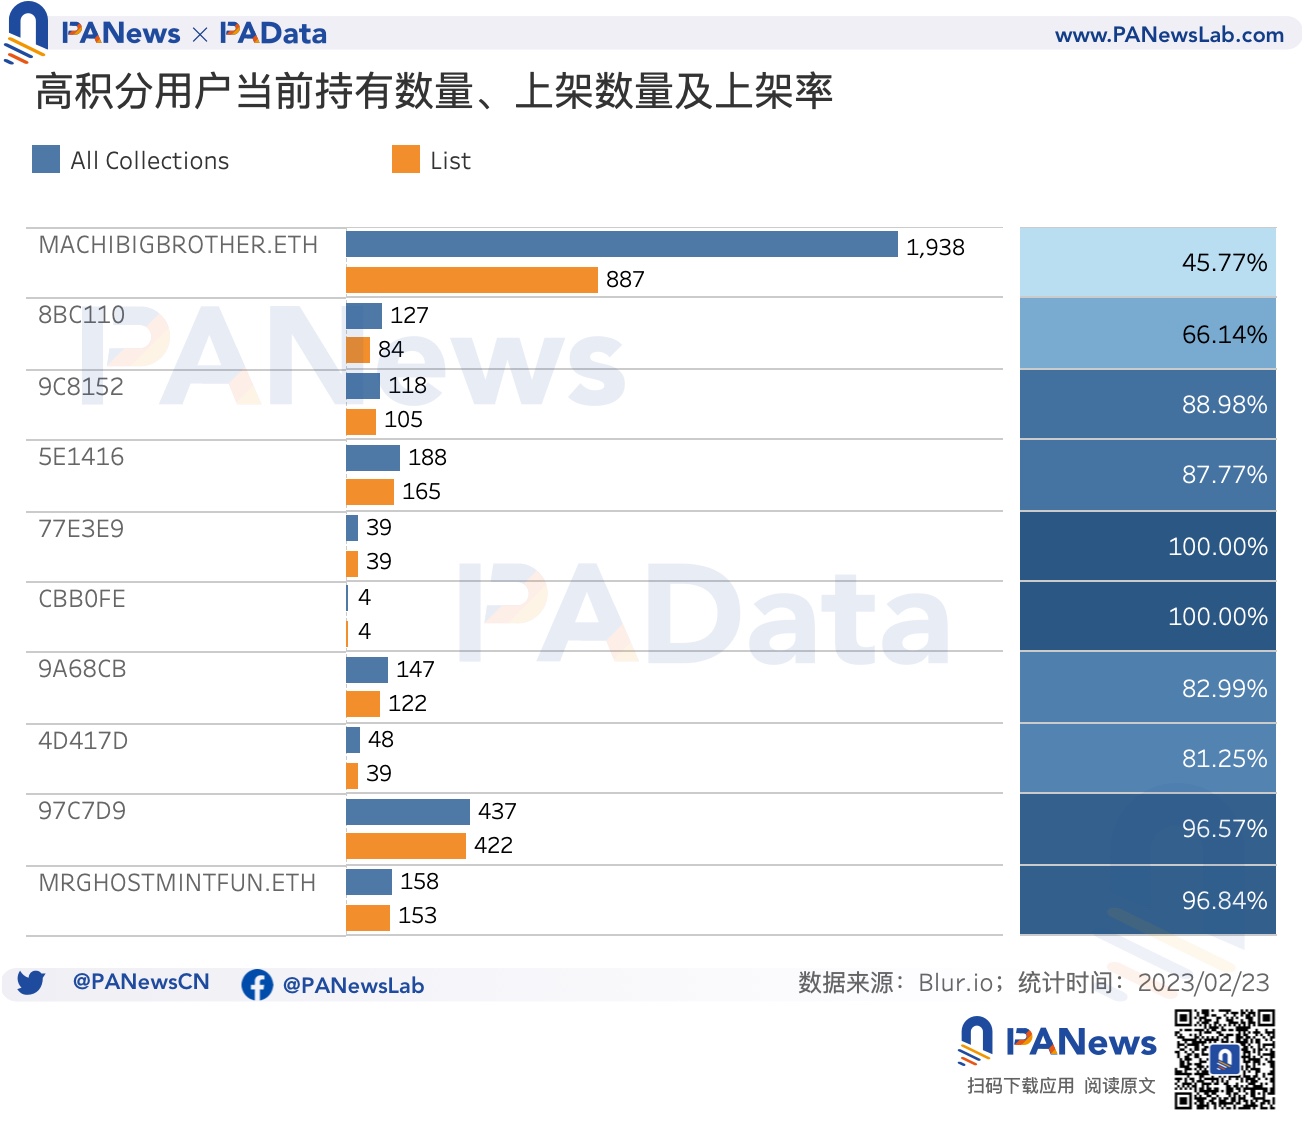
Users can earn points for Listing. If the ratio of the number of listings to the total number of holdings is regarded as the listing rate, it can simply measure the user's asset flow level and points in recent transactions. At present, the average listing rate of the 10 high-point users is about 84.63%, which can be understood as the current "inventory" status of most high-point users is a high turnover state. Among them, 77 E 3 E 9 and CBB 0 FE have the highest listing rate, reaching 100%, and all assets are in a tradable state. The listing rate of MACHIBIGBROTHER.ETH with the highest points is the lowest, only 45.77%, which is less than half. The listing rate of 8 BC 110, which ranks second in points, is not high, only 66.14%. big.
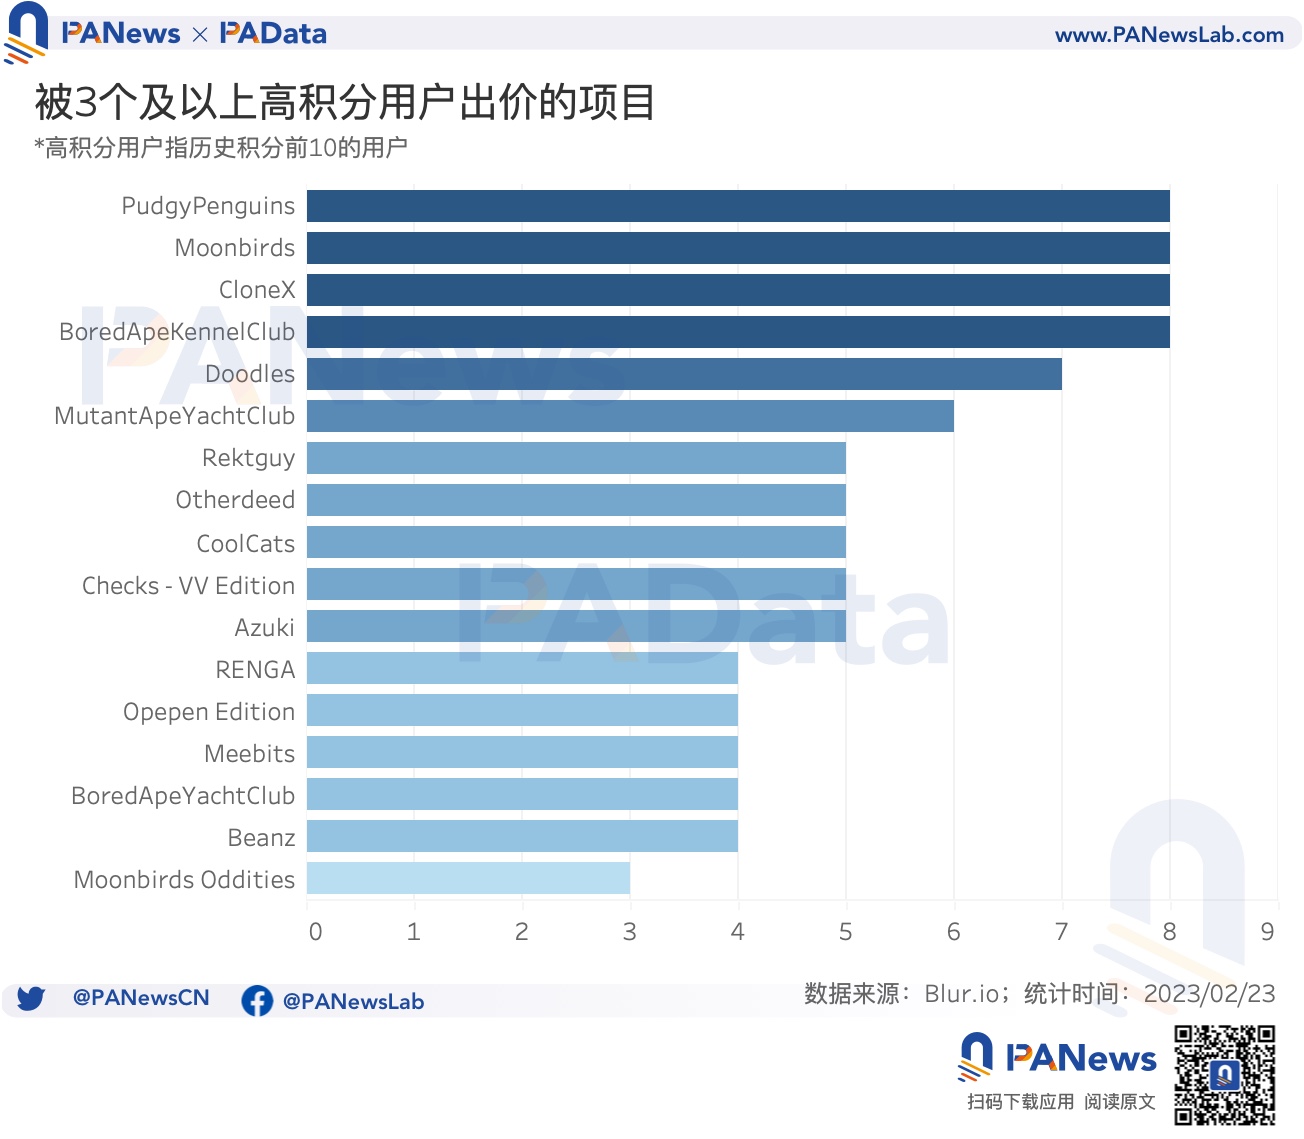
In addition to listing, Bidding (bidding) can also earn points. From the perspective of the number of NFT collections (items) bids in history, except for the two special extreme cases of 5 E 1416 bidding 464 items and 77 E 3 E 9 bidding 1 item, the number of items bid by other users is concentrated in 10 Between -20. Among them, 17 projects were bid by 3 or more high-scoring users, including top projects BoredApeKennelClub, CloneX, Doodles, MutantApeYachtClub, Otherdeed, Azuki, Beanz, BoredApeYachtClub, Oppen Edition, Moonbirds, popular project CoolCats, and other projects, Such as PudgyPenguins, Checks - VV Edition, Rektguy, Meebits, RENGA, Moonbirds Oddities. Among them, PudgyPenguins, Moonbirds, CloneX and BoredApeKennelClub were bid by 8 high-integrated users. It can be seen that the bidding objects of high-scoring users closely follow the official rules-TopCollections.
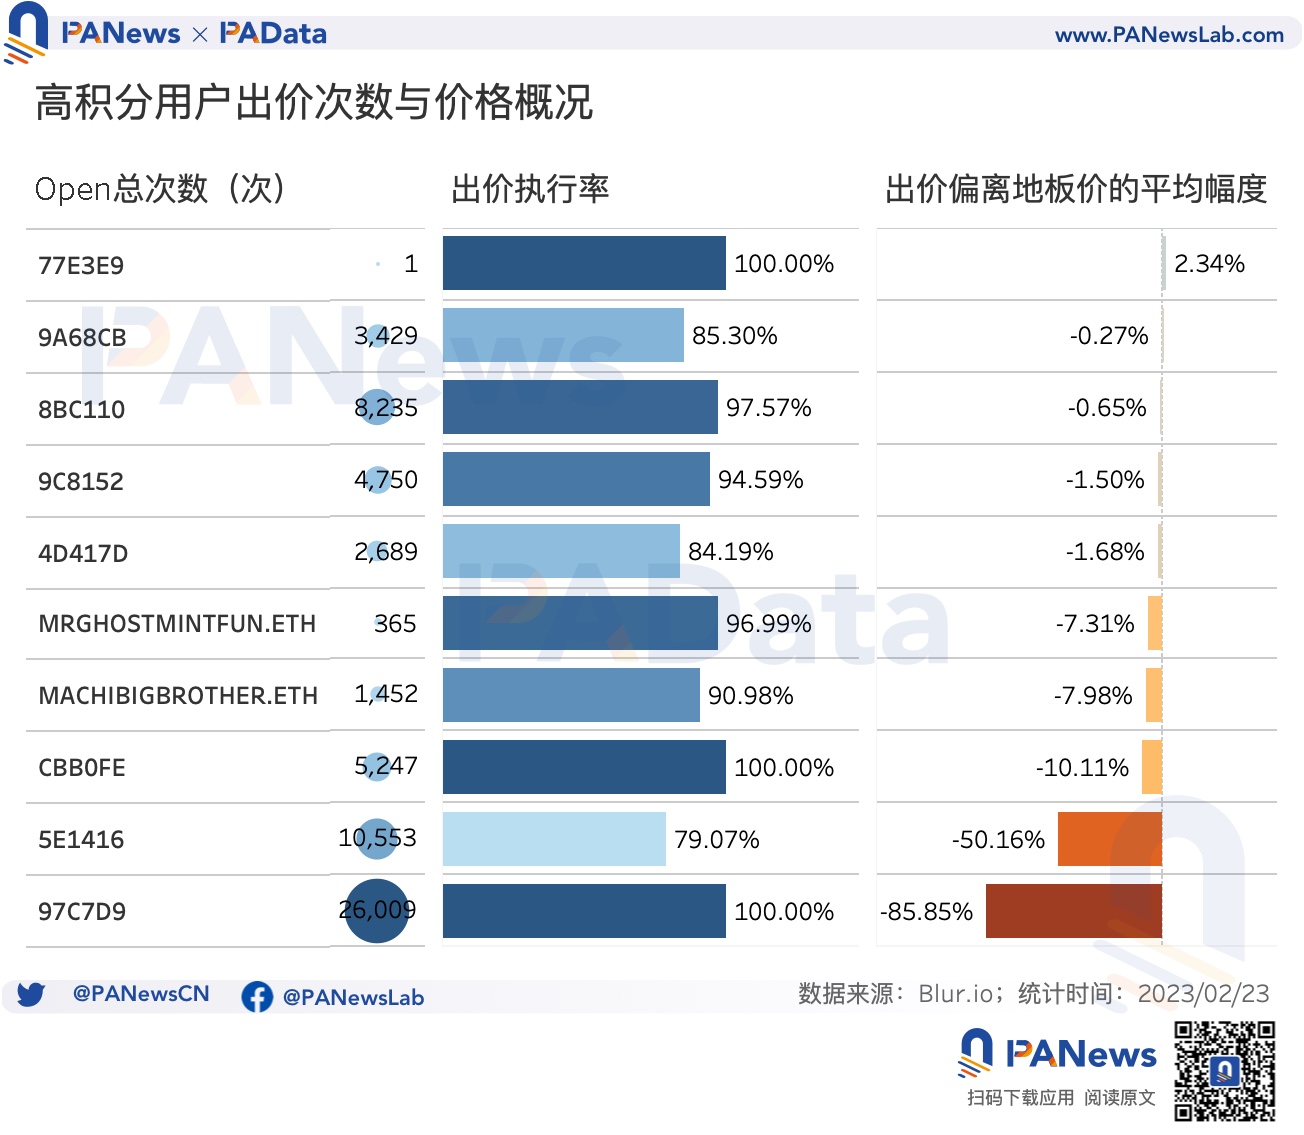
From a more microscopic perspective of Bidding behavior, the total number of valid bids (Open) by 10 high-scoring users is about 62,700 times, the average bid deviation from the floor price is about -16.32%, and the average bid execution rate is about 92.87%. However, there are great differences in the number of effective bids and the deviation of bids from the floor price by different high-scoring users.
In general, the types of bidding behaviors of high-scoring users can be classified into two categories. The first category, such as 9 A 68 CB, 8 BC 110, 9 C 8152, 4 D 417 D, their bids are about 5000 times, the execution rate of bids is about 90%, and the bids are very close to the floor price, which is the most in line with the rules ideal type.
The second category, such as MACHIBIGBROTHER.ETH, MRGHOSTMINTFUN.ETH, and CBB 0 FE, have fewer bids than the first category, about 2,500 times, and their bid execution rate is slightly higher than the first category, about 96%, but The bid was significantly lower than the floor price. In addition, there is another category, such as 5 E 1416 and 97 C 7 D 9. The number of bids is higher than 10,000, and the range of bid deviation from the floor price is very large, but the execution rate is high or low. There are many "missing" behaviors.
However, there is a cost to earn points. From the perspective of the cost of high-scoring users (referring to the transaction cost in Blur, if it is a transfer, the cost will be recorded as zero), as of the afternoon of February 25, the average cost of 10 high-scoring users reached 1098.29 ETH, according to CoinGecko The average price of ETH this month is estimated at US$1,627, which is equivalent to US$1.7869 million. Among them, the one with the highest cost is MACHIBIGBROTHER.ETH, which has invested 5,636 ETH, equivalent to $9,169,700. Even CBB 0 FE, which has the lowest investment cost, reached 17 ETH, which is equivalent to 28,200 US dollars.
Moreover, although most of the high-scoring users are still in a profitable state from the perspective of historically realized revenue profit and loss, without exception, in Blur’s brush-scoring transactions, the NFT currently held by these 10 high-scoring users, The total value estimated according to the floor price is lower than the cost, that is, it is currently in a state of estimated loss. Basically, the more investment, the more loss. For example, MACHIBIGBROTHER.ETH currently estimates a loss of 535.8 ETH, equivalent to $871,700, and 97 C 7 D 9 currently estimates a loss of 249.9 ETH, equivalent to $406,600. The current average estimated loss of 10 high-scoring users is 90 ETH, which is equivalent to $144,900.

It can be seen that if you want to get high points in the second round, you need to invest a lot of capital costs, and, encouraged by the point rules, the floor price on the Blur market has a downward momentum, which makes users who participate in Bidding need to Continuously and dynamically manage your own cost-estimated value difference. The management standard for this gap should be the expectation of the airdrop value. If the total value of the airdrop can be covered, then the current estimated loss will become the cost in disguise, otherwise, the current The estimated loss will become a real loss.
the data shows:
the data shows:
[ 1 ] Considering that the minimum price gradient displayed by the official is 0.01 ETH, and the floor price of popular projects is low, if the floor price of the head project is uniformly processed, it will not be able to show the depth, so the scale is adjusted to ± 10% . Moreover, all prices are rounded to the scale of 0.01 ETH (retaining two decimal places), which may cause certain errors, but has no effect on the overall structure judgment.