Is the "bear to bull" really happening? We analyze the LTH-STH on-chain indicators for four cycles
from |cryptoslate,Odaily :Moni

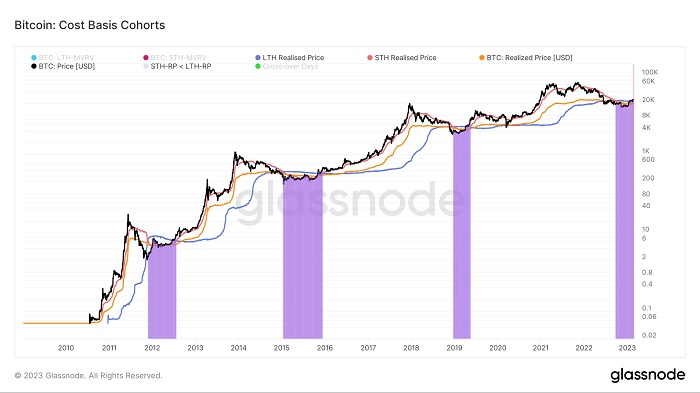
The Bitcoin market usually has a 4-year cycle of ups and downs due to "halving". When the realized price of Bitcoin short-term holders flips the realized price of Bitcoin and the realized price of long-term holders, it will create a measurable Market FOMO will also trigger a new round of "parabolic" growth.
The data show that this reversal is traceable,The 2011 bear market entered a bull market after 9 months, 2015 entered a bull market after 11 months, and 2019 entered a bull market after 6 months. And now, it's been 5 months since Bitcoin short-term holders' realized price fell below long-term holders' realized price in 2022secondary title
concept note
The realized price (Realized price) is an indicator used to confirm the trend of bear market and bull market. The calculation rule of this indicator is to divide the purchase price of all bitcoins by the value of the total amount of bitcoins in circulation. The realized price can effectively show the The cost basis of the currency network.
In addition, dividing into groups can also help us further understand the total cost base of different currency holder groups. Long-term holders (LTH) and short-term holders (STH) are the two main groups currently driving the market. Generally speaking, holders Addresses that have held Bitcoin for more than 155 days are considered LTH, while addresses that have held Bitcoin for less than 155 days are considered STH.
The LTH-STH cost basis ratio (LTH-STH cost basis ratio) is an indicator that evaluates the ratio of realized price of long-term holders to short-term holders. Given the different behaviors that long-term and short-term holders have shown in Bitcoin's history, this indicator can basically reflect how the dynamics of the Bitcoin market have changed.
for example,When short-term holders have more realized losses than long-term holders, the LTH-STH cost basis ratio tends to rise, indicating that short-term holders are selling Bitcoin to long-term holders, which also means that the market enters In the bear market phase, long-term holders begin to enter the accumulation phase. Conversely, when the LTH-STH cost basis ratio is trending downward, it indicates a bull distribution phase, when long-term holders sell Bitcoin for a profit and short-term holders buy.
secondary title
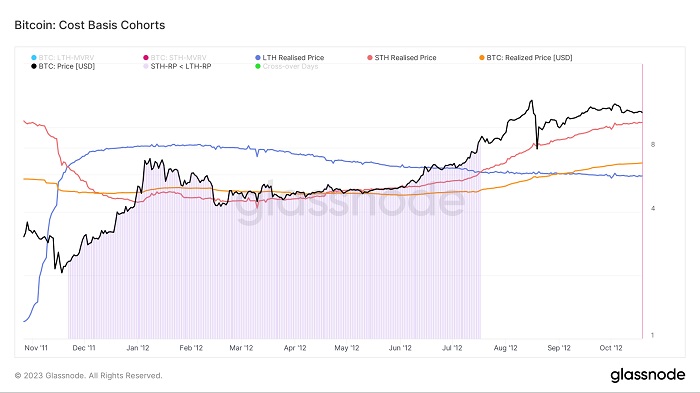
year 2011
In 2011, Bitcoin encountered its first bear market, during which the realized price of short-term holders was lower than that of long-term holders. This trend also marked the beginning of the bear market. The first bear market of Bitcoin began in 2011 November 22, 2012 and continues until July 17, 2012.
secondary title
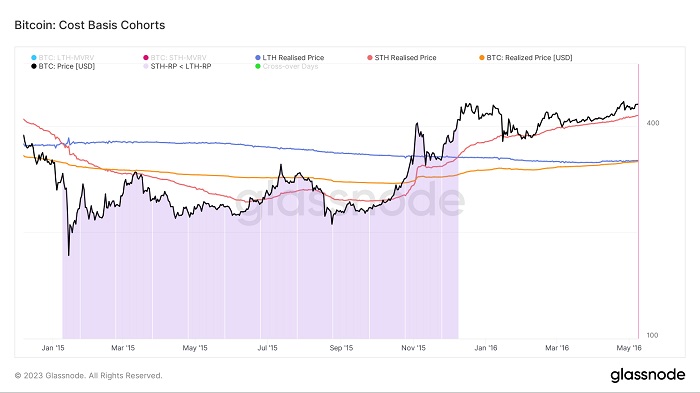
2015
The 2015 bear market followed a similar pattern.
On January 8, 2015, the realized price of short-term holders was lower than that of long-term holders, triggering a bear market that lasted until December 8, 2015.
secondary title
2018
secondary title
2022
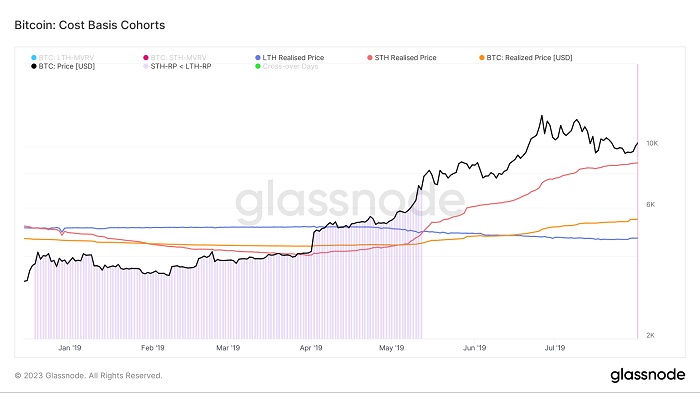
From the beginning of September 2022, the realized price of short-term holders began to decline, and fell below the realized price of long-term holders on September 22, 2022, and this continuous downward trend continued until January 10, 2023. Then began a slow and steady rebound.
Here's the current situation: Short-term holders of Bitcoin have a realized price of $19,671, while long-term holders have a realized price of $22,228, and Bitcoin's realized price is $19,876.