After the FTX thunderstorm, have users turned to DEX?
Main points:
Original compilation: 0x11, ForesightNews
Main points:
CEX trading volume declined after FTX bankruptcy;
CEX dominates the daily trading volume, most of the market share is eaten by Binance and Coinbase;
DEX growth is slow, Uniswap leads in terms of transaction volume, while Pancakeswap leads in number of independent traders;
Compared to CEX, DEX trades less than 10% of the time (lots of room to grow?)
After the FTX bankruptcy, many people are concerned about the trading volume performance of CEX and DEX: has there been any major changes? Or is there no change at all? In this post, we will use data analysis from CoinGecko and Dune analytics to try to draw some conclusions.
CEX Trading Volume Analysis
Here, the centralized exchange with high trading volume on CoinGecko is defined as the top CEX.
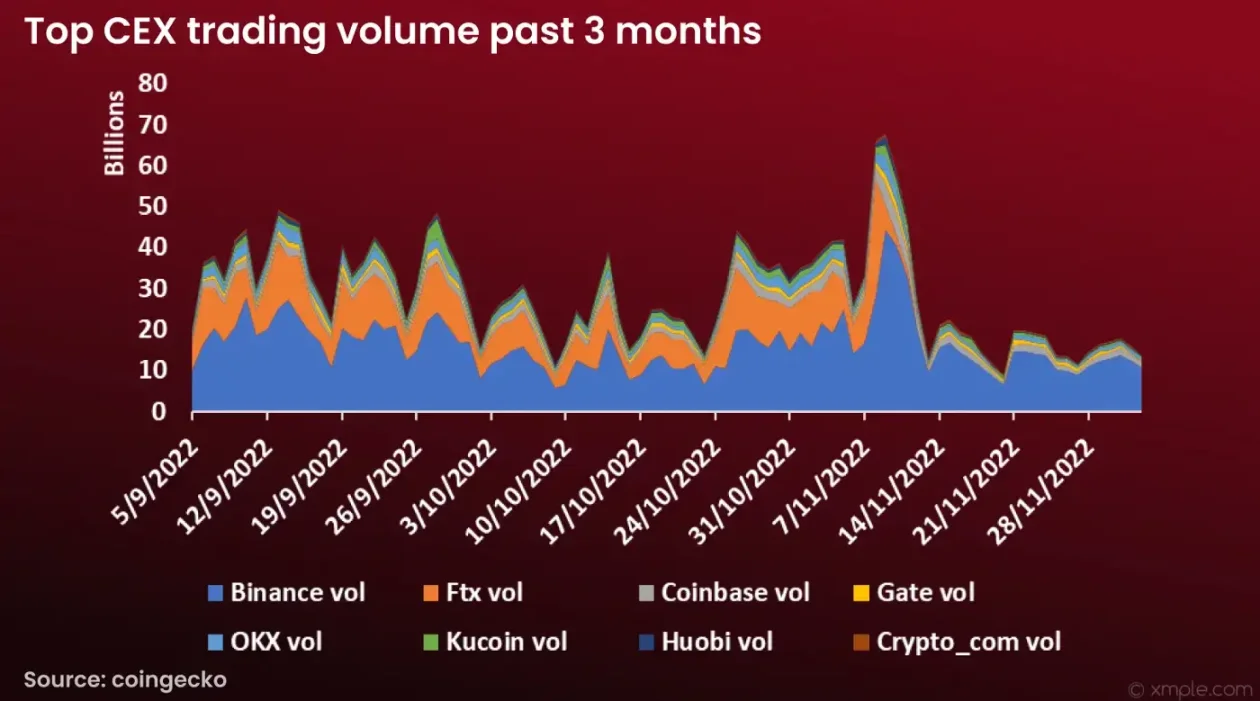
First, let's see how CEX volumes changed after the FTX event. Obviously, starting from November 7, 2022, after FTX became insolvent, the trading volume from top CEXs dropped sharply, from an average daily trading volume of more than 30 billion US dollars to the current average daily trading volume of 10 billion US dollars. So, who will gobble up most of FTX's market share?
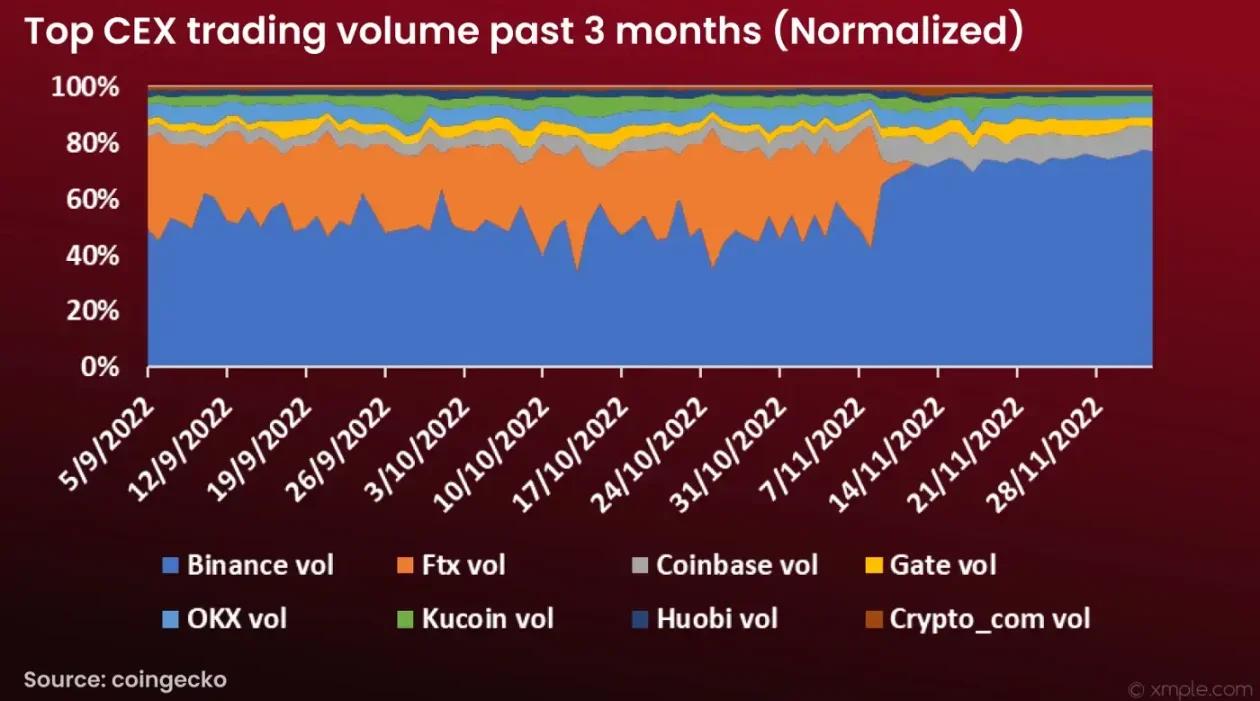
Unsurprisingly, Binance and Coinbase took major market share following the collapse of FTX. Before the FTX incident, Binance's market share was only around 50%, but now it is as high as 80%. The market shares of OKX and Coinbase also increased by a few percentage points, while other exchanges remained unchanged.
DEX trading volume analysis
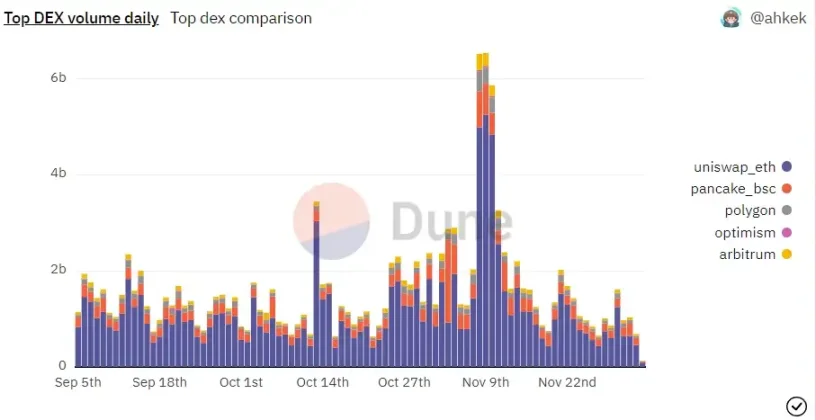
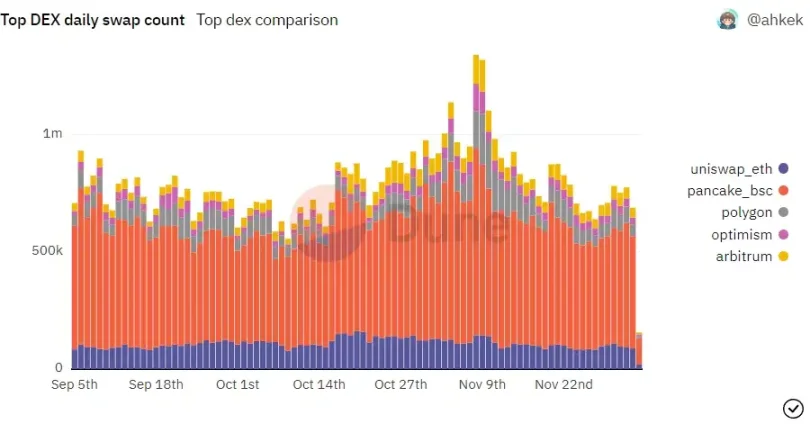
For DEX transaction volume, we select the top DEXs from each chain in Ethereum, Polygon, BSC, Optimism, and Arbitrum for analysis. Interestingly, we saw DEX volume spike around November 6th as the FTX crash started. In addition, the trading volume of DEX on other trading days was quite ordinary, without any major changes.
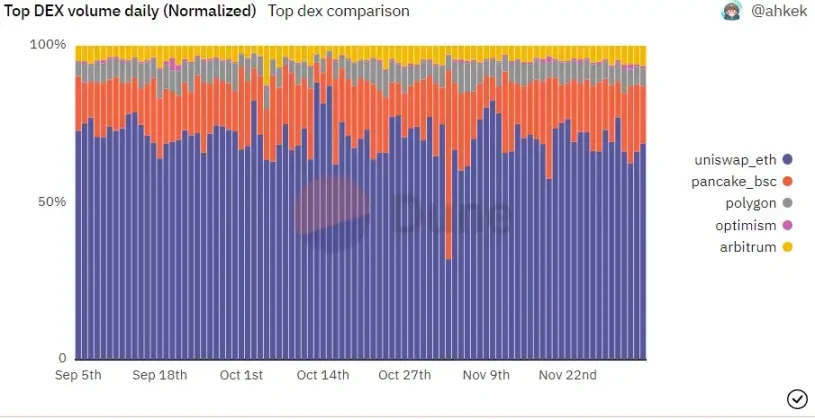
Uniswap from Ethereum took most of the market share, followed by Pancakeswap on BSC.
What if we put the trading volume of DEX and CEX together to make a comparison chart?
CEX VS DEX Trading Volume Analysis
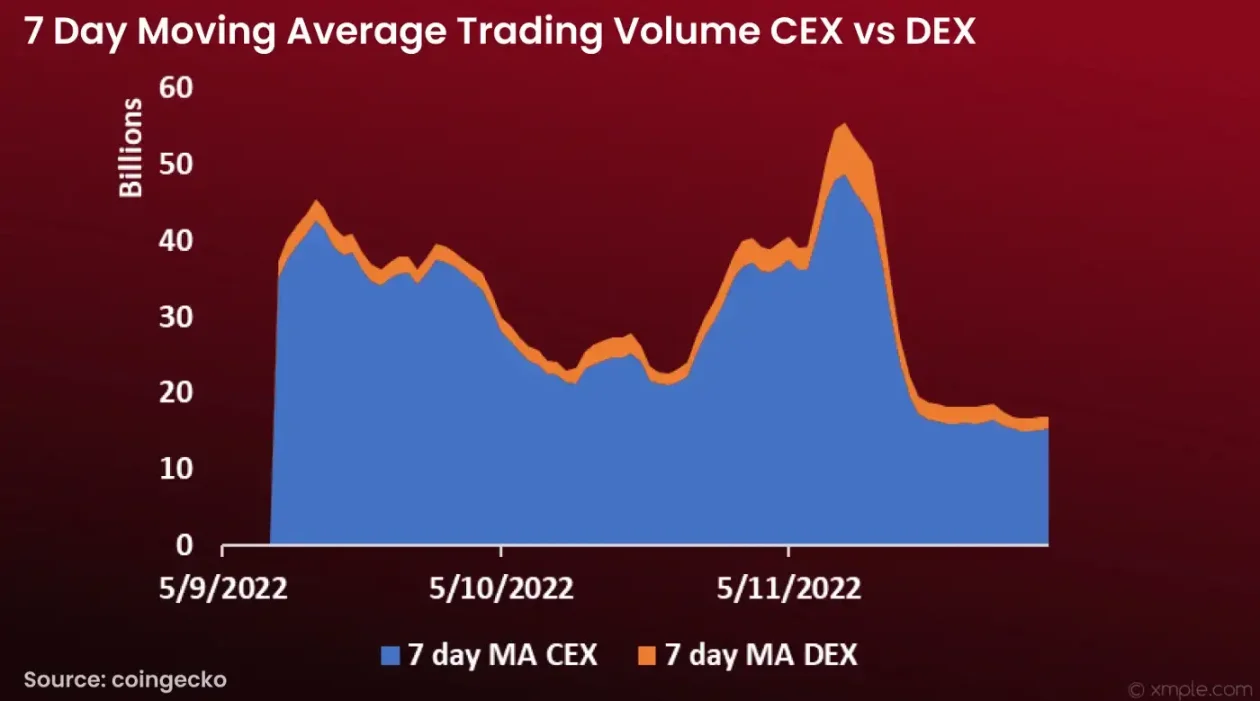
The chart above shows the 7-day moving average trading volume for CEX and DEX. The reason we use moving averages is to smooth out the chart for a clearer visualization by removing spikes and instability in volume changes. After November 6, total transaction volume remained low at just over $10 billion per day (down from an average of over $30 billion). So after the bankruptcy of FTX, will traders turn to DEX for trading?
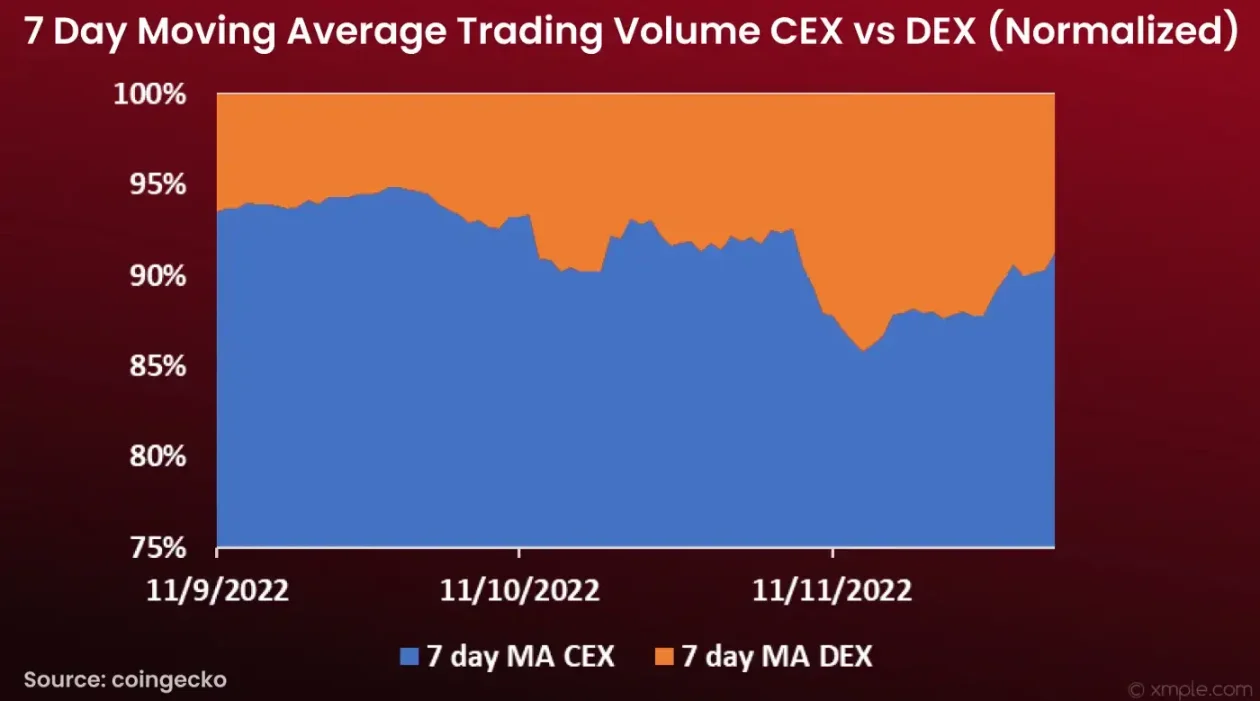
Clearly, DEX volumes have increased in terms of market share. The increase was not significant however, as only a small fraction grew, but it is now slowly decreasing again. Are users still using CEX transactions?
DEX stand-alone user
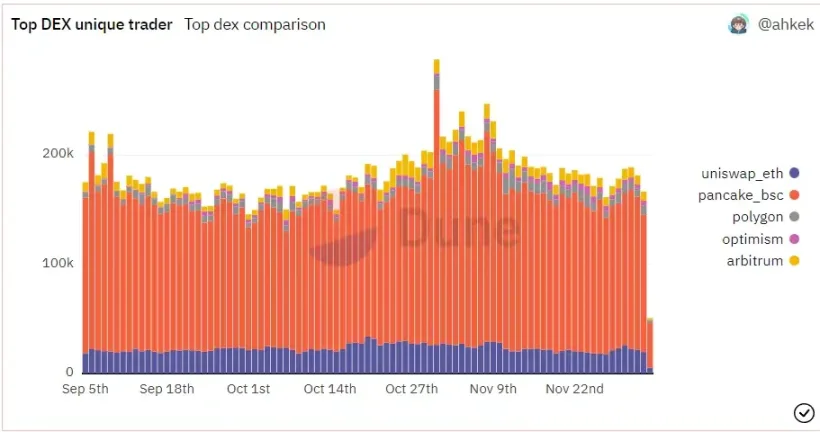
The graph above shows the number of daily unique traders on top DEXs. From the chart alone we can see that most traders are trading on Pancakeswap. However, the number of unique users did not change significantly after the FTX event.
in conclusion
in conclusion
CEX contributes most of the transaction volume, most cryptocurrency traders or holders prefer to use CEX, CEX is more regulated and provides simpler and more convenient UX/UI. CEXs are also more liquid than DEXs.
Original link