
Nansen: Data Overview BNB Chain Key Progress in the Second Quarter
Original source: Nansen
BNB Chain (formerly known as Binance Smart Chain or “BSC”) was launched in September 2020 to provide an alternative smart contract platform to the increasingly expensive Ethereum mainnet. It is an independent blockchain that uses a proof-of-stake (PoSA) consensus mechanism (participants stake BNB to become validators). The chain is also compatible with the Ethereum Virtual Machine (EVM), meaning it can leverage pre-existing Ethereum tools that have fueled its massive growth.
BNB was created as a scalable infrastructure to handle large volumes of low-cost DeFi transactions without compromising speed. It also aims to provide programmability and smart contracts to developers wishing to issue their tokens on the BNB Chain network.
To date, there are thousands of projects on the BNB chain, with notable ones including SecondLive, Tiny World, and MOBOX. Additionally, PancakeSwap remains the most used dApp on the network in the second quarter of 2022. Among all blockchains, BNB Chain remains by far the most used chain in terms of transactions and unique wallet addresses due to low transaction costs.
BNB’s 2022 Q2 key developments
The BNB Chain $1 billion Ecosystem Fund continues to fund numerous projects to grow and improve the ecosystem.
Binance Cross-Chain Bridge 2.0 launched on April 27, enabling users to bridge assets from any blockchain to the BNB chain
The BNB smart chain mainnet has experienced the upgrades of Descertas (April 1) and Euler (June 9).
BNB Beacon Chain open source code June 17
In June, BNB launched its fifth Most Valuable Builder program. This is titled MVB V: Uncharted Territory.
Nansen supports BNB Chain.NFT analysis (June 13)
Release of BNB Sidechain sidechain plan (June 2)
Adding more verification nodes to the BNB chain (from 21 to 41)
BNB Ecosystem
BNB’s ecosystem has grown to include more than 1,400 dApps in the second quarter, with popular ones including PancakeSwap, Venus, Alpaca Finance, SecondLive, Mobox, and Tiny World. Despite the current market environment, the $1B ecosystem fund and recent $500M investment fund are expected to help the ecosystem grow and expand.

source:BSCDaily
Nansen’s BNB data
Daily Transactions
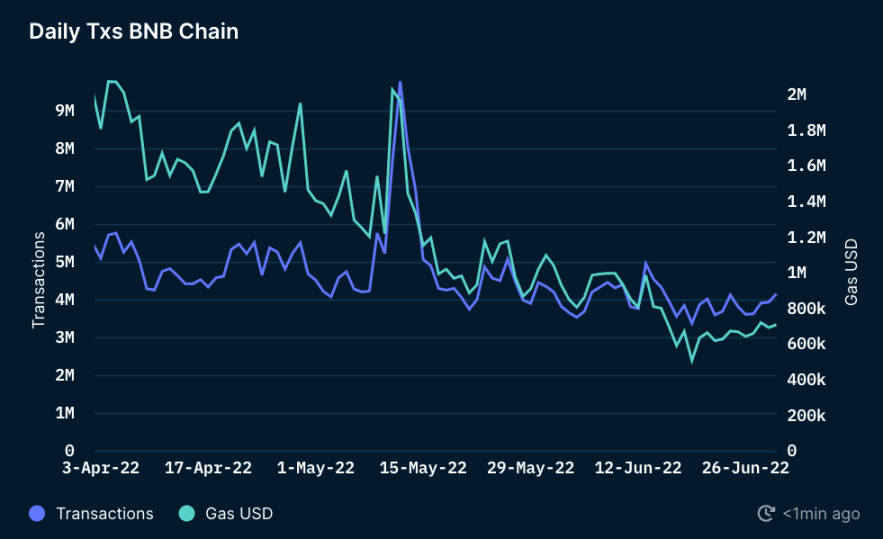
As you can see from the chart above, transaction volume and Gas continued to decline in Q2 2022 as general on-chain activity decreased while the market continued to be bearish. The sudden surge between May 11 and 12 was most likely a knock-on effect caused by the UST decoupling and LUNA collapse.
Number of transactions: Ethereum vs BNB Chain
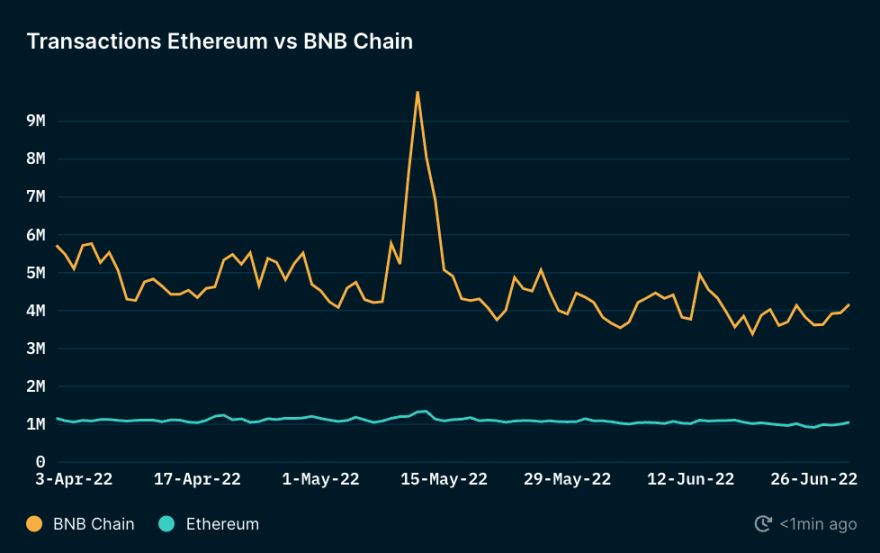
Source: Nansen
The BNB chain is the smart contract blockchain with the most active number of transactions, even dwarfing Ethereum. Although transaction volume declined slightly in Q2 (which can be explained by a general decrease in on-chain activity), it was still 3-6 times higher than that of Ethereum, reaching 9.8 million during the UST unpeg event on May 12 The peak of trading. While some of this may be attributed to bot activity, the BNB chain remains a popular retail chain with prices exceeding those of Ethereum.
BNB vs. Ethereum Comparison: Average Daily Gas Payments
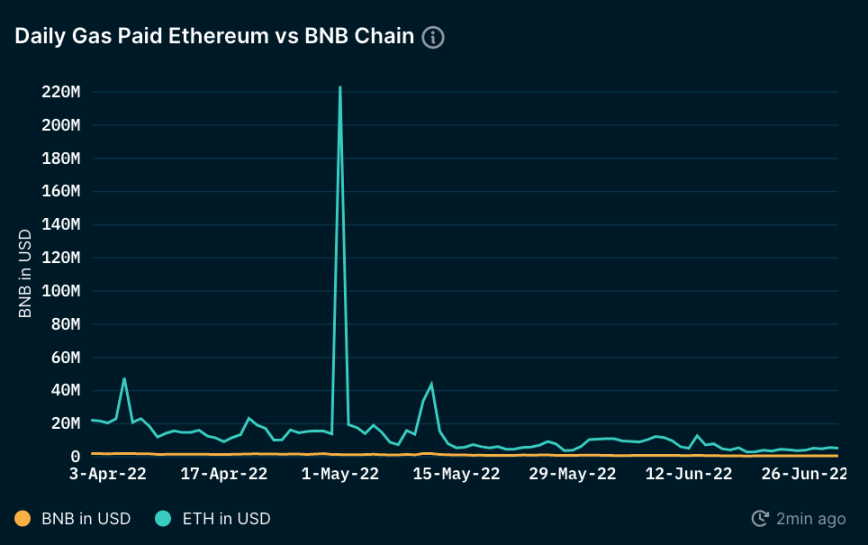
The data above shows that the total gas paid on the BNB chain continues to be significantly lower compared to Ethereum. Although it is cheaper and faster to conduct transactions on the BNB chain, since the Binance chain only has 21 active validators, it is much more centralized than Ethereum. Therefore, the BNB chain developer community introduced the BEP-131 proposal, which aims to incentivize and increase the number of validators to further decentralize the BNB chain. In addition to this, daily gas fees paid in USD for both chains continued to decline at the end of last quarter (see chart below for BNB).
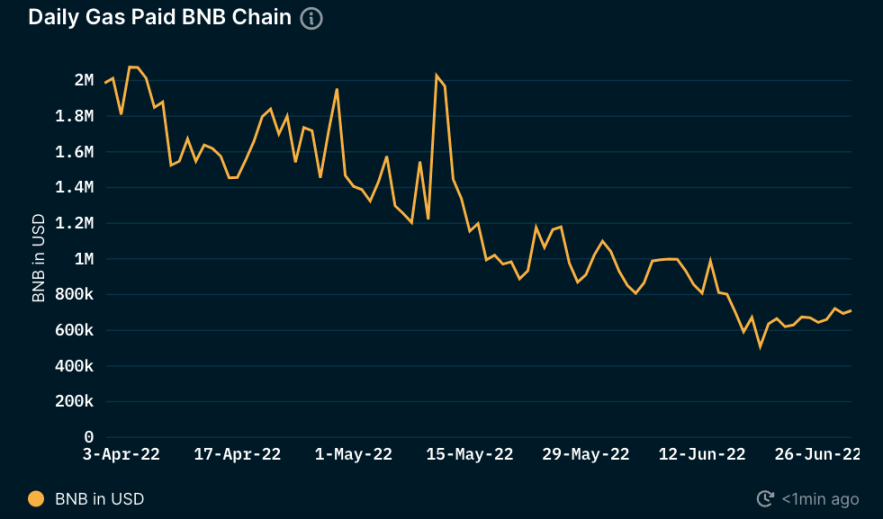
Additionally, it’s worth noting that BNB continues to see higher daily transaction volumes compared to Ethereum, while maintaining significantly lower daily gas fees – in the final week of the quarter, BNB averaged 700,000 USD, ETH is USD 5 million.
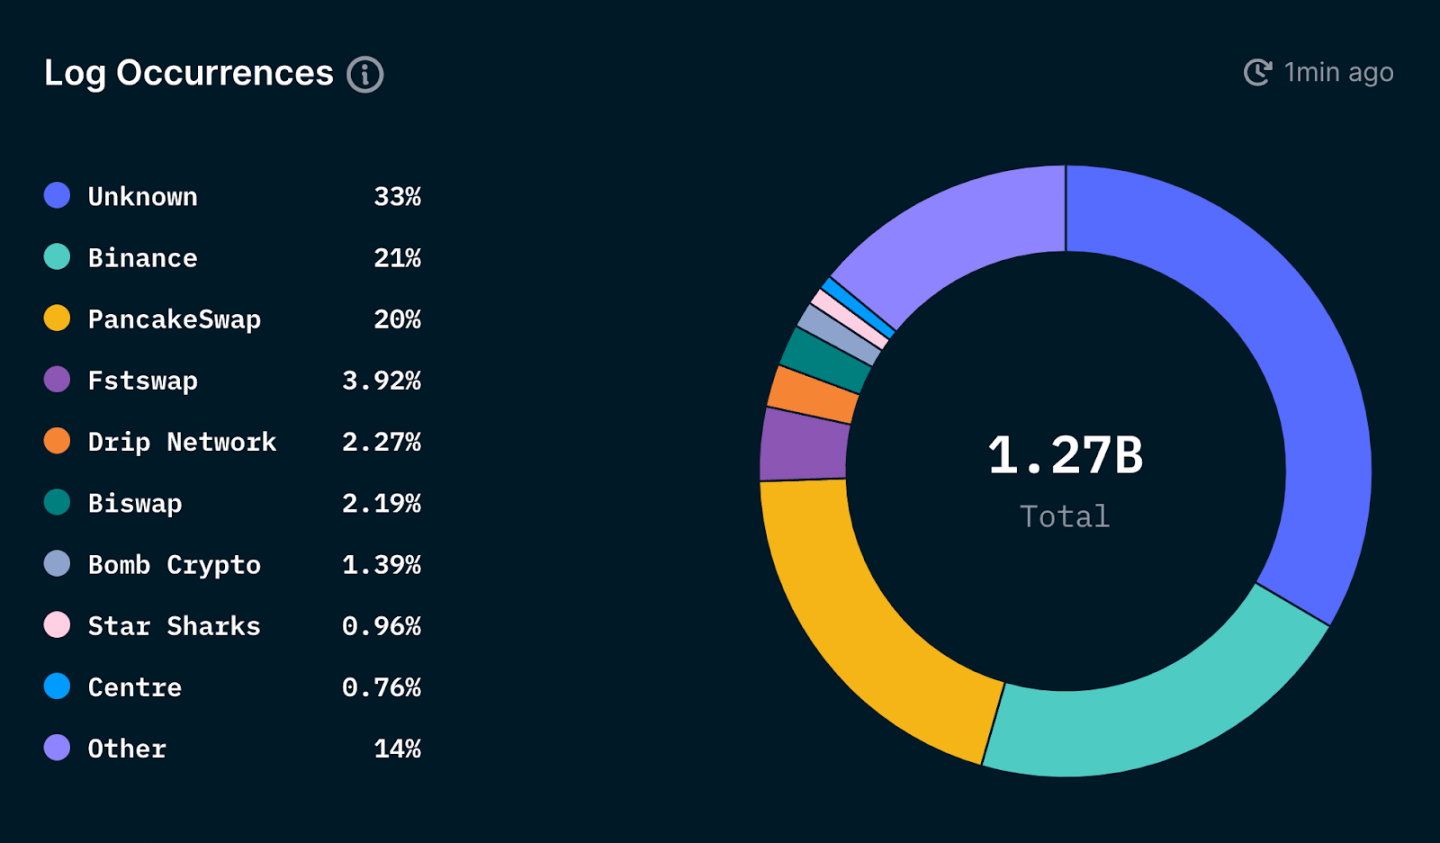
As mentioned previously, PancakeSwap continues to dominate usage on Binance Chain, accounting for 20% of all transactions on the chain. Others worth mentioning in the second quarter include SecondLive, MOBOX and Tiny World, popular Play-to-Earn games this quarter. Additionally, the 33% “unknown” tags refer to the sum of all Nansen’s untagged on-chain entities, rather than any single unknown entity.
Stablecoin trading volume on BNB
The daily stablecoin transaction volume in the chain is another important metric that can be used to evaluate the activity and adoption taking place in the network. As chain adoption grows, so does the number of stablecoins on the chain daily, as stablecoins are a fundamental component in facilitating token trading.
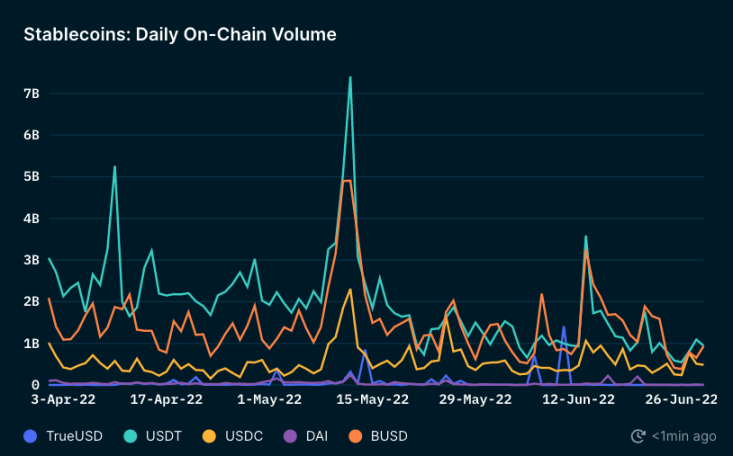
The above chart shows the daily on-chain transaction volume of USDT, DAI, USDC, BUSD and TrueUSD on the BNB chain. At the beginning of the quarter, there were significant changes in daily on-chain transaction volumes for the different stablecoins available on the chain. USDT and BUSD accounted for the majority of activity, followed by USDC, DAI, and True USD. Due to the decoupling of UST, most stablecoin trading volumes peaked on May 12, with USDT reaching $7.4.
Towards the end of the quarter, the daily on-chain trading volumes of USDT, BUSD and USDC were relatively close. USDT trading volume fell by 87.29% since the peak, while BUSD and USDC trading volumes fell by 80.93% and 79% respectively. It’s also worth noting that TrueUSD peaked at $1.4b in early June, but ended the quarter with only around $1 million, down more than 99.93%.
Daily active users of stablecoin on BNB
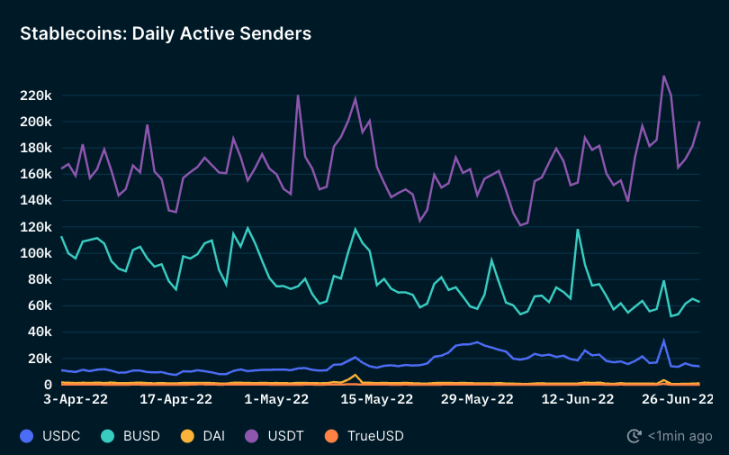
By further analyzing the daily active senders, the most traded stablecoin on the BNB chain is USDT, followed by BUSD. There is a significant difference in the number of daily active senders between these two stablecoins and all other stablecoins on the chain. USDT continued to dominate BUSD since the first quarter, and the gap widened towards the end of the second quarter. BUSDs user base dropped from a peak of 120,000 active daily senders to about 60,000. On the other hand, the number of daily active senders of USDT continued to climb to a peak of 235,000 in late June. Otherwise, DAI and TrueUSD continued to remain unchanged during the quarter, with the number of daily active senders for DAI continuing to hover around 1,200, while TrueUSD was below 200.
The smart money on Ethereum is on Binance Chain
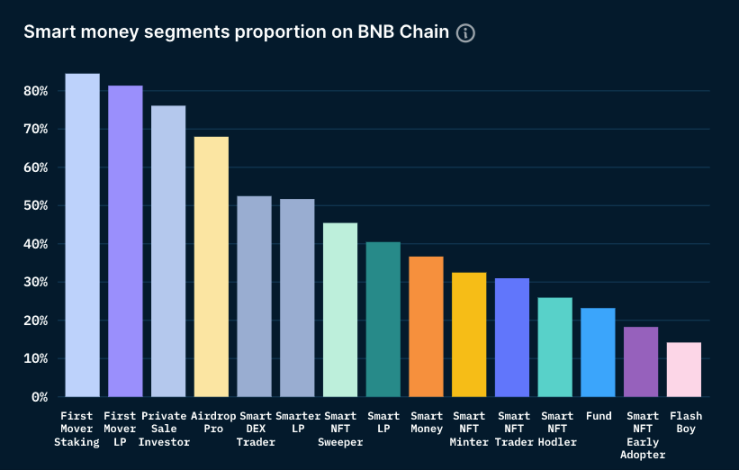
The chart above shows the breakdown of active smart money addresses on the BNB chain as a proportion of Ethereum addresses. They have been categorized according to the type of smart money.
Most smart money continues to belong to first mover stakers or liquidity providers (First Mover Staking, First Mover LP, Smarter LP, Smart LP), which can be explained by the higher APY for such activities on the chain. Given the continued high growth in on-chain NFT activity since Q1, smart money on NFTs followed closely behind. Institutional investors are a smaller segment, with an overlap of 23.2%.
Total Value Locked
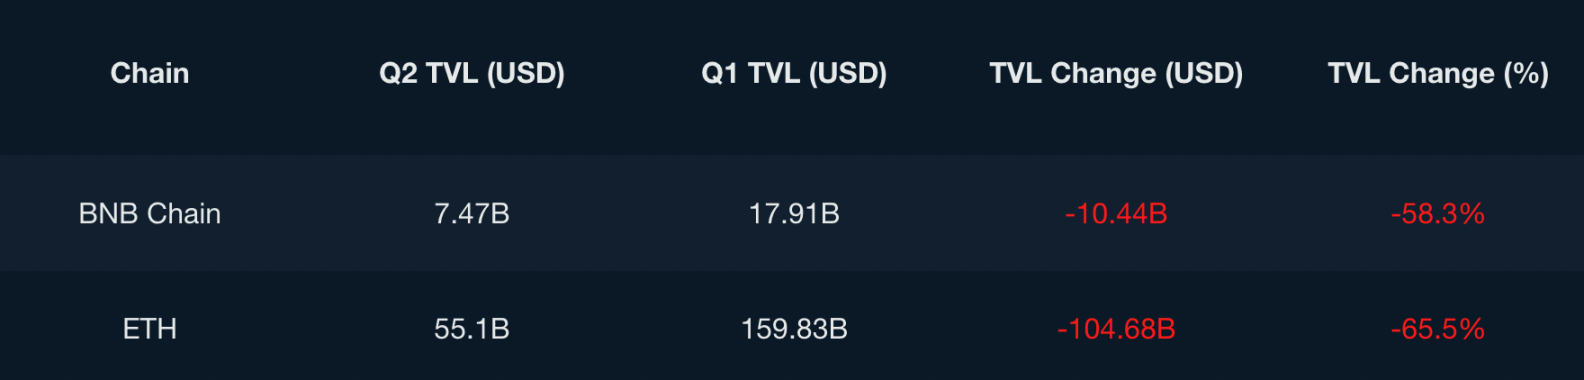
According to the TVL table above, TVL fell further this quarter as the cryptocurrency market faced an overall downward trend. However, it should be mentioned that BNB saw a lower TVL drop percentage of 58.3%, while Ethereum saw a 65.5% drop.
in conclusion
Despite the market downturn, BNB remains the most used chain for daily transactions due to its low gas fees. Throughout the second quarter, BNB also used its $1 billion Ecosystem Fund to actively fund new projects to improve the ecosystem despite difficult market conditions. With its large dApp ecosystem and low transaction fees, the BNB chain continues to be actively used by users. BNB liquidity staking will be introduced in the third quarter, as well as the BEP-126 plan: a fast finalization mechanism on the BNB beacon chain, which is expected to reduce transaction finalization time.


