Count the performance of 15 top public chains and ecological protocols: funds are gathered in the top public chains and top protocols
Recommended reading:
secondary title
Recommended reading:
Inventory of the empowerment of top DeFi governance tokens: dYdX does nothing, Synthetix returns everything
The coordinated development of the underlying public chain and the upper-layer protocol has jointly promoted the blockchain technology from virtual to real. When the market was rising in the past two years, the public chain and the protocol often complemented each other, and the public chain tokens and protocol tokens usually both rose. It can even be said that the development of DeFi has promoted the progress of the public chain to a certain extent. But now that the market is down, most assets are generally falling, and the liquidity crisis is imminent. Under such a background, what kind of situation will the public chain and protocol face? Which is the better performance of public chain tokens and protocol tokens?
To this end, the PANews data news column PAData analyzed 15 public chains with relatively high lock-up amounts and better development (hereinafter referred to as "top public chains"), and among them, 5 public chains with the highest lock-up amounts. The liquidity changes of the top 5 protocols (hereinafter referred to as "top protocols") in the first half of the year and the market performance of their tokens. The analysis found:
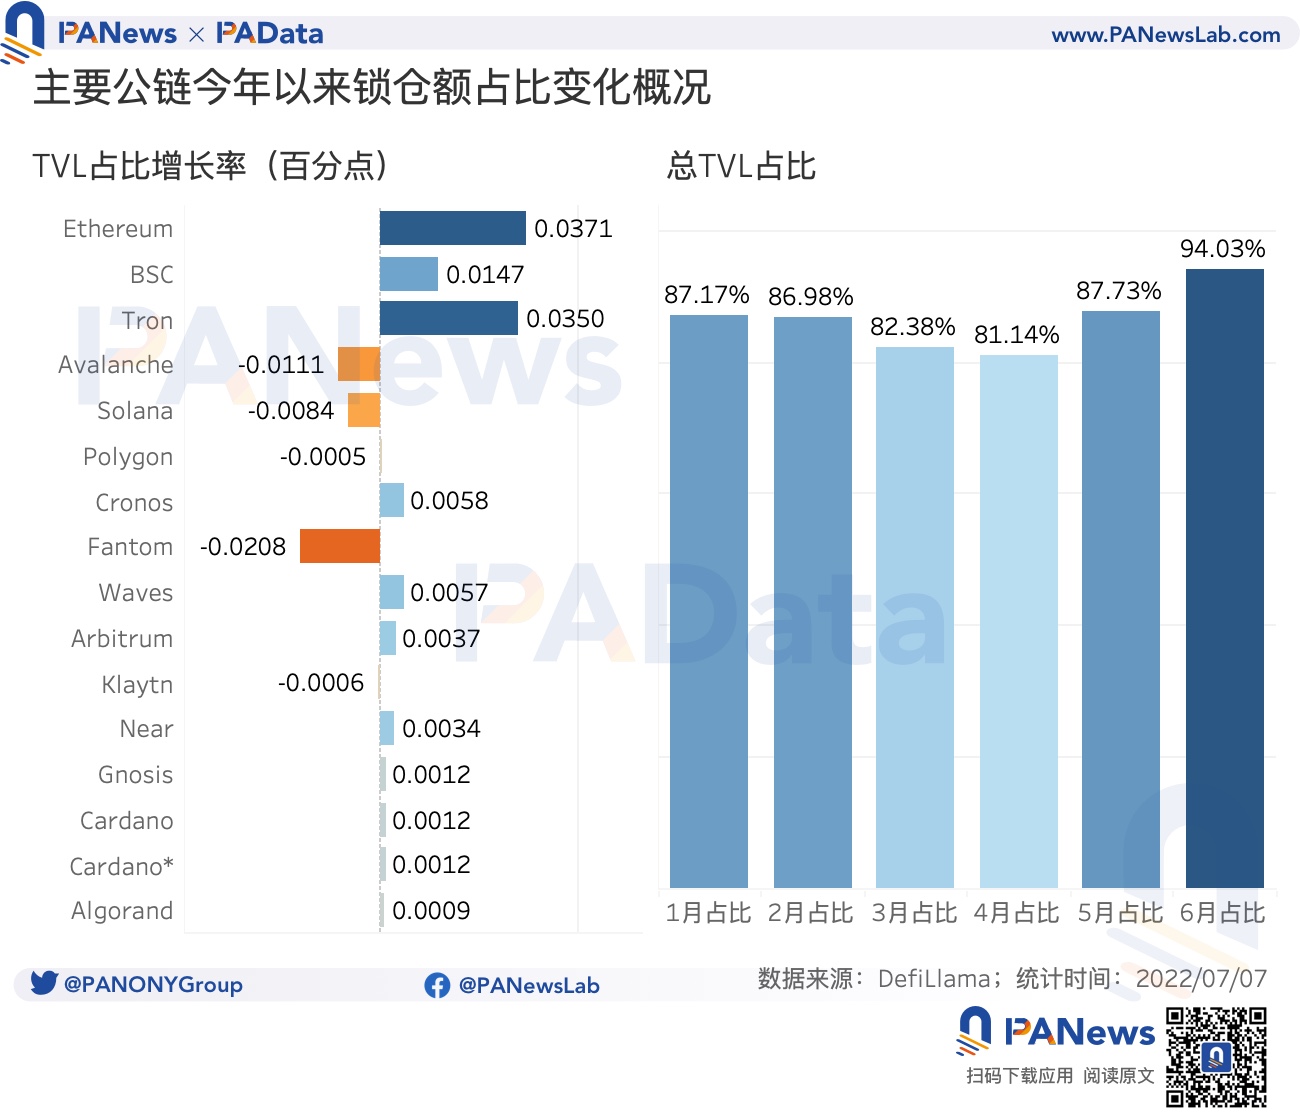
1) The stock funds are gathered in the leading public chains, and the proportion of the total lock-up amount of the 15 leading public chains has increased from 87% in January to 94% in June, and the stock funds are also invested in Ethereum and BSC Aggregating with Tron, the proportion of locked positions of these three public chains increased by 0.037, 0.015 and 0.035 percentage points respectively.
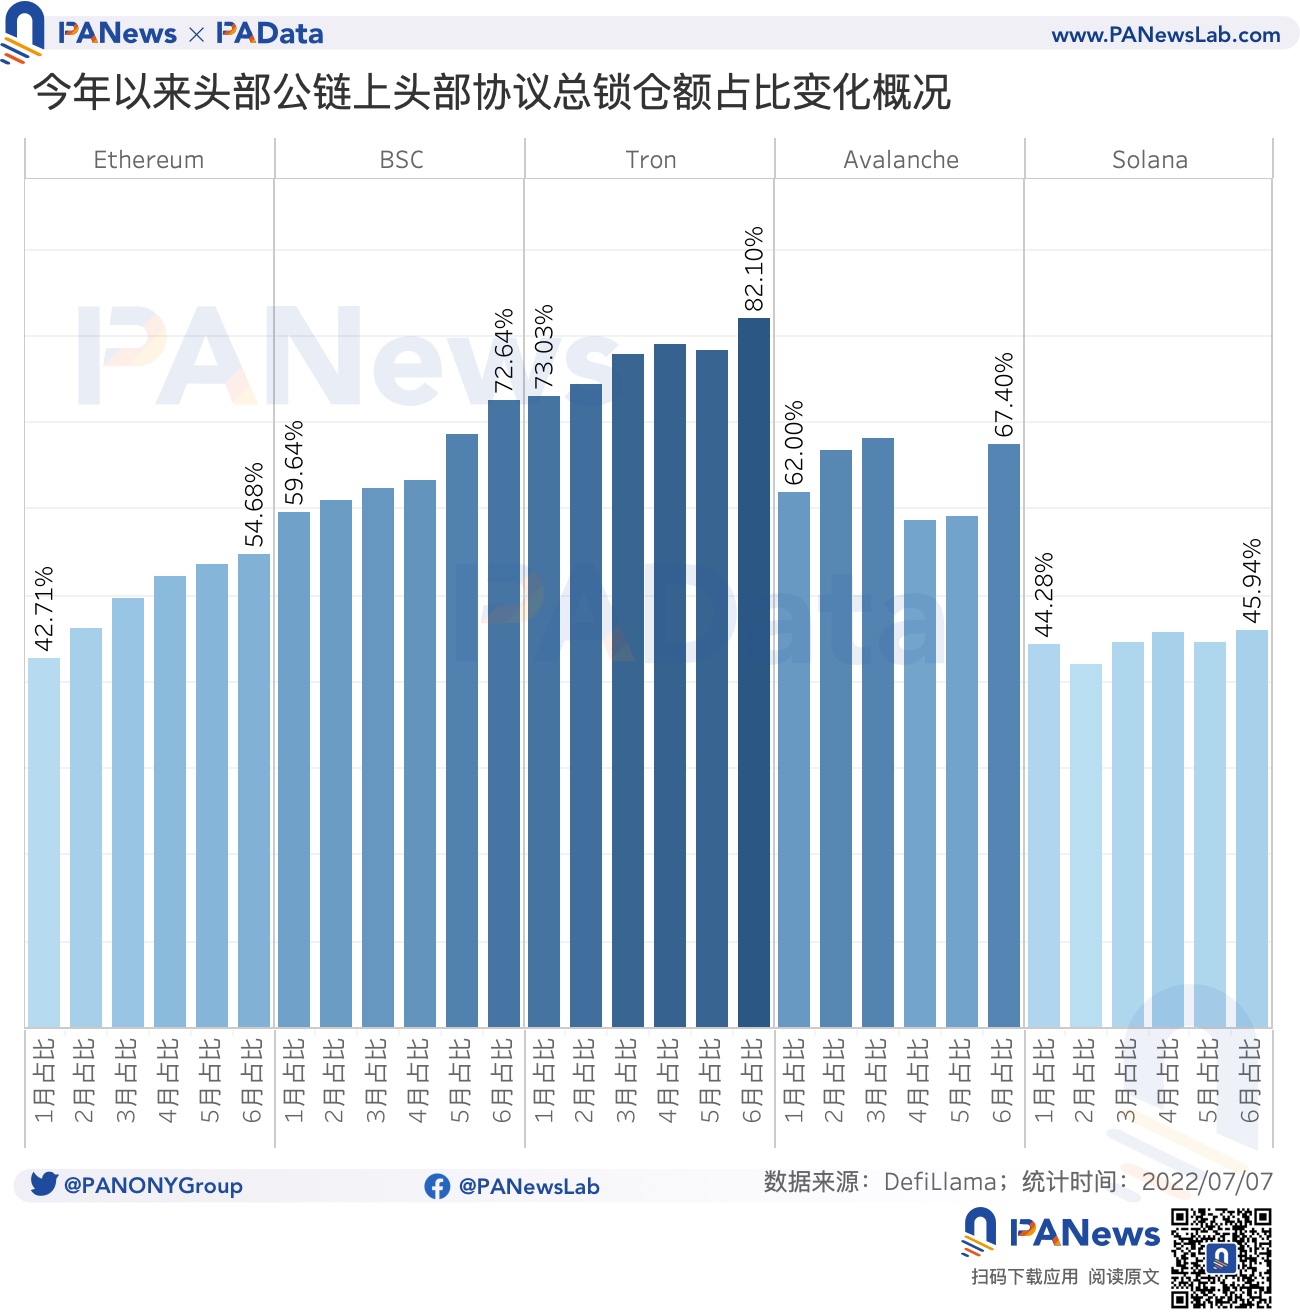
2) Stock funds are gathered in top protocols, and the lock-up ratio of top protocols on Ethereum has increased by about 8 percentage points. The proportion of lock-up amount of leading protocols on BSC, Tron, Avalanche and Solana increased by 13 percentage points, 9 percentage points, 5 percentage points and 2 percentage points respectively.
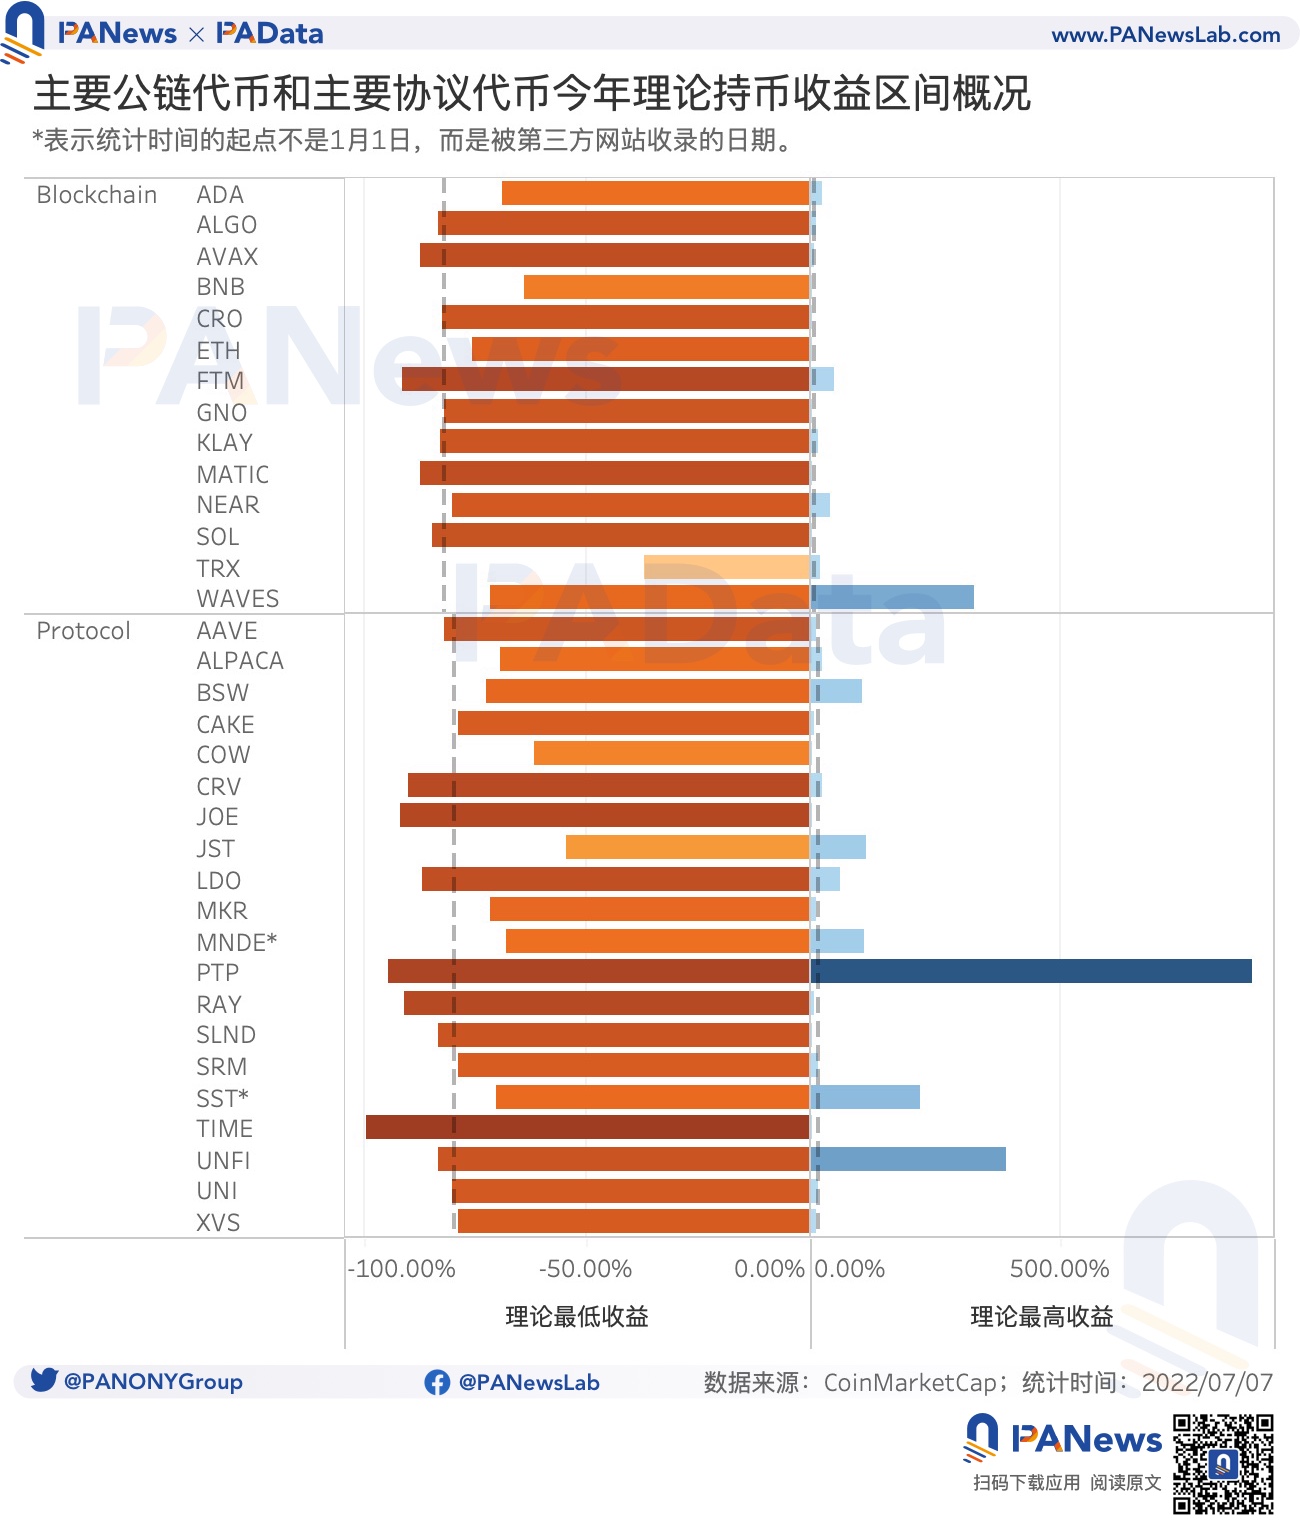
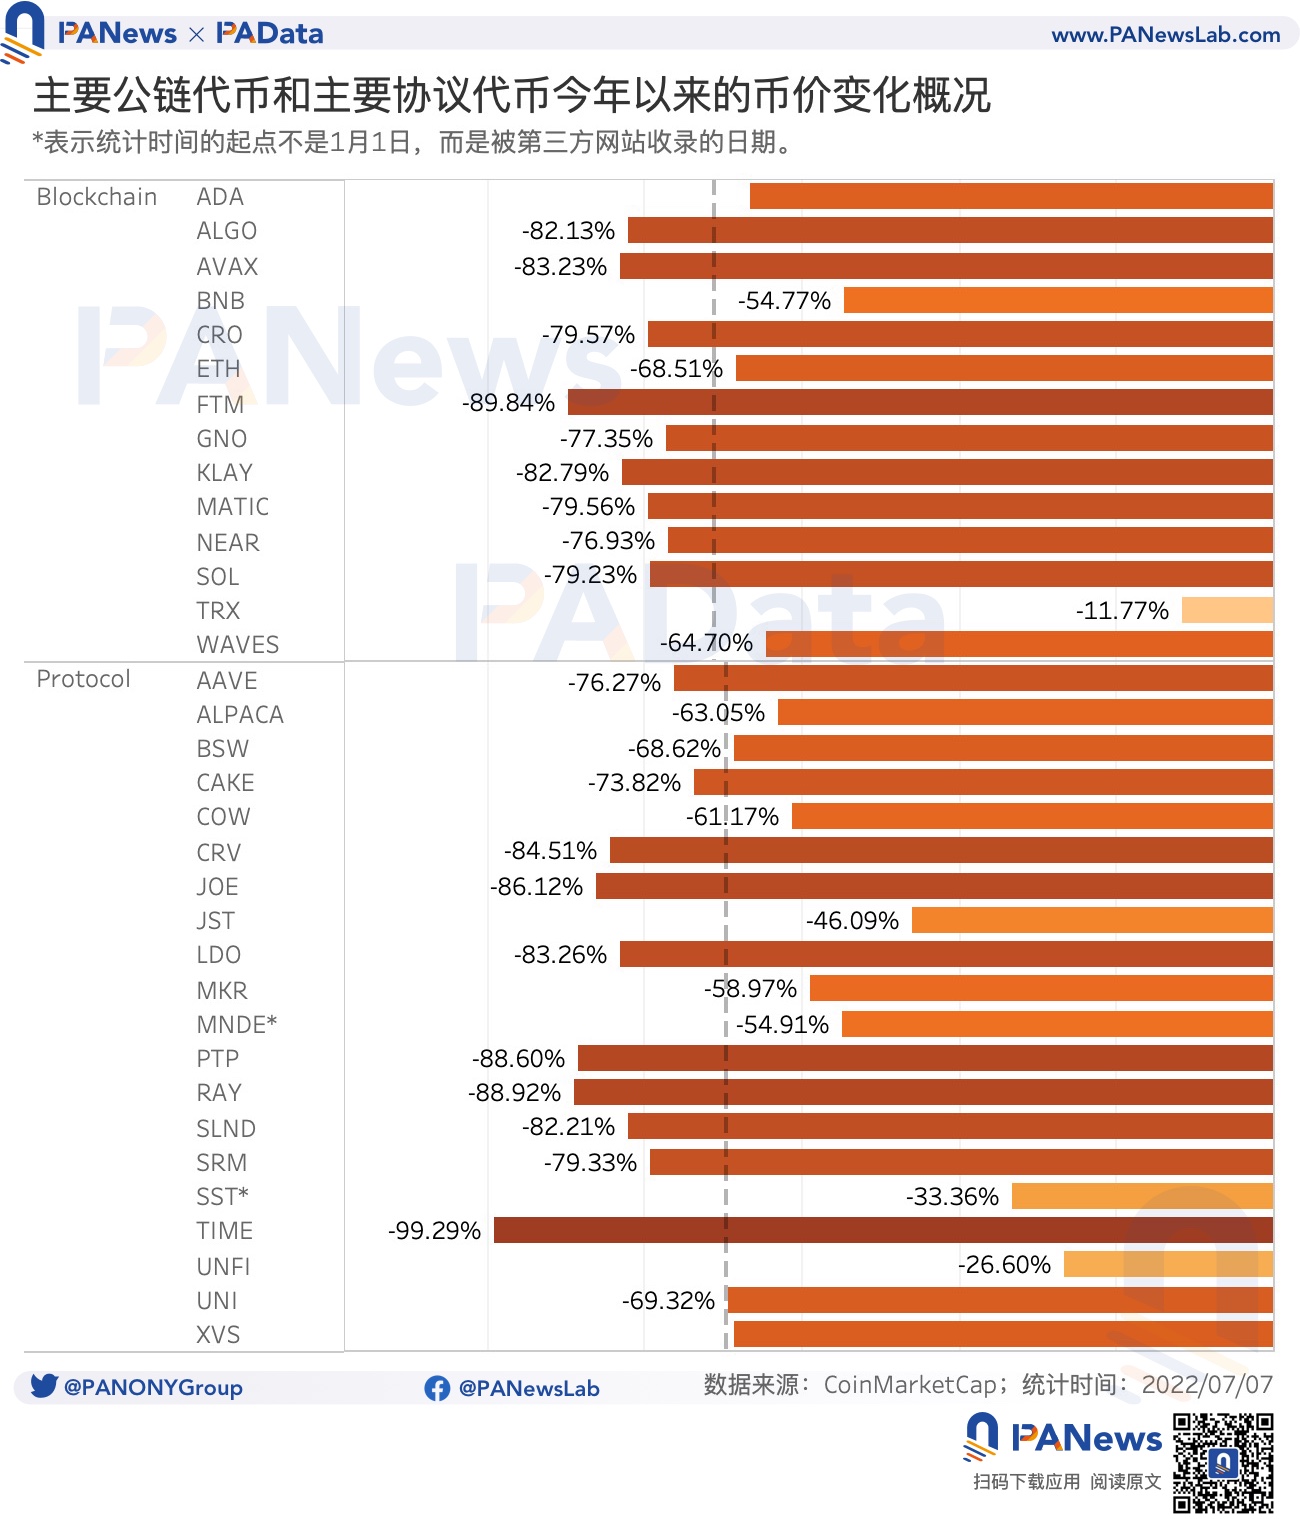
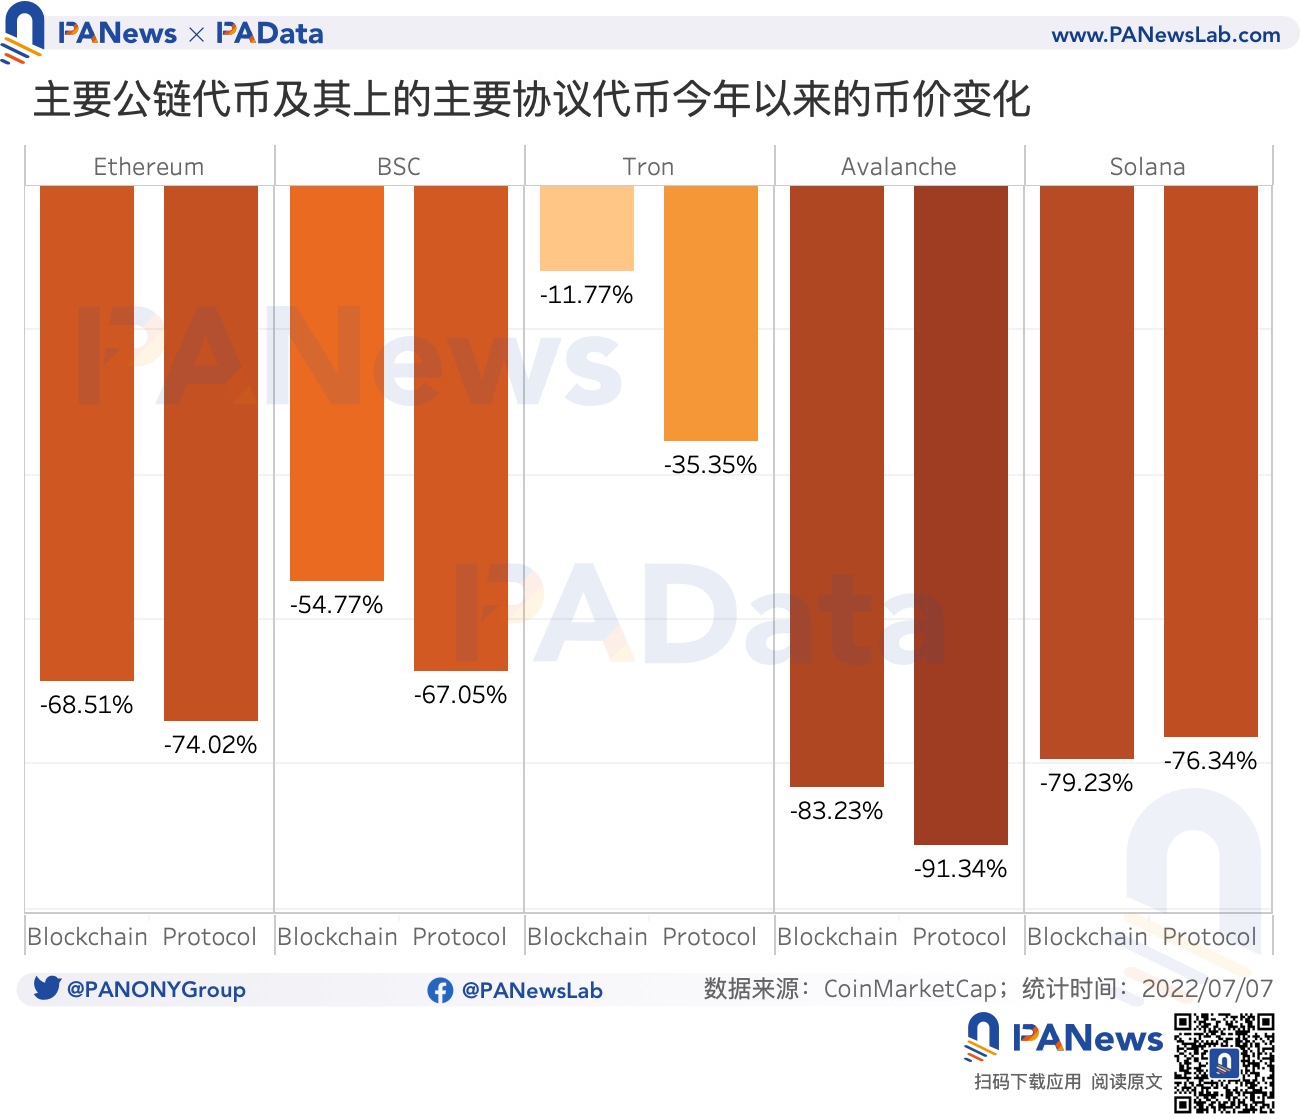
5) However, for the five public chains with the highest lock-up volume, the price declines of the public chain tokens ETH, BNB, TRX and AVAX in the first half of the year were all smaller than the average price decline of the leading protocols on their public chains , perform better.
01
6) The average maximum theoretical return of the 14 public chain tokens is about 8.75%, and the average minimum theoretical return is about -82.05%. The average maximum theoretical return of the 20 protocol tokens is approximately 15.16%, and the average minimum theoretical return is approximately -79.57%. Generally speaking, both have more room for loss and less room for profit. However, compared with public chain tokens, the profit margin of protocol tokens is nearly 7 percentage points more, while the loss margin is slightly smaller by 2 percentage points, and the potential income performance is better.
first level title
first level title
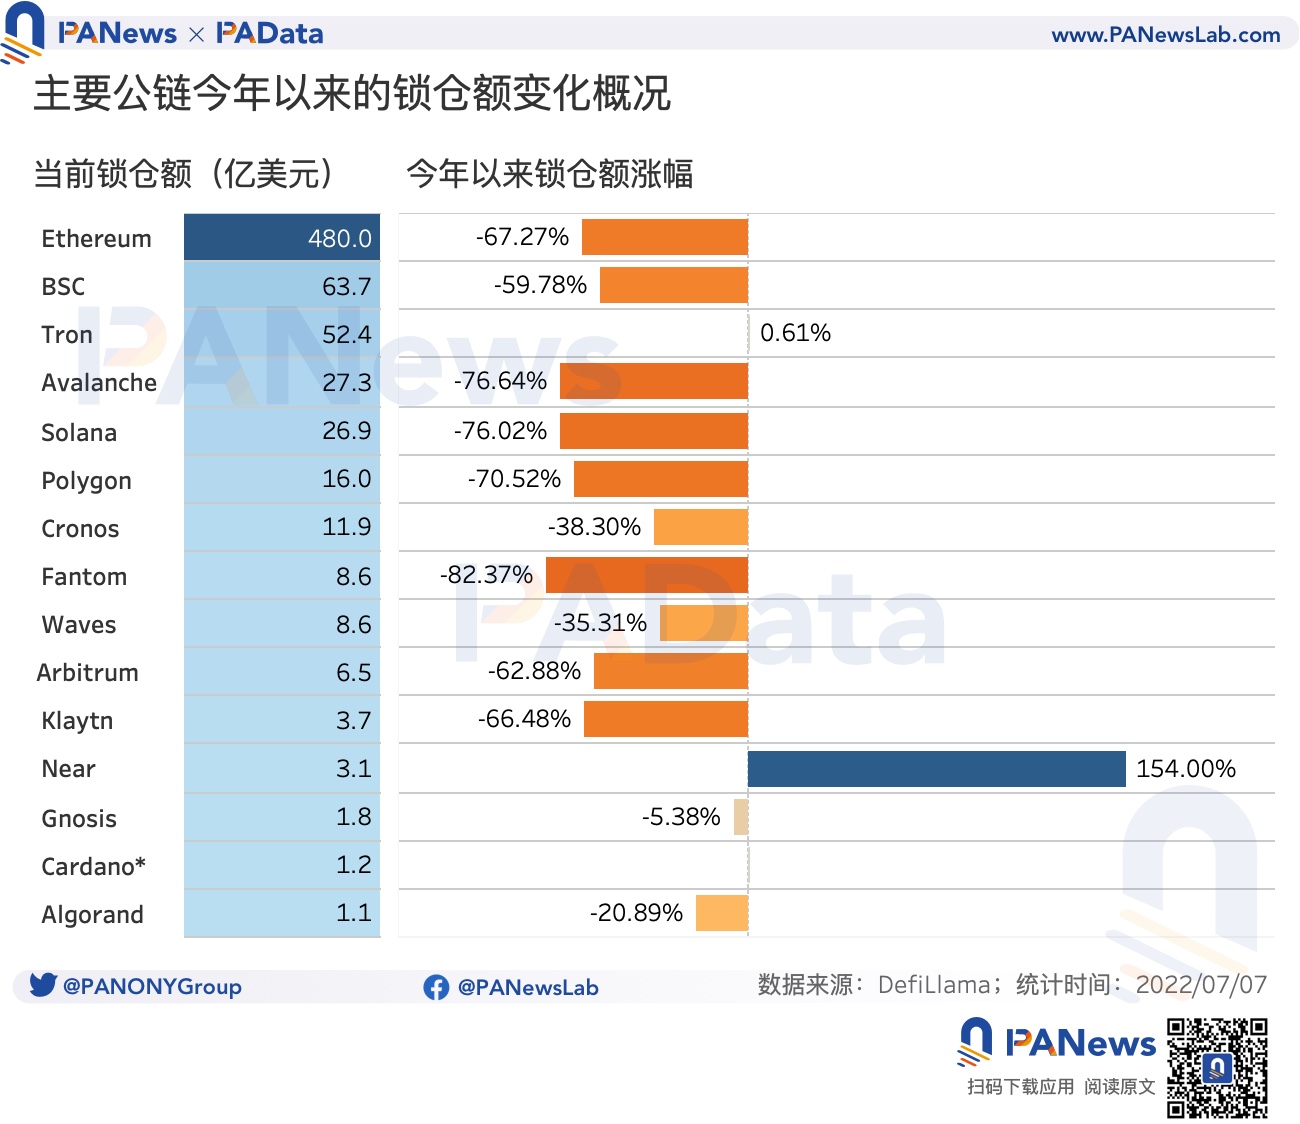
Currently, Ethereum, BSC, Tron, Avalanche, Solana, Polygon, Cronos, Fantom, Waves, Arbitrum, Klaytn, Near, Gnosis, Cardano, and Algorand are the leading public chains with relatively high lockup volume and good development. Among them, Ethereum has the highest lock-up amount, reaching 48 billion US dollars, far exceeding other public chains. Secondly, BSC and Tron have relatively high lock-up volumes, about US$6.37 billion and US$5.24 billion respectively. In addition, the locked positions of Avalanche, Solana, Polygon, and Cronos all exceeded $1 billion.
However, the lock-up amount of these top public chains has basically dropped significantly this year. For example, the lock-up amount of Ethereum has dropped by more than 67% this year, and the lock-up amount of Avalanche, Solana, Polygon, and Fantom has all dropped by more than 70% this year. Tron, Cardano, and Near are the few public chains whose locked positions have increased this year. Among them, Tron’s locked-up amount rose slightly by less than 1%, basically unchanged, while Near’s locked-up amount increased by 154%, an obvious increase. The highest increase is Cardano, whose lock-up volume has increased by as much as 6475% since January 9 this year. Although this is due to the fact that Cardano has just started ecological construction and has a small base of locked positions, the fact that it can still complete a cold start under the downward trend of the market also shows that its development momentum is good.
From the perspective of the market share of the public chain, in the first half of the year, Ethereum’s lock-up amount accounted for an average of 59.12% of the total lock-up amount, ranking first. Followed by BSC, Avalanche and Solana, the average lock-up accounted for about 6.68%, 4.73% and 3.67% respectively. The average proportion of locked positions in other public chains is less than 3%.
From the point of view of the change trend, there are two aspects of data changes worthy of attention. First, from the inside of the selected 15 leading public chains, the lockup amount of the three public chains with the highest lockup amount: Ethereum, BSC and Tron The proportion showed an overall growth trend in the first half of the year, and the increases reached 0.037, 0.015 and 0.035 percentage points respectively, which means that the stock funds are gathered in these three public chains. In addition to this, the rise and fall of the proportion of locked positions of other leading public chains are even smaller, and many public chains with relatively small bases of locked positions have slightly expanded their market share, while some bases of locked positions are relatively large Public chains such as Avalanche, Solana, and Fantom have also lost market share. Second, from the perspective of all public chains, the ratio of the total lock-up amount of the 15 leading public chains to the TVL of all public chains also showed an overall growth trend in the first half of the year, rising from 87% in January to 87% in June. Compared with 94%, it has increased by nearly 7 percentage points, and the increase is more obvious than that of the top public chains, which shows that the stock funds are gathered to a higher degree in these top public chains.
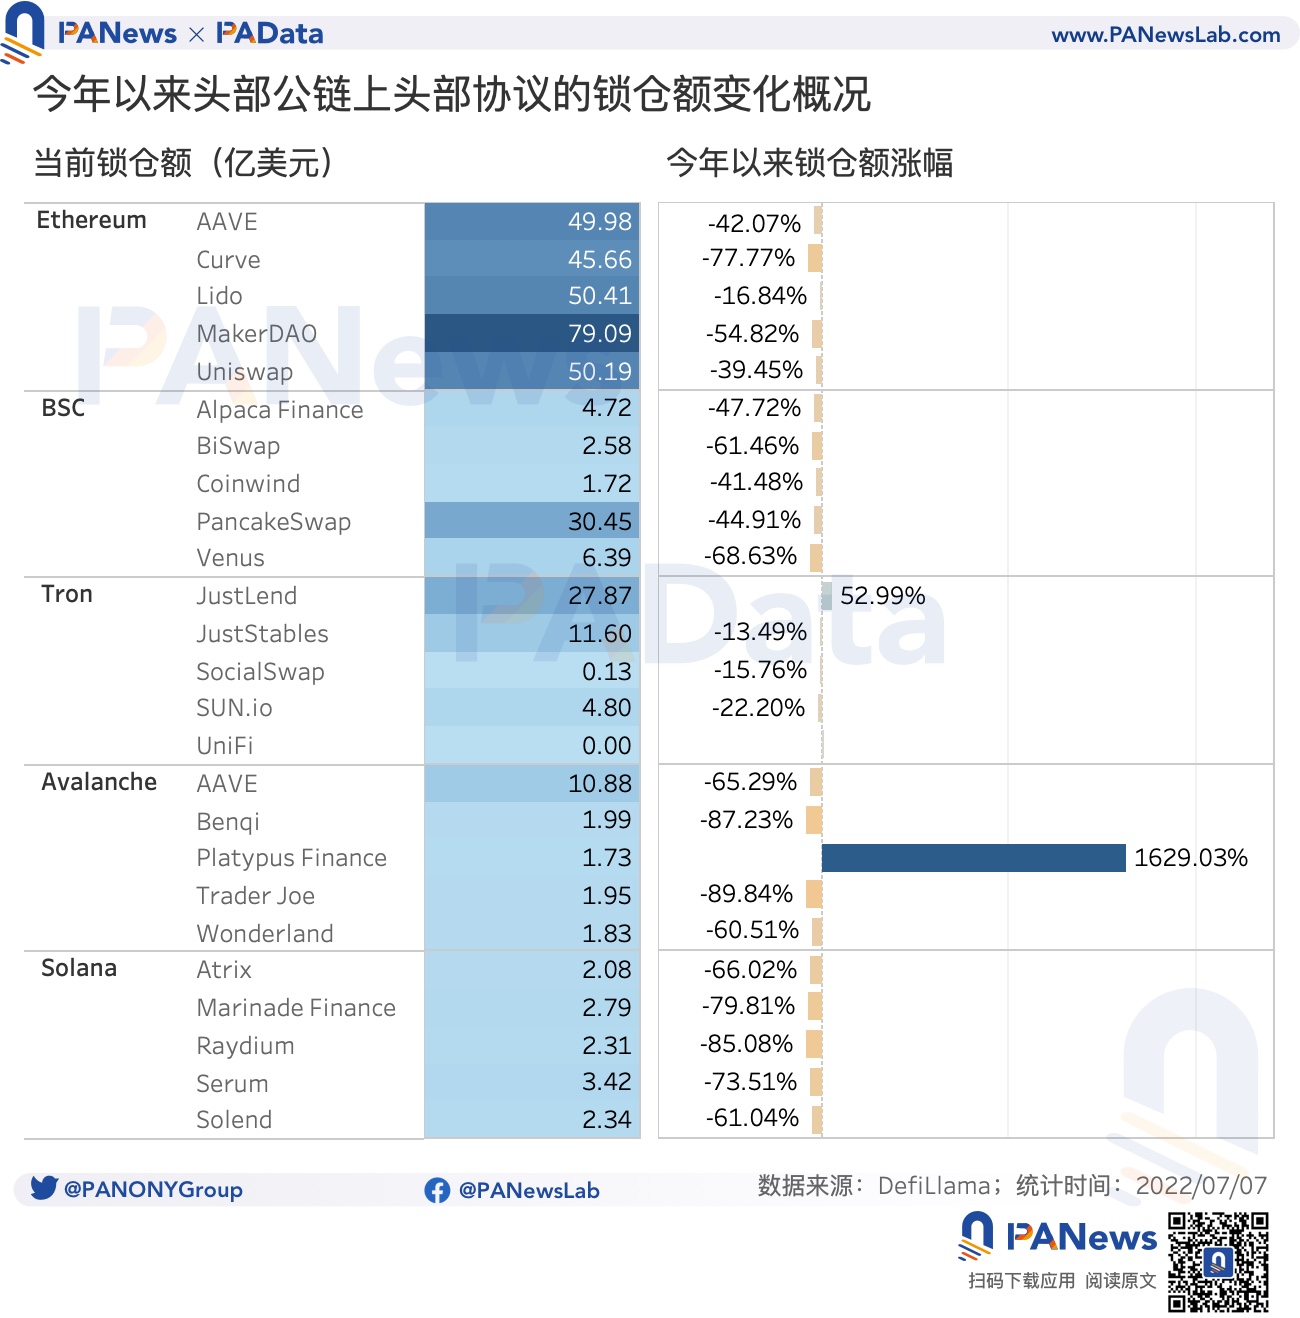
In order to observe the different changes of public chains and protocols, PAData also selected the top 5 protocols with the highest locked positions on Ethereum, BSC, Tron, Avalanche, and Solana for observation. In general, the lock-up amount of the leading protocols on Ethereum has exceeded 5 billion US dollars, of which Maker Dao has exceeded 7.9 billion US dollars, which is much higher than other leading protocols. Secondly, the locked positions of PancakeSwap on BSC, JustLend and JustStables on Tron, and AAVE on Avalanche all exceeded US$1 billion. In addition, the lock-up amount of other leading protocols is basically between 200 and 400 million US dollars. Judging from the changes in locked positions in the first half of the year, except for Platypus Finance on Avalanche and JustLend on Tron, which achieved growth of 1629% and 53% respectively, other leading protocols have "shrunk" to varying degrees. Among them, Curve on Ethereum, Benqi and Trader Joe on Avalanche, and Marinade Finance, Raydium, and Serum on Solana have seen a large decline in the amount of locked positions, all of which have fallen by more than 70%.
02
Data analysis: When the tide recedes, which of the 15 leading public chains and ecological protocols will perform best?
first level title
The average decline of protocol tokens is smaller than that of public chain tokens, but the performance of the five major public chain tokens is even greater
Data analysis: When the tide recedes, which of the 15 leading public chains and ecological protocols will perform best?
Data analysis: When the tide recedes, which of the 15 leading public chains and ecological protocols will perform best?
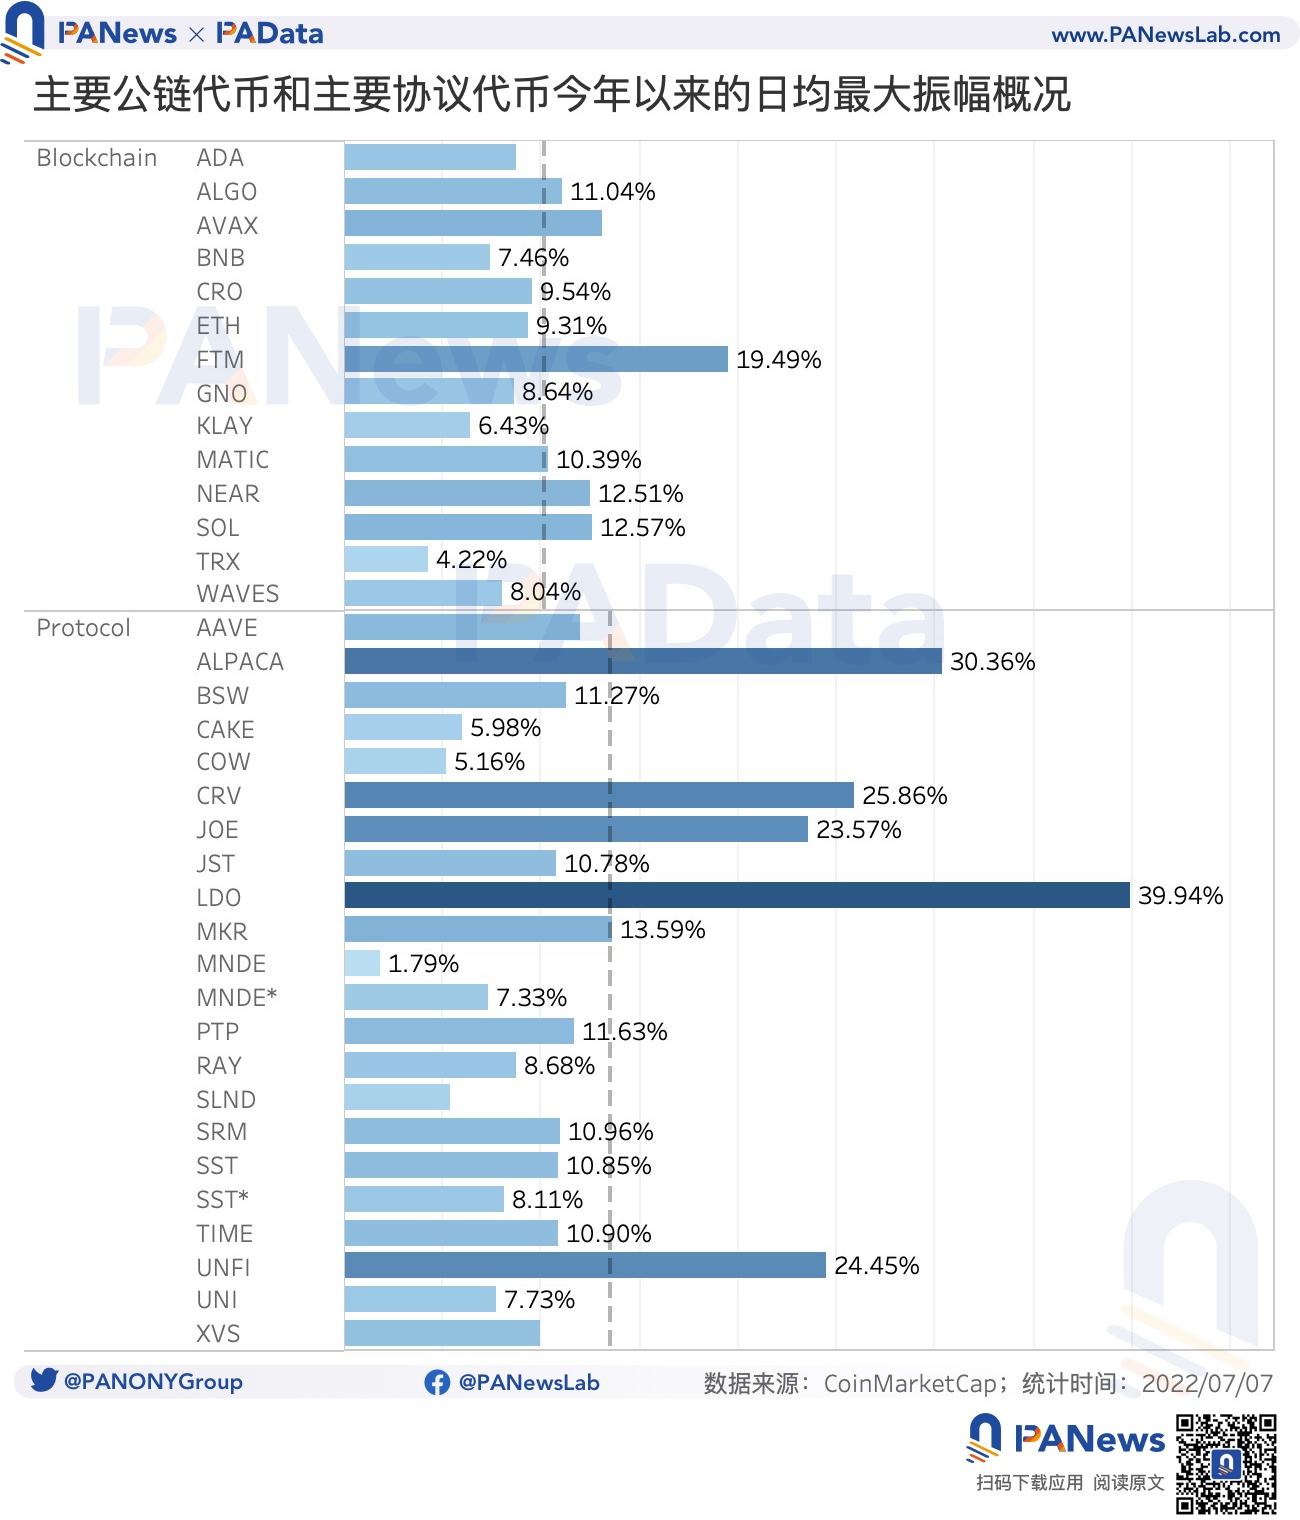
Generally speaking, the decline of protocol tokens in the first half of the year was slightly smaller than that of public chain tokens, but the maximum daily amplitude of protocol tokens was significantly greater than that of public chain tokens. According to statistics, the maximum daily amplitude of the 20 protocol tokens is about 13.46%, and that of the 14 public chain tokens is about 10.11%. Among the protocol tokens, ALPACA, CRV, LDO, and UNFI have the largest daily average fluctuation of more than 25%, and the highest LDO reaches nearly 40%. Among the public chain tokens, FTM, NEAR, and SOL have the largest daily fluctuation of more than 12%, and the highest FTM reaches about 19%.