
Looking back at the history of "rate hikes and balance sheet reduction" cycles, we may have overestimated their real impact on the market

foreword
foreword
To study and judge the trend of the digital currency market in the first quarter, at a relatively sensitive stage, the degree of tightness of the US monetary policy, such words as debt reduction, interest rate hike, balance sheet reduction, and inflation are closely affecting the nerves of investors. Emerging markets in the past year will inevitably be affected.
First of all, against the background of ample funds, the U.S. stock market has given birth to super bulls, exceeding the expectations of most investors. The source of funds is mainly the monetary policy of the Federal Reserve. Cutting interest rates, expanding and raising interest rates, and shrinking balance sheets will directly affect the degree of liquidity adequacy. Therefore, this macro analysis interprets economic data such as non-farm payrolls and the impact of the Federal Reserve’s monetary policy on the market in history. , Review the Taper and interest rate hike cycle in 2013, the analysis of the balance sheet shrinkage cycle, how inflation is transmitted to US stocks, the Federal Reserve interest rate resolution and the analysis of meeting minutes to find out the laws and draw objective conclusions.
Secondly, return to the market itself, its own structural trends (volume, price, time, and space), whale positions on the BTC chain, changes in the number of whales, exchange balances, stable currency supply ratios, unrealized net profit and loss ratios on the chain, and illiquid Changes in permanent supply, total circulating supply held by long-term holders and other on-chain data, futures and options positions, etc., in order to objectively reflect the real market trend, formulate a reasonable trading plan, and calmly respond to the actual trend.
The pre-judgment is only a pre-study and judgment made under the known conditions at the moment. In the later stage, the actual trend of the market should be closely followed to make timely corrections and adjustments. Risk control should also be done in response to risk events and doubts in the heart, as well as small-probability trends in the plan.
1. Macroeconomic Analysis
1. Interpretation of the US economy
In 2022, the market seems to have a bad start to the year, and overseas stock and debt assets have fluctuated significantly, presenting a double-kill situation. On the one hand, the spread of the epidemic continues, but the economy has eased somewhat. The minutes of the Federal Reserve’s December FOMC interest rate meeting aroused market concerns about the Fed’s excessive tightening, and ADP and non-agricultural employment data also strengthened this expectation to a certain extent.
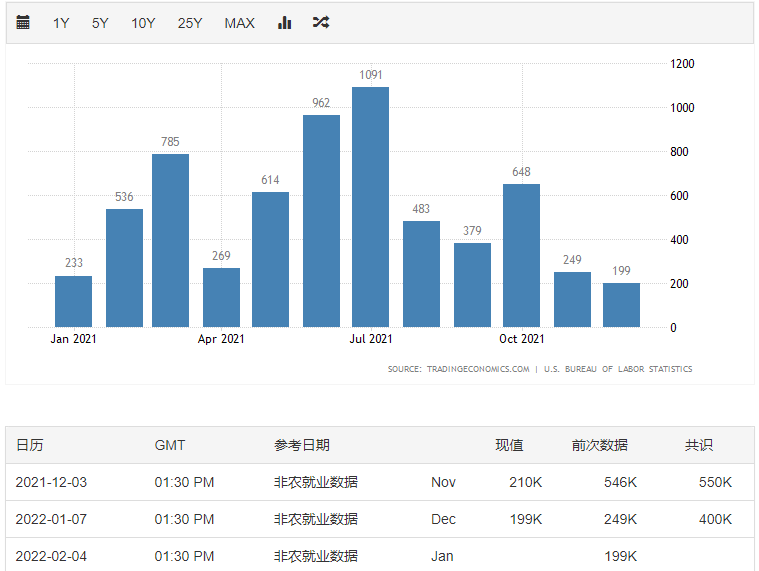
text"The U.S. non-farm payrolls in December were mixed, and expectations for a rate hike by the Federal Reserve in March have risen. Non-farm payrolls were a surprise, unexpectedly recording 199,000, significantly lower than expected. However, the unemployment rate data continued to improve, and the market still expects the Fed to raise interest rates. Fed funds futures point to a 90% chance the Fed will raise interest rates at its March meeting following the release of the U.S. jobs data."Non-farm employment
. In December 2021, the number of new non-agricultural employment in the United States recorded about 200,000, breaking the smallest increase of 250,000 in November. The labor force participation rate continued to rise to 61.9% in December, but it was still about 1.5 percentage points lower than in February 2020. From the perspective of the reasons for the sluggish labor force participation rate, changes in the age structure of the population can explain about one-third, high unemployment levels can explain about one-fifth, and the remaining half may be related to specific shocks brought about by the epidemic. From this point of view, it is difficult for the labor force participation rate to return to the state before the epidemic. Both indicators, the ratio of unemployed to job vacancies and the resignation rate, continued to decline, pointing to a still tight labor market. The official unemployment rate continued to drop to 3.9% in December, a new low since the outbreak of the epidemic, and the unemployment rate of all calibers also fell simultaneously.
Fed Daly: It may begin to shrink its balance sheet after one or two interest rate hikes. San Francisco Fed President Daly said that he supports gradual interest rate hikes and faster shrinkage this year, and that the Fed may start shrinking its balance sheet after one or two rate hikes. Daly reiterated that inflation is not temporary. U.S. President Joe Biden also said that inflation remains a concern. The former U.S. Treasury Secretary said that the Fed and the market still underestimate the difficulty of fighting inflation. Former U.S. Treasury Secretary Lawrence Summers said policymakers and investors were underestimating what would be needed to keep inflation down, even after the Fed's recent hawkish turn and a fall in U.S. Treasuries.
Figure 1: U.S. non-agricultural employment data for the past year
It is more urgent to control inflation, and an upward spiral may form. Although the employment situation is not optimistic, what is more troubling the United States is the high level of inflation. The actual level of inflation is likely to be comparable to that of the "Great Stagflation" period. If the Fed "ignores" inflation, not only will the high inflation be difficult to reduce, but it will also affect the job market.
First of all, the shadow of the new crown epidemic lingers in the short term, triggering some employment and inflation pressures. The emergence of new strains has greatly reduced vaccine protection, and the booster vaccination rate in the United States is not high. The epidemic has hindered the recovery of employment in the service industry. In December, 157,000 new jobs were created in the service industry, a decrease of 41,000 from the previous month. The supply of labor in the transportation and warehousing industry is still in short supply, which to some extent makes it difficult to alleviate inflationary pressures.
Secondly, the "wage-price" spiral has initially formed, and low-income earners demand higher salary growth. The average hourly wage of non-agricultural employment in December declined year-on-year, but the month-on-month growth rate rose sharply, hitting a new high since April last year, and half of the industry's salary levels rose year-on-year. Among them, the wages of the lowest earners in the United States are growing at the fastest rate since the financial crisis, much higher than that of high earners during the same period. Considering that wage growth has continued to rise in the past six months and price growth has been in sync, a spiral of wage and inflation may have taken shape.
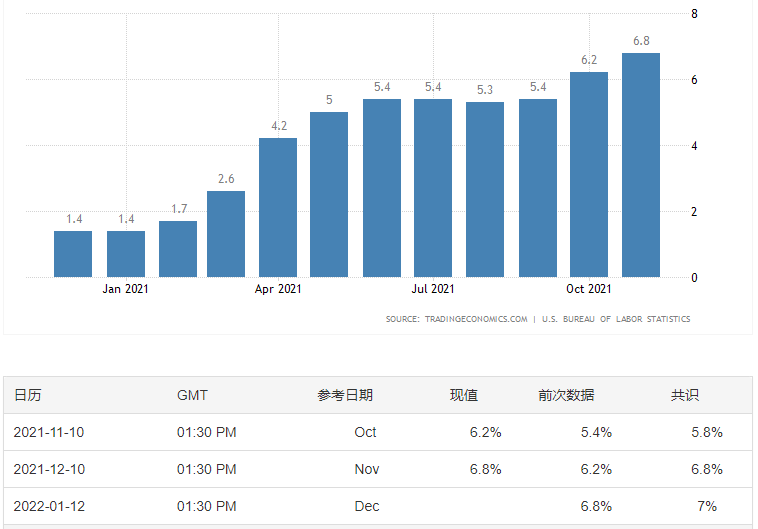
Finally, the actual and even expected upward inflation will itself lead to a further increase in inflation. According to the Business survey, nearly 90% of small businesses plan to raise prices by 15% or more, which is due to the ever-increasing cost burden. Judging from the expectations of various institutions on the level of inflation in the United States, the Fed’s price growth rate may remain high this year, at least at the current high growth rate of 5%-7%.
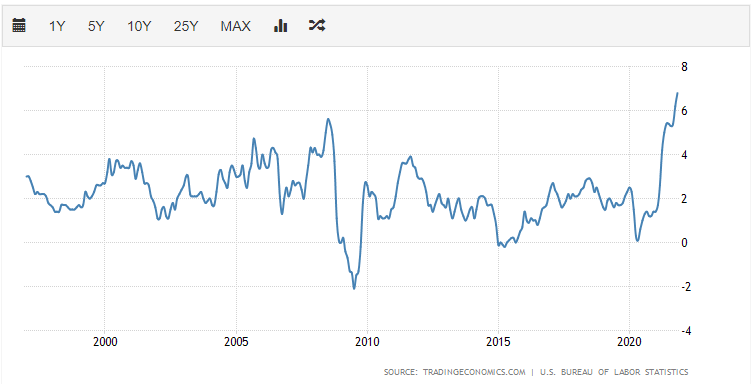
Figure 2: The Inflation Rate of the United States in the Past Year
Figure 3: Inflation Rates in the U.S. over the Past 25 Years
Interest rate hikes are imminent, and we should be vigilant against the risk of tightening. Although U.S. non-farm payrolls fell short of market expectations in December, household surveys showed some improvement in job market performance, while Fed officials’ concerns about inflation have risen significantly, which may make them more inclined to raise interest rates in advance to deal with high inflation. Recent speeches by Fed officials show that most officials support the acceleration of interest rate hikes and are also discussing the timing of shrinking the balance sheet. It is true that raising interest rates or even shrinking balance sheets cannot completely solve the current problem of high inflation in the United States, but on the one hand, it can indeed partially relieve the upward pressure on inflation, and on the other hand, the tightening of monetary policy also has a significant impact on expectations. Regulatory policies can achieve twice the result with half the effort. To achieve this goal, the current high level of inflation can hardly be changed by raising interest rates once or twice. It is expected that the Federal Reserve will raise interest rates several times this year, and the risk of tightening liquidity is worthy of vigilance.
2. Research on historical interest rate hike trend
The market has long expected to raise interest rates in advance, but the balance sheet will even be shrunk during the rate hike process. This strength is completely unexpected by the market. The Nasdaq even fell 3 points that day. However, the U.S. then released non-agricultural data. The U.S. unemployment rate fell to 3.9% in December, the lowest level since the outbreak. The Fed’s forecast for the unemployment rate at the end of 2022 is 3.5%, which seems to have gradually satisfied the Fed’s interest rate hike. Conditions, interest rate hikes may not only be further advanced, and even the intensity will be increased. Traders expect the Fed to announce a 25-basis-point rate hike after its March 15-16 monetary policy meeting has risen to 97.1 percent, according to the CME's FedWatch tool.
Review history. Since 1955, the United States has experienced a total of 13 interest rate hikes. Let’s carefully review the latest three times from 1999 to the present.
(1) The first interest rate hike was from June 1999 to May 2000, when the benchmark interest rate was raised from 4.75% to 6.5%
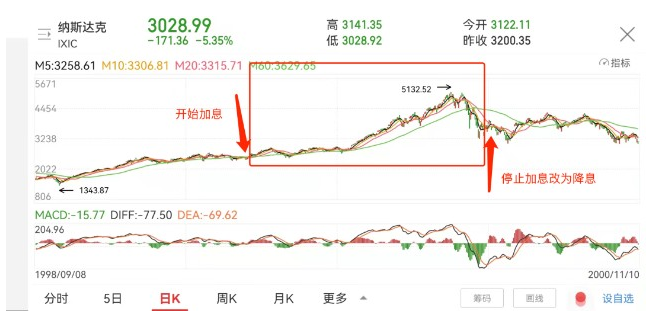
In 1999, GDP grew strongly and the unemployment rate fell to 4%. After the Federal Reserve cut interest rates by 75 basis points in response to the Asian financial crisis, the Internet boom led to growth in IT investment, the economy was overheated, and the Internet bubble was severe. At this time, the Federal Reserve chose to tighten the currency and raised the interest rate from 4.75% to 6.5% after 6 times. After the start of raising interest rates, Nasdaq continued to rise, and even doubled during the rate hike period.
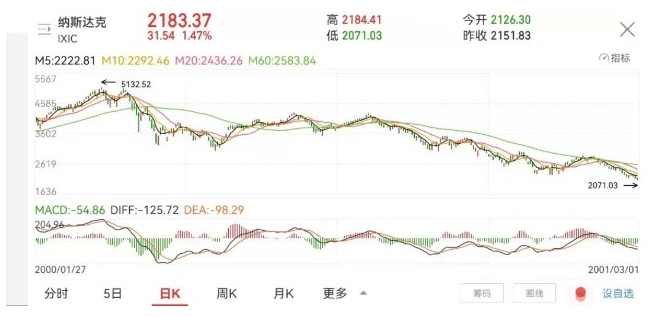
Then, in 2000, the Internet bubble burst and the Nasdaq index collapsed, and the economy fell into recession again. The "911 incident" made the economy and the stock market worse. However, it can be seen from the figure below that the interest rate cut failed to save the US stock market. The US stock market continued to fluctuate and fell for more than two years. The Nasdaq fell from a maximum of more than 5100 points to more than 1100 points.....
It can be seen that raising interest rates does not necessarily cause the stock market to fall, and cutting interest rates does not necessarily cause the stock market to rise.
(2) The second rate hike occurred from June 2004 to June 2006, when the benchmark interest rate was raised from 1% to 5.25%
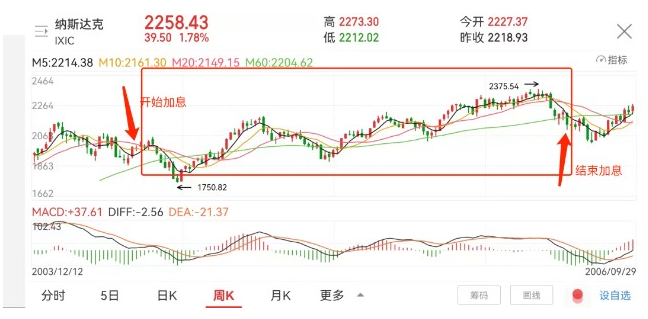
At that time, the housing market bubble was serious, and the previous continuous and sharp interest rate cuts led to a serious real estate bubble in the United States. The U.S. economy began to recover in the second half of 2003, and the rapid rise in demand drove up inflation and core inflation. In 2004, the Federal Reserve began to tighten policy, raising interest rates by 25 basis points for 17 consecutive times, reaching 5.25% in June 2006. In the process of raising interest rates for two years, Nasdaq is still in a state of shock and upward, as shown in the red box in the figure below.
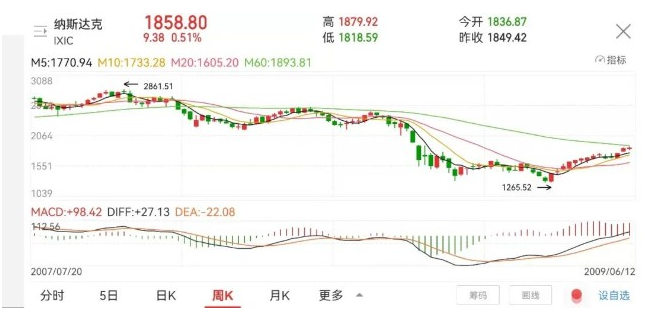
Until the outbreak of the subprime mortgage crisis triggered a global financial crisis, the Federal Reserve began to cut interest rates again, even to a level close to zero. The subprime mortgage crisis first appeared in 2006, and began to sweep the United States in August 2007. Even if the Federal Reserve continued to cut interest rates, it did not quickly rescue the US stock market. It was only in March 2009 that Nasdaq began to bottom out.
(3) The third interest rate hike occurred from December 2015 to December 2018, and the benchmark interest rate was raised from 0.125% to 2.375%
US stocks are still in a volatile upward pattern.
Through reviewing the experience of the three interest rate hikes since 1999, it can be seen that the U.S. stocks have not fallen during the interest rate hike cycle, on the contrary, the gains have not been small. Therefore, we can roughly draw a preliminary conclusion that the rise or fall does not depend on whether the interest rate is raised or not, and the rate increase does not necessarily mean that it will fall, and the rate cut does not mean that it will definitely rise. Raising interest rates will not be the biggest factor in the U.S. stock market's slump and slump.
3. Review the 2013 Taper and interest rate hike cycle
Review the trends of interest rates and interest rate spreads in the last Taper cycle, before the rate hike cycle, the rate hike cycle, and from the stop of the rate hike to the rate cut cycle:
(1) Taper period (2013.04-2014.10): Taper has a relatively small impact on short-term interest rates and has a greater impact on long-term interest rates. During this period, it rose from 0.25% to 0.50% in 2 years, and the uplink was about 25bps. The long-term price rose from 1.6% to 3.0% in 10 years, and then fell back slightly to 2.2%, with an overall increase of about 60bps. The sharp rise in long-term U.S. bond interest rates in 2013 was mainly due to the Taper panic, which was also due to the lack of communication between the Fed and the market at the time. This round of Taper has a moderate impact on the overall interest rate curve.
(2) Before the interest rate hike cycle (2014.10-2015.12), during the period, due to the greater risk of deflation by the Federal Reserve, the long-term interest rate trend was weak, fluctuating between 1.5% and 2.5%, but the short-term interest rate continued to rise, from 0.5% to 1.0 %, the U.S. bond curve spread continued to fall from 185bps to 124bps. Before the rate hike cycle, short-term interest rates will rise more than long-term interest rates, and the interest rate curve will flatten.
(3) In the interest rate hike cycle (2015.12-2018.12), 2015, 2016, 2017 and 2018 raised interest rates 1, 1, 3 and 4 times respectively, and the pace of interest rate hikes accelerated. During this period, several major events took place, such as Brexit in mid-2016, Trump’s election at the end of 2016, the Federal Reserve’s balance sheet reduction in October 2017, and the trade dispute between China and the United States in March 2018. Rate hikes tend to be slow in the first half of the rate hike cycle, and faster in the second half of the year. During the interest rate hike cycle, the U.S. bond interest rate curve further flattened, and the interest rate spread continued to decline.
(4) After the interest rate hike cycle (2018.12-2019.12), the rate hike stopped, the economic growth rate declined, and factors such as China and the United States affected the U.S. bond yield to drop sharply. After the rate hike cycle, interest rates fell sharply and spreads rose.
(5) During the period of the new crown virus (2019.12-present), inflation trading (Inflationtrade). With the outbreak of the new crown virus, the Federal Reserve quickly cut interest rates to 0. However, during the outbreak of the new crown virus, global inflation was high, and short-term interest rates remained near 0. Long-term interest rates continued to expand to 150bps as inflation trades (Inflationtrade) rose.
The Fed's interest rate hike does not necessarily lead to a decline in the stock market. For example, US stocks have risen at the beginning of the past several rounds of interest rate hike cycles. Of course, history is not always the correct answer. Behind the rise of US stocks at the beginning of the past few interest rate hike cycles, the US economic growth has improved and inflation has risen moderately. But if a rate hike is forced because inflation is too high, that could be bad for markets. The current situation seems to be more like the latter. The high CPI inflation in the United States "forced" the Fed to take action, while the Omicron epidemic is still spreading, and the uncertainty of the global economic growth outlook has increased.
4. Periodic analysis of contraction
The so-called shrinking balance sheet refers to reducing the size of securities held by the Federal Reserve (treasury bonds and MBS, etc.). From the perspective of impact logic, compared with interest rate hikes, balance sheet reduction is more of a reduction in the amount of bond assets held (not renewing at maturity or selling them directly), so from the perspective of supply and demand, the impact on the reduced bond holdings In the short term, it will be bigger. The current asset scale of the Federal Reserve is 8.77 trillion U.S. dollars, the Fed holds 5.66 trillion U.S. dollars in treasury bonds, and the long-term (5-10-year and above) scale is 2.37 trillion U.S. dollars, accounting for about 42.0%.
Whether it is reduction, interest rate increase or balance sheet shrinkage, there is a process from anticipation brewing, to full accounting, to actual implementation. Although the specific operations and implementation strategies of the above three monetary policy normalizations are different, they all affect asset prices through expectations during the anticipation stage, especially when there are surprises. Therefore, when there is still a certain distance from the real shrinkage of the balance sheet, more attention should be paid to the expectation of "panic" rather than what caused the panic. Therefore, the "decrease panic" in May 2013 from the market and assets The response mode may be more informative; after the formal shrinkage of the balance sheet begins, you can refer to the shrinkage of the balance sheet in 2017 to examine its actual impact.
Referring to the experience in 2013, during the most panic stage, the interest rate of U.S. bonds also rose rapidly and was dominated by real interest rates. The world's major assets were generally under pressure, especially Bitcoin and some emerging markets (such as Brazil, Hong Kong stocks, A shares) fell At the same time, commodities such as gold and copper also generally retreated. In contrast, safe-haven assets such as the yen and Japanese government bonds performed better. However, the overall decline in the U.S. stock market was not large at that time, and growth stocks such as Nasdaq and ChiNext were still relatively ahead. After the panic phase passed, U.S. bond interest rates fell, major markets generally rebounded and repaired, growth stocks strengthened sharply, and gold continued to decline.
The panic phase did result in rapid rises in interest rates, market falls, and style rotations, but it did not completely change the trend of the US stock market. The U.S. bond interest rate also went up and then down. After the panic, it fell from 2.7% to 2.5%. It rose again to 3.0% about two months before the official reduction, but when the reduction began at the end of 2013, it peaked and fell. It is in line with the law we suggested, that is, the monetary policy will have a phased effect on interest rates during the expected stage, but once it is implemented, its driving will gradually give way to growth.
The last round of balance sheet reduction occurred in October 2017, about 2 years after the official rate hike in December 2015. Judging from market expectations, the process of shrinking the balance sheet in 2017 is basically in line with expectations. From the perspective of asset performance, the entire process from the release of the balance sheet shrinkage signal in April 2017 to the beginning of balance sheet shrinkage in October, due to sufficient expectations, balance sheet shrinkage has limited effect on changing the asset path, and the deeper level is more dominated by growth factors.
The specific process of shrinking the table is as follows:
text
text
In June 2017, the "quantitative balance sheet reduction" plan was disclosed. On June 14, 2017, the Federal Reserve disclosed the "quantitative balance sheet reduction" plan at the FOMC meeting (that is, the initial monthly reduction of US$6 billion in national debt and US$4 billion in MBS, adjusted every three months), but did not announce the specific Starting time.
In July 2017, it was hinted that the shrinking balance sheet would come soon. On July 26, 2017, the Federal Reserve revised the wording in the statement of the FOMC meeting, giving a signal that can basically be regarded as a very clear shrinkage, and changed the previous wording that the balance sheet shrinkage will start this year to come soon (relatively soon). The market unanimously expected that if nothing unexpected happened, the Federal Reserve would begin shrinking its balance sheet at the FOMC meeting in September of the same year.
In September 2017, the balance sheet was reduced as scheduled. On September 20, 2017, at the FOMC meeting, the Federal Reserve decided to start shrinking its balance sheet from October. The timing, scale, and method were basically not as expected. In terms of the specific method of shrinking the balance sheet, such as the guidelines given at the FOMC meeting in June (Addendum to the Policy Normalization Principles and Plans), the shrinking balance sheet that will be officially launched in October will be: 1) Passive (it will not be renewed when it expires, rather than actively sold 2) Quantitative (the upper limit is set for the size of the balance sheet shrinkage every month, the initial value is 6 billion US dollars of treasury bonds and 4 billion US dollars of MBS per month), 3) predictable (only adjusted every three months; increase of 6 billion US dollars respectively and $4 billion, until 12 months later, when the scale is reduced to $30 billion and $20 billion per month, and remain unchanged).
textFrom the perspective of changes in market expectations, we also refer to the survey of the New York Fed. When the Fed discussed shrinking its balance sheet in March 2017, market institutions had expected it to shrink its balance sheet within the year, but it was not sufficient; Institutions have already fully expected to shrink their balance sheet within the year. Therefore, the process of shrinking the balance sheet in 2017 is basically in line with expectations.Looking back at the whole process from the release of the Fed’s balance sheet shrinking signal in April to October’s start of shrinking its balance sheet in 2017, due to the full expected inclusion, the impact of shrinking the balance sheet on asset prices is relatively limited, but it is more dominated by growth factors.
therefore,text
Whether it is "decrease panic" or "balance sheet shrinkage panic", short-term fluctuations come from the degree of expected inclusion. Once fully included, the real impact may not be great at first.
In general, by comparing the "reduction panic" in 2013 and the actual balance sheet reduction in 2017, we found that the short-term market fluctuations are due to the degree of expected inclusion. Once fully included, the real impact may not be great at the beginning. Therefore, whether it is reduction, interest rate increase or balance sheet reduction, whether it will cause the long-term interest rate to continue to rise and the market to fall, depends more on the environment in which the fundamentals are at that time.
The reduction at the end of 2013, the end of the reduction at the end of 2014, the first interest rate hike at the end of 2015, the start of raising interest rates again in 2016, and the shrinking of the balance sheet at the end of 2017. There were two relatively large fluctuations in the first rate hike at the end of 2015. In fact, if you look carefully, whether it is the trend of U.S. bond interest rates or the stock market fluctuations after the first interest rate hike at that time, it is because the fundamentals (the United States and China) are relatively weak. However, after the U.S. and global growth continued to rise again, interest rates continued to increase in 2017 until the end of 2017, and the overall market remained on an upward trend until the end of the rate hike at the beginning of 2018 and at the end of 2018. After the fundamentals were completely reversed, the U.S. stock market finally reverse.
5. The impact of inflation on US stocks
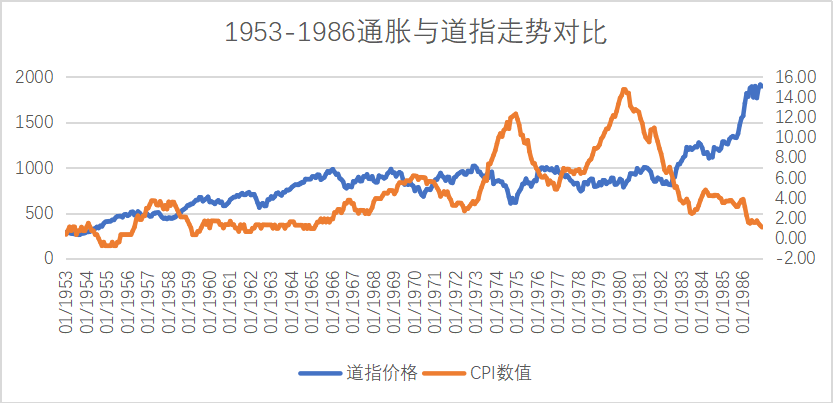
Figure 4: 1953-1986 Inflation vs. Dow
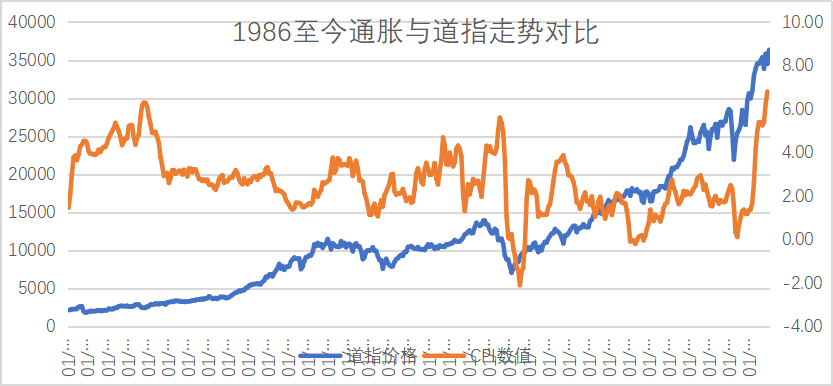
U.S. stocks peaked before inflation; if U.S. stocks rose with inflation for a period of time, the stock market began to fall ahead of inflation, and if it was strong, it would be a consolidation trend; if U.S. stocks fell and inflation continued, then when inflation peaked, the stock market also bottomed out. At present, there is a trend towards hyperinflation. Historically, the stock market has a high probability of going down after the hyperinflation.
Figure 5: Comparison of Inflation and Dow Jones Industrial Average since 1986
6. Federal Reserve interest rate resolution and meeting minutes
January FOMC meeting on January 27:
Interest rate level: Keep interest rates unchanged, and the federal funds rate will be appropriately raised soon;
Voting ratio: The members unanimously agreed to the interest rate decision, which was consistent with the previous meeting;
Economic expectations: Labor force growth has been strong in recent months, and the unemployment rate has fallen sharply;
Inflation expectations: The imbalance between supply and demand leads to high inflation, which is much higher than the 2% target;
Bond purchase guidelines: The pace of debt reduction remains unchanged and will end in early March; long-term treasury bonds will be held;
text
Balance sheet reduction plan: the balance sheet will be reduced only after raising interest rates, and will be carried out through reinvestment.Powell press conference:
Policy position:text
Rate hike pace:text
Reduced balance sheet plan:text
Interest Rate Inflation:text
job market:text
The 2-10 year yield spread is within the trend range, monitored but not controlled.
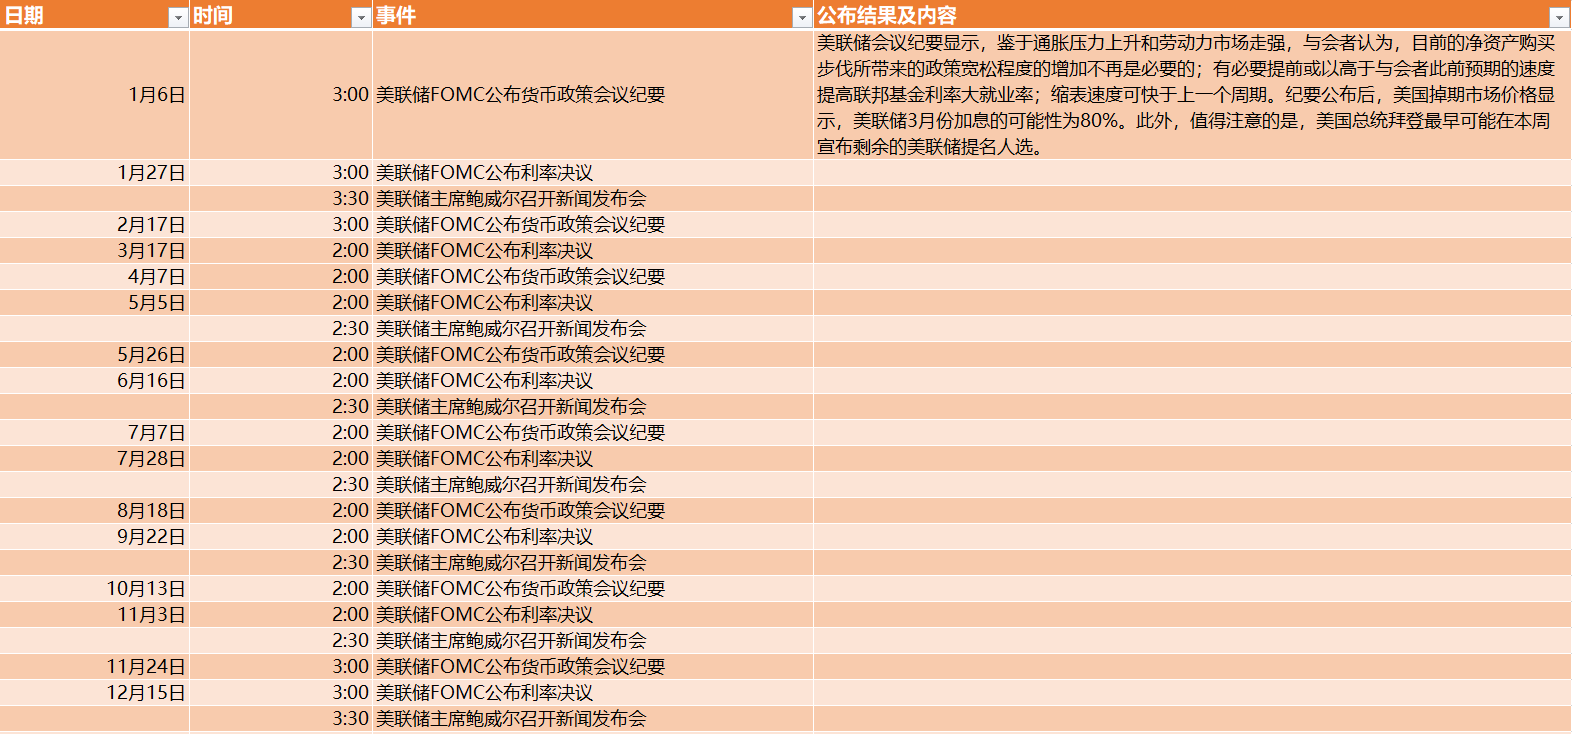
According to CME "Fed Watch": The probability of the Fed maintaining interest rates in the range of 0%-0.25% in March is 0%, the probability of raising interest rates by 25 basis points is 87.6%, and the probability of raising interest rates by 50 basis points is 12.4%; The probability of interest rates in the range of 0%-0.25% is 0%, the probability of raising interest rates by 25 basis points is 31.4%, the probability of raising interest rates by 50 basis points is 60.7%, and the probability of raising interest rates by 75 basis points is 7.9%.
Table 1: 2022 Federal Reserve interest rate resolution and meeting minutes
7. Conclusion
Monetary policy will affect the rhythm of the market, but it cannot change the trend. Through the analysis of the history of US debt reduction, interest rate hikes, and balance sheet reduction, it is highly probable that it will rise during the period of debt reduction to the beginning of interest rate hikes. But after careful study, it can be seen that its rise is based on the background of good economic growth in the United States or a strong recovery, and a moderate rise in inflation. A good economy can also make up for the impact of the contraction of market liquidity. If the company continues to improve, the company will have the source and motivation for sustainable development, and the stock market will naturally prosper if the company continues to improve. But this time, the Fed chose to be forced to raise interest rates against the background of economic stagflation. Can the economy usher in a rapid recovery under such conditions? Compared with history, how many times has the stock market been able to maintain a strong upward cycle under high inflation? Of course, whether it is "decrease panic" or "balance sheet shrinkage panic", the short-term fluctuations come from the degree of expected inclusion. Once fully included and digested by the market, the real impact may not be great at first.
Responding to the digital currency market, because in recent years, the correlation with the US stock market is relatively strong, but the trend is more sensitive, and it often peaks before the US stock market, because the digital currency led by BTC has fallen for nearly 3 months and has been adjusted by 50%. Even if there is a re-intensification of the expectation of shrinking the balance sheet within the year, the impact on the digital currency market will be limited, because most of it has been digested and will be dragged down, but after a short drag, it will go at its own pace, so analyze BTC, etc. The market itself may be more meaningful.
2. Research and judgment of BTC market outlook
1. The number of whales on the chain
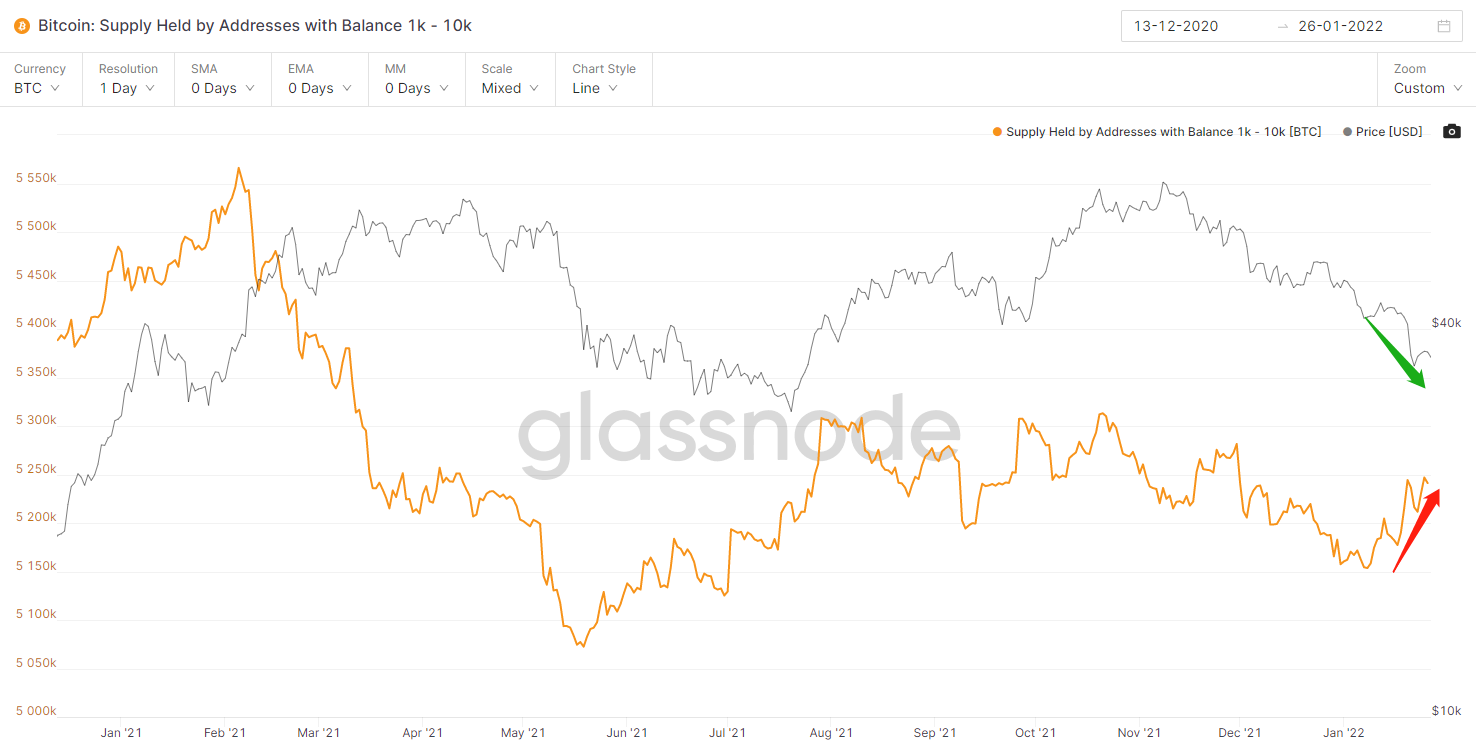
The price is falling, and the positions of 1K-10K whales are increasing, indicating that the main force is slowly accumulating funds.
Figure 6: The number of whales and the price trend of BTC
2. Exchange balance
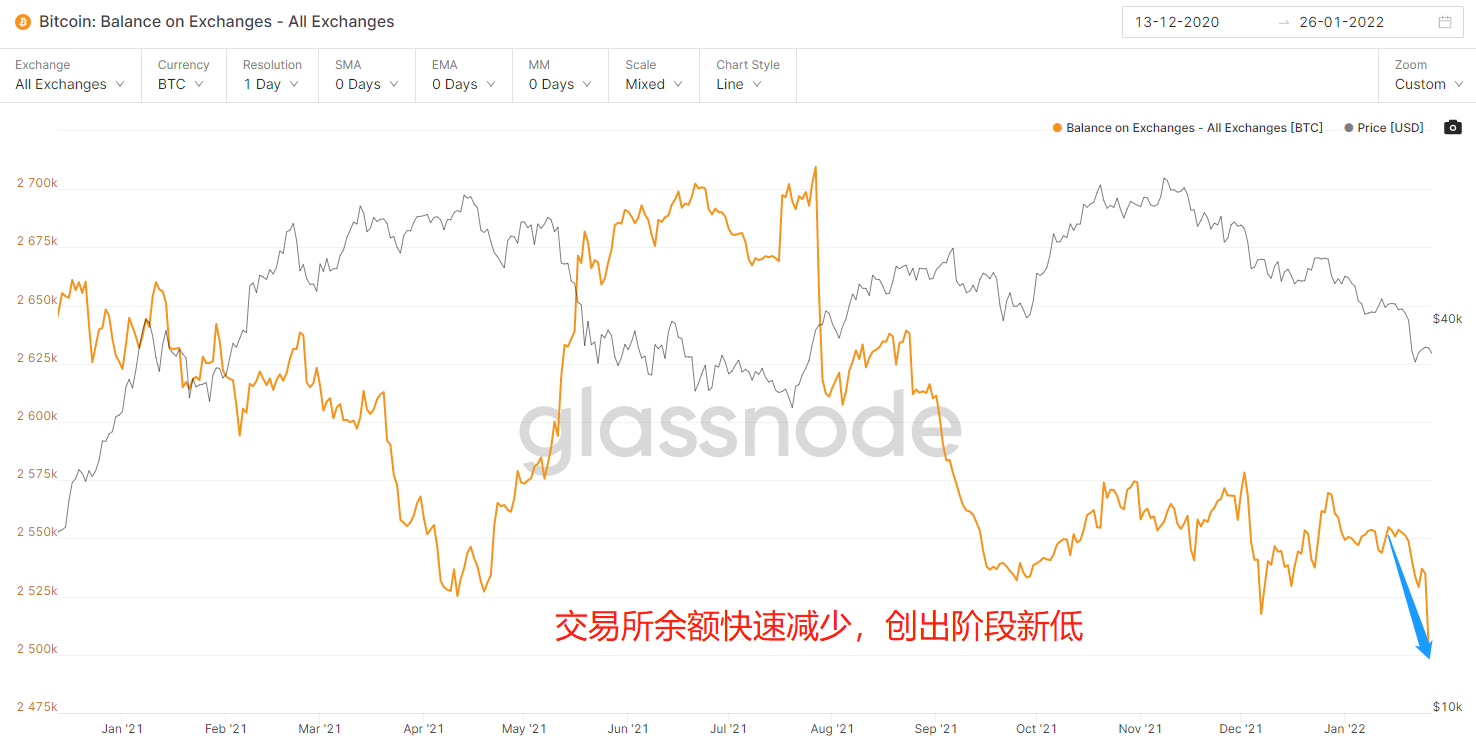
In the past year, every rapid increase in the balance of the exchange is accompanied by the occurrence of smashing. On the one hand, it is the real transfer of the wallet address to the exchange for selling; on the other hand, after the transfer to the exchange, there is no The smashing of the market also caused short-term panic selling. The balance of the exchange has recently decreased rapidly, hitting a new low in the stage, and the selling momentum has decreased.
Figure 7: Exchange balance and BTC price trend
3. Stablecoin Supply Ratio (SSR)
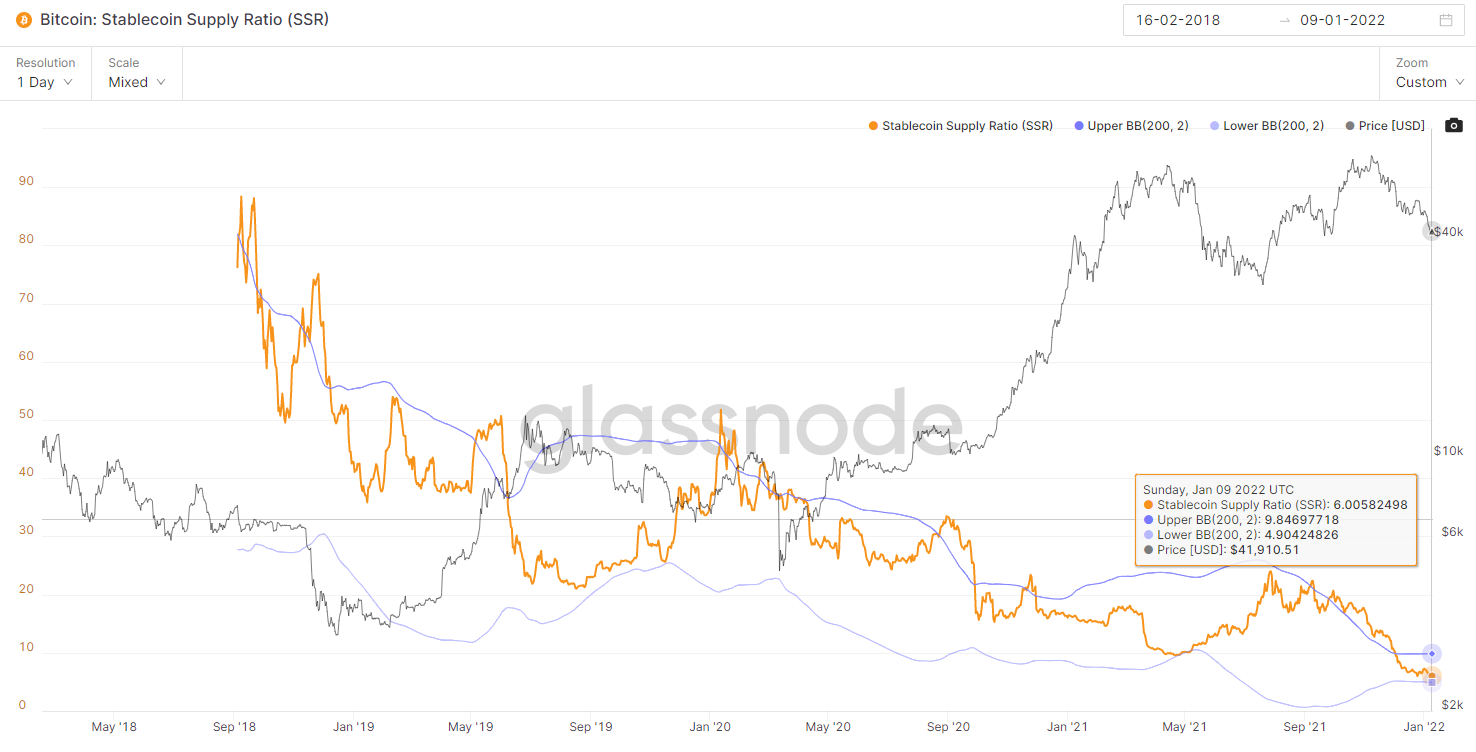
image description
4、Entity-AdjustedNUPL
secondary title
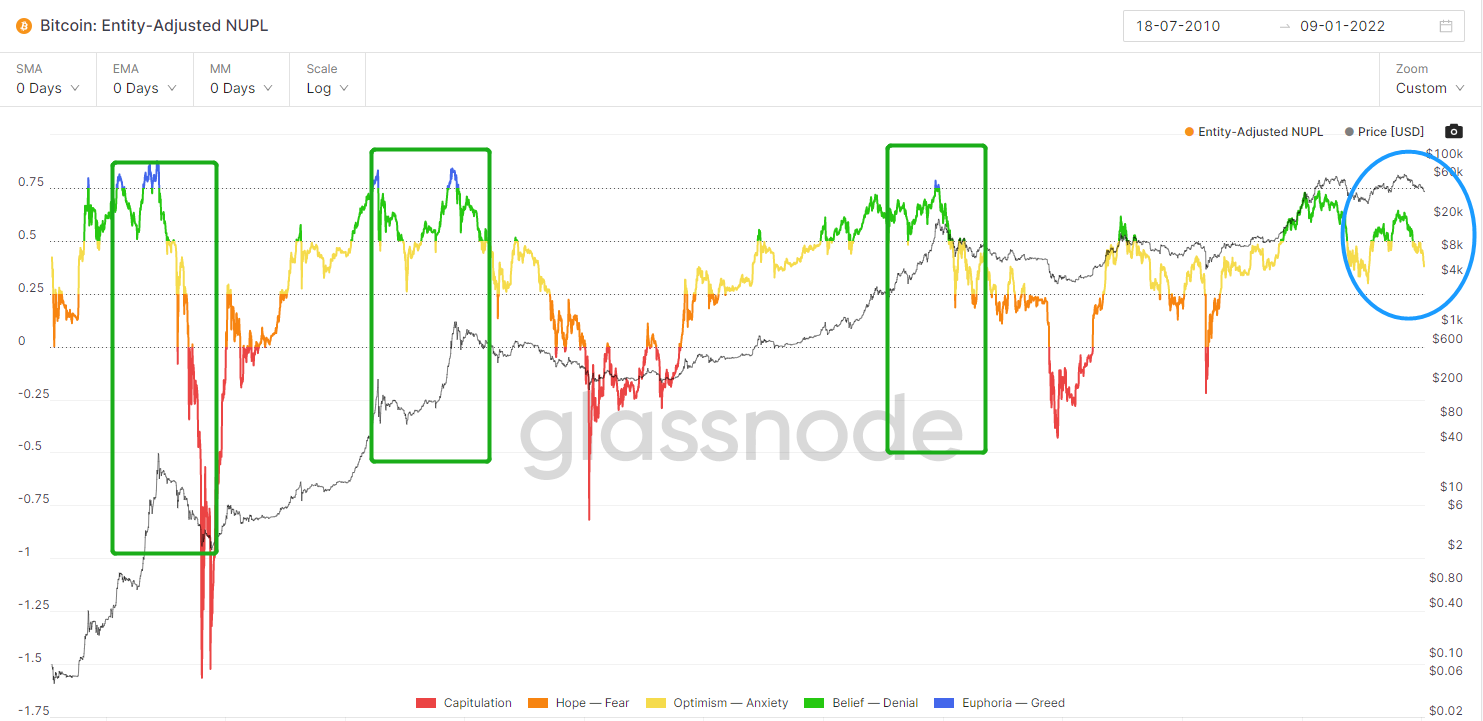
The net profit-loss ratio on the chain has not been realized. Historically, every round of big tops, this indicator will enter above 0.75. But this time it went down before reaching this value. On the one hand, it shows that the current round of rising market is weak, and it turned down before it rose to the overbought zone; Haven't seen the top yet.
Figure 9: Comparison of Entity-AdjustedNUPL and BTC price trends
5. Futures open interest
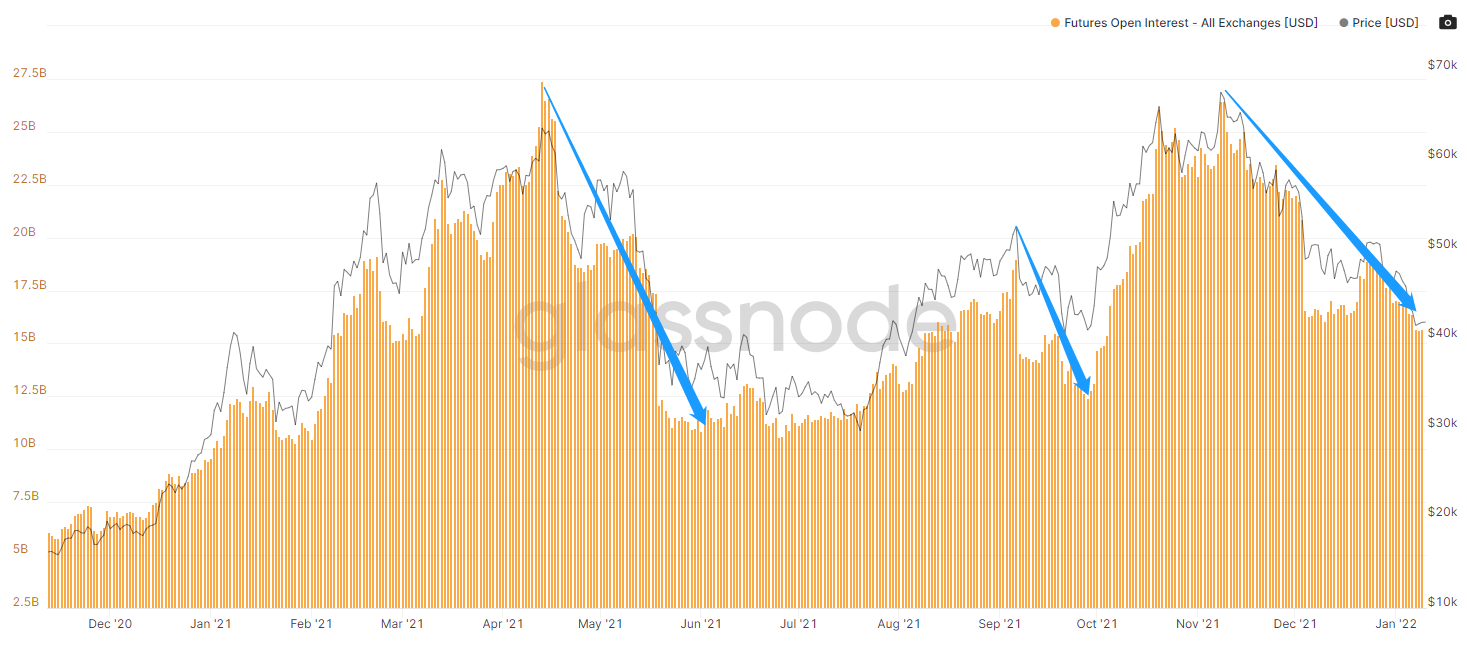
image description
6、MVRVZ-Score:
secondary title
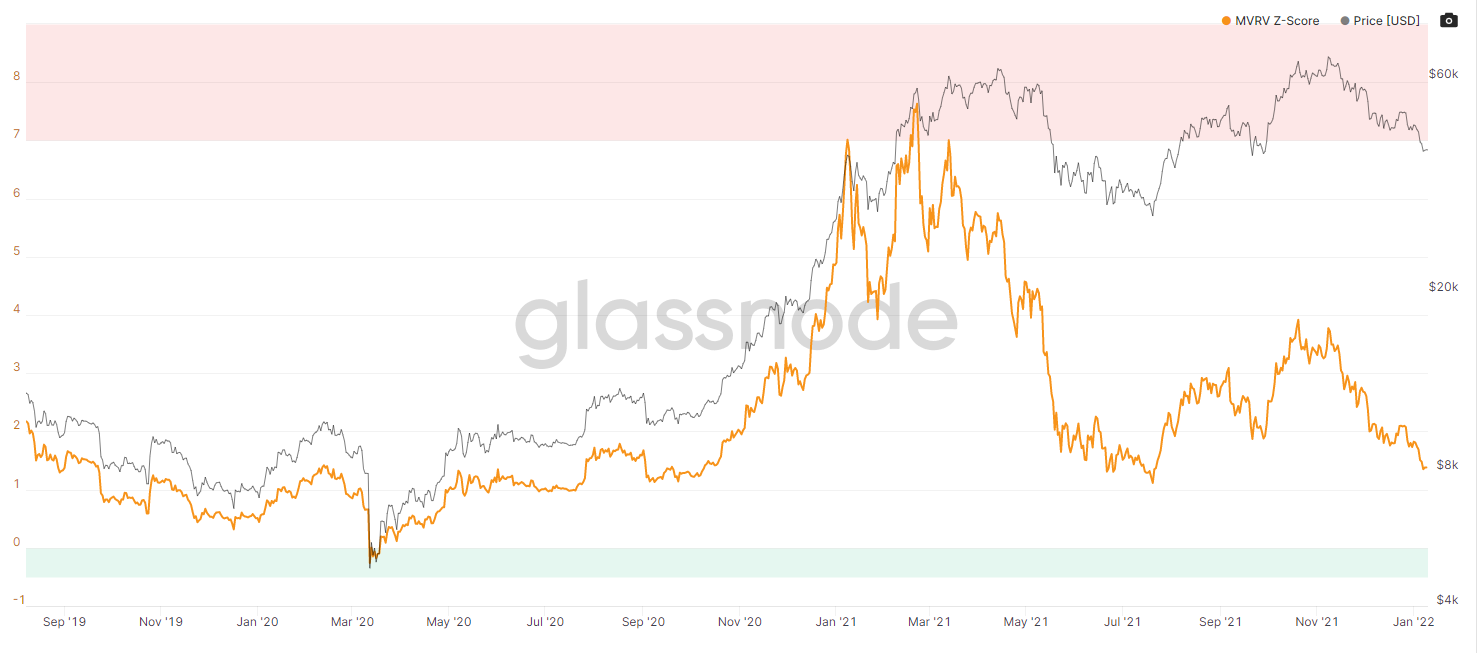
It is used to assess when Bitcoin is overvalued/undervalued relative to its "fair value". This indicator is in the overvalued and undervalued range, and there is no strong long-short point, but the current value is closer to the undervalued area (bullish), 29000 At that time, the value was 1.114, and it is currently 1.381. Historically, there is support around 1.1.
Figure 11: Comparison of MVRVZ-Score and BTC price trend
7. Changes in illiquid supply
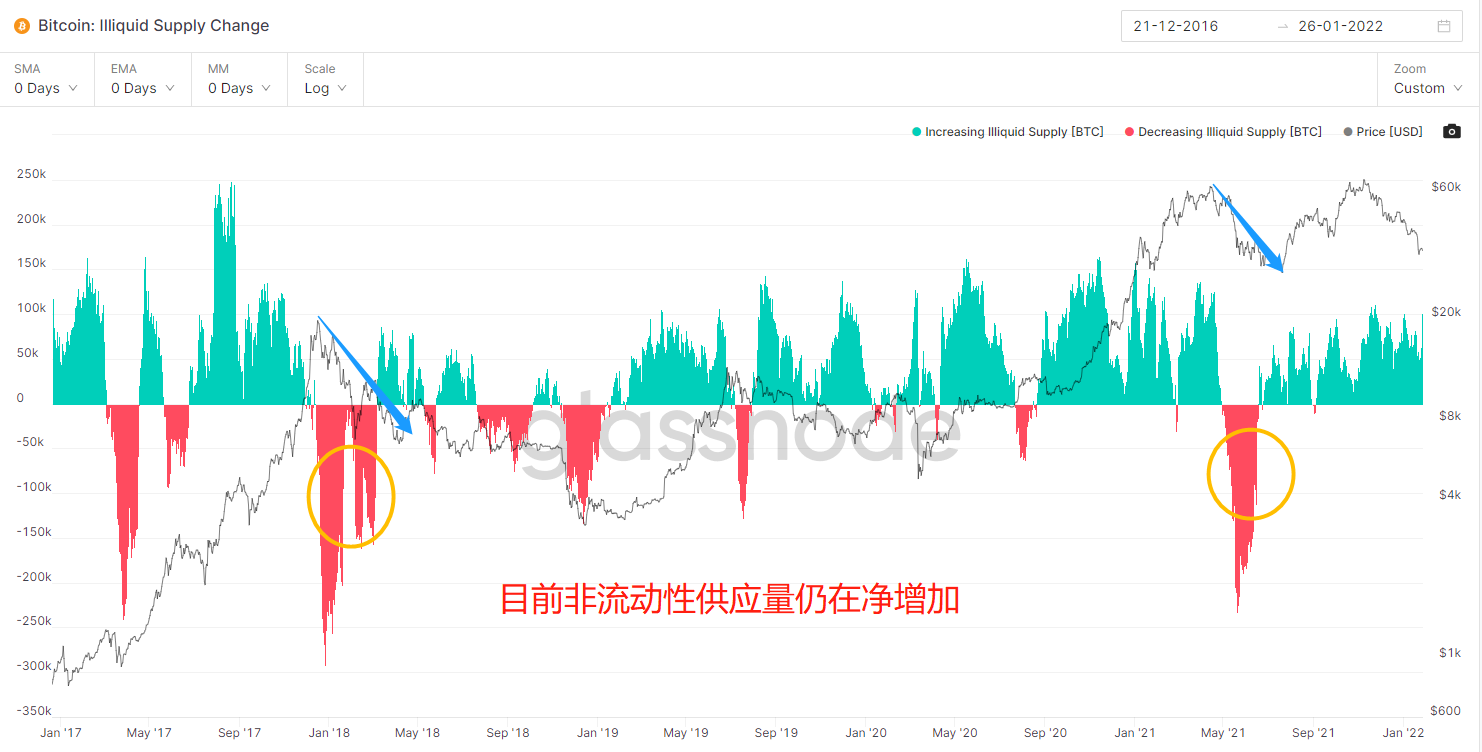
IlliquidSupply Change: From the perspective of the big cycle, Bitcoin: Illiquid Supply Change (Bitcoin: Illiquid SupplyChange) changes from a net increase to a net decrease often means a bull-bear conversion, which is true for both the 2017 bull market and the 2021 bull market. And during the bull market, the illiquid supply is mainly a net increase; during the bear market, the illiquid supply is mainly a net decrease. At present, the illiquid supply is still increasing on a net basis, and this data shows that the rising market is still there.
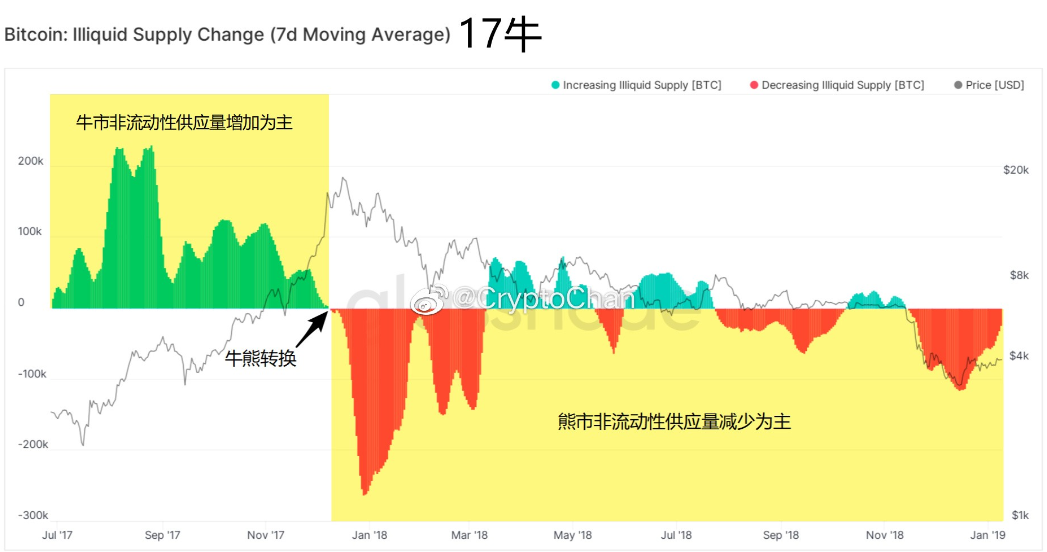
Figure 12: Comparison of illiquid supply changes and BTC prices since 2016
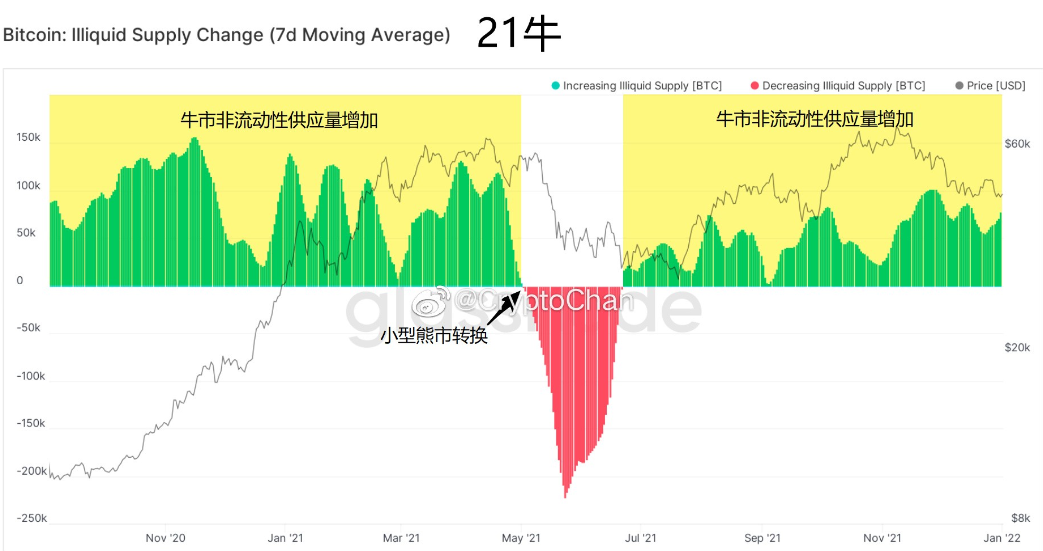
Figure 13: Changes in illiquid supply from bulls to bears in 2017
Figure 14: Changes in illiquid supply in bull markets and small to bear markets in 2021
8. The total circulating supply held by long-term holders
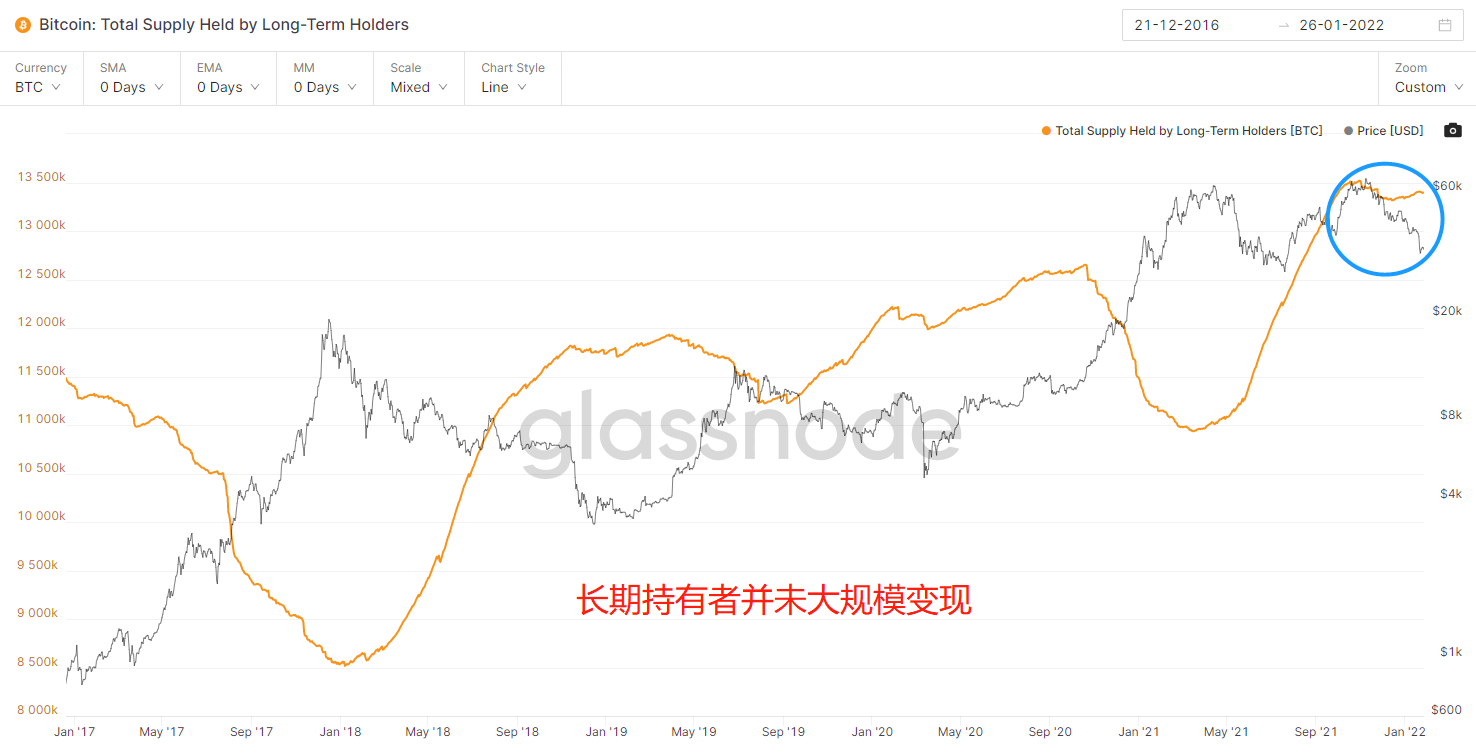
Long-TermHoldersSupply: During the rising bull market in 2017 and 2021, long-term holders are all liquidating on a large scale on the way up, and the indicators and prices show a trend of scissors. However, the rise of BTC from 29,000 to 69,000 has not seen the large-scale reduction of holdings before. It shows that long-term holders believe that the current decline is a short-term behavior, and there is still room for BTC to rise after adjustment. (Some analysts regard the one-sided hoarding behavior of this indicator as evidence that the market is bullish. Looking at history, this is a non-objective behavior)
Figure 15: Changes in long-term holdings and BTC trends since 2016
9. Option Data
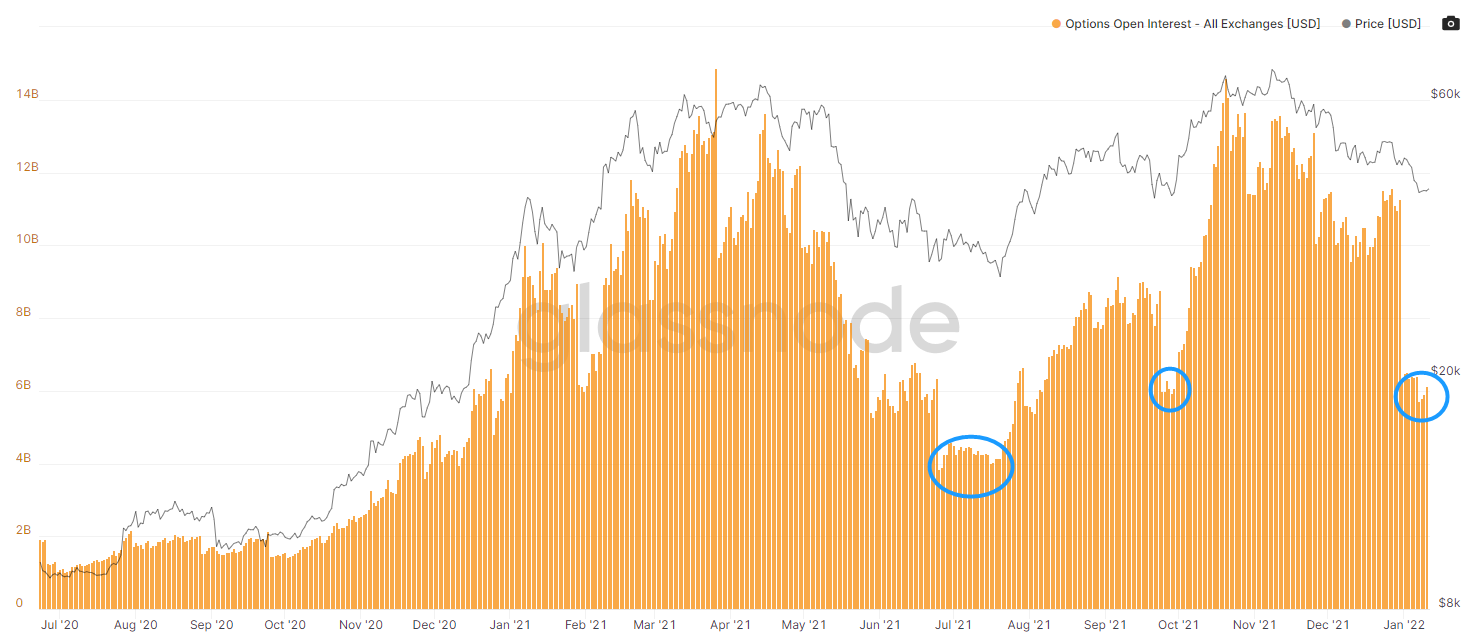
(1) The option position contract has shrunk to the amount of land. Historically, the probability of the amount of land reaching the land price at the stage is relatively high.
Figure 16: Option positions and BTC price trends
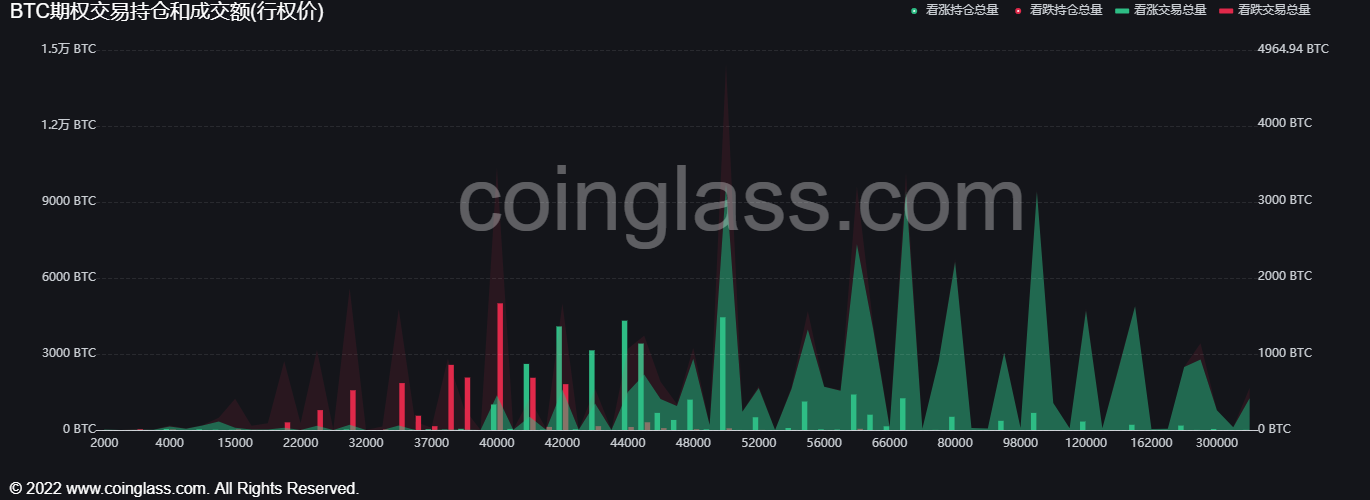
(2) At present, the strike price with the largest option position is 40,000, followed by 50,000. That is to say, there will be an important pressure line for the price of 40,000 and 50,000 in the next period of time.
Figure 17: BTC options open interest contracts
10. Technical graphical analysis of volume-price relationship
The BTC/USDT quarterly line is divided into tops, the monthly line has fallen three times in a row (no obvious stop for the time being), short-term bearish, and it is advisable to make a correction for the time being. In the near future, the main focus is on the closing of the monthly line (the length of the lower shadow line, that is, the buyer's willingness ).
To sum up, quarter (top type, bearish) - month (three consecutive negatives, bearish) - week (a drop, there is a possibility of stopping the decline) - day (long-short bottom competition period, temporarily It can be understood as the bottoming period) - 4 hours (the rebound has been frustrated and has not yet increased in volume); today's short-term view of the market here is temporarily adjusted as a callback (personally tends to continue to rebound after the influence of the Fed's hawkish sentiment dissipates).
3. Summary
3. Summary
Combined with the macro environment (Fed inflation, debt reduction, interest rate hike, shrinking balance sheet), data on the Bitcoin chain (there is a possibility of a rebound in the first quarter, first rise and then fall), option data (40,000-50,000 is at the peak of the strike price ), technical graphics of volume-price relationship (supporting a weekly rebound); in addition, there are two factors that determine the rise and fall of the market in the market outlook: the listing of Bitcoin spot ETF and the introduction of regulation on the digital market in the United States; based on the above information, support The weekly center fluctuates (30,000-50,000), and market institutions fully game, while reducing volatility, in order to meet the compliance supervision of regulators and the SEC's approval of spot ETF applications.
4. Risks and opportunities
Risk 1: The Fed's excessive interest rate hikes and shrinking balance sheets lead to a currency liquidity crisis and the U.S. stock market crash.
Risk 2: The United States has introduced strict and strong regulation, leading to a liquidity crisis in the digital market.
text


