DappRadar report: Why can NFT and chain games grow against the trend?
Compilation of the original text: black rice
Compilation of the original text: black rice
In 2021, blockchain users will grow significantly.
In this report, we analyze global trends, including the correlation of demographic and macro indicators with on-chain indicators, and predict important trends in the crypto industry in 2022 by analyzing user behavior patterns.
Main points of this article:
Main points of this article:
NFTs were barely affected by the decline in the crypto market; transaction volumes continued to increase, while the number of unique active wallets (UAWs) connected to NFT dapps on Ethereum increased by 43% since Q3 2021.
On the other hand, the correlation between the usage of DeFi and the price of encrypted assets is more obvious. When the prices of ETH, SOL, AVAX and LUNA hit record highs, more than 1.25 million UAWs were connected to DeFi dapps every day. UAW as low as 800,000.
China is currently the leader in traffic to dapps, up 166% compared to November 2021. In 2021, the United States will dominate in this regard.
first level title
Asian footprint becoming more visible across the industry
By the end of 2021, dapps are attracting more than 2.5 million unique active wallets (UAW) per day. This level of usage represents a 707% increase from the end of 2020. The rapid development of dapp is supported by different waves of interests, mainly due to NFT and blockchain games.
By analyzing the 1.4 million visits to DappRadar last December, we see trends in current user sources that may differ from what we saw in the middle of last year.
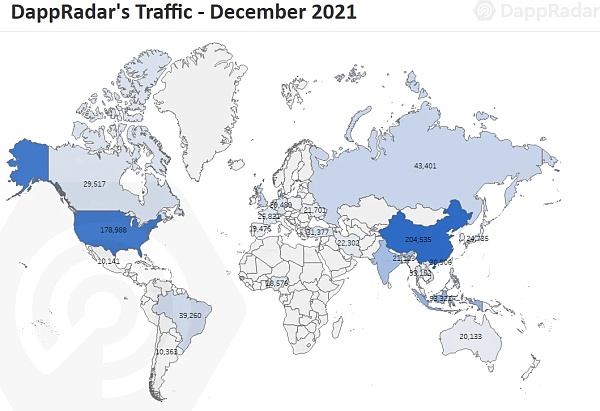
First, China is now the country with the broadest user base. 204,000 users used DappRadar in December, a 166% increase from November. Traffic from Indonesia and India is worth highlighting, as metrics for both countries more than doubled in December. Asia continues to expand its footprint across the crypto industry. Asia is certainly a region to watch closely due to the strong interest in blockchain gaming and the potential of NFTs.
The UK, Russia, the Philippines and Brazil are all behind India, but still have a lot of users. Traffic in these four countries combined exceeded 168,000 users, an average increase of around 30%, with Russia seeing the most significant growth.
first level title
Millennials and Generation Z Dominate the Blockchain Space
Continuing with the demographic analysis, we focus on age ranges to get more details on users who are interested in blockchain.
Generation Z (1997-2012) participation in the industry continues to accelerate. In December, 30% of DappRadar's users were from this age group, and they'll hover around 26% for most of 2021.
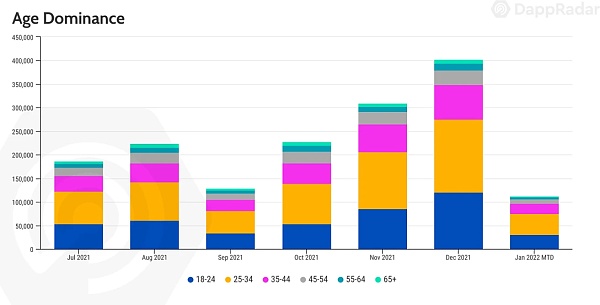
The dominance of Millennials (1980-1994) follows the same trend, accounting for 38% of traffic. Since millennials have shown a strong interest in fields such as NFTs and games, the future of both fields is bright.
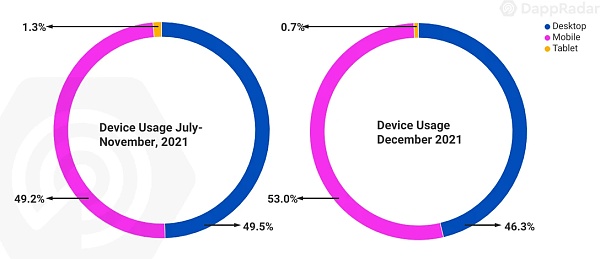
Another exciting metric emerges when analyzing a user's preferred device of use. Although we launched the RADAR Token and gained a lot of visitors, users still connect from mobile phones about 53% of the time. Although most users prefer to use the desktop version of the wallet for security reasons, desktop devices only bring in 46% of traffic. This could lead to an important behavioral trend that will likely become even more important as blockchain gaming is set to take center stage this year, as mobile wallets (such as Ronin) and mobile blockchain gaming are expected to take off in 2022. A giant leap takes place.
first level title
NFTs and games are more resistant to macro trends than DeFi
Although the three main categories of dapps (TVL in DeFi, NFT transaction volume, and usage of games) exploded in 2021, recent macroeconomic (such as the latest surge in the number of infections, the Fed’s intention to raise interest rates, and Kazakhstan’s gas problem) affects nearly one-fifth of all Bitcoin mining activity. The crypto market is once again caught in a cyclical bearish trend.
We analyzed how some blockchain macro indicators, such as the prices of mainstream cryptoassets, Ethereum’s gas fees, and Bitcoin’s Fear and Greed Index, will affect on-chain indicators. How important are macro metrics to blockchain user behavior?
NFT Indicator Soars Despite Crypto Asset Plunge
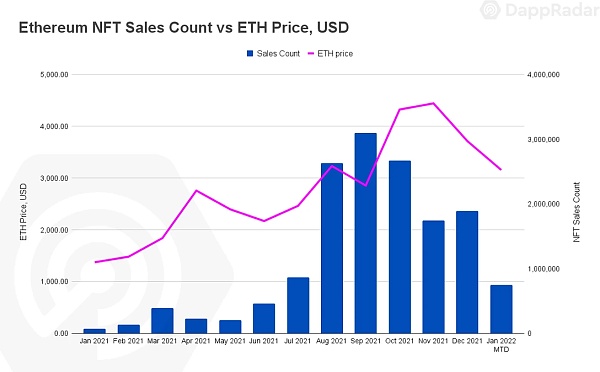
In the third quarter of 2021, NFT generated a transaction volume of US$10.7 billion, and the performance of US$11.9 billion in the fourth quarter made NFT still strong. On the other hand, the price of ETH has been on the decline since hitting an all-time high of $4,878 in November. Despite the volatility in crypto asset prices, NFTs are still trending positively.
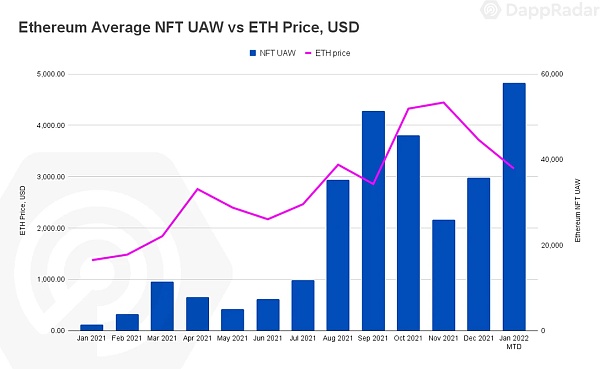
Not only has the number of NFT sales on Ethereum increased, but the number of UAWs connected to NFT dapps (collectibles and marketplaces) has also increased. Since December, an average of 46,800 UAWs have been connected to Ethereum NFT dapps, which is 43% higher than in Q3.
Despite the unfavorable macro indicators, the indispensable role of NFT in metaverse and games has contributed to positive on-chain indicators. Furthermore, built projects continually meet their respective goals, enhancing their community's prospects in the process. Add to that a steady stream of celebrities and big brands entering the space, and NFTs look as solid as ever.
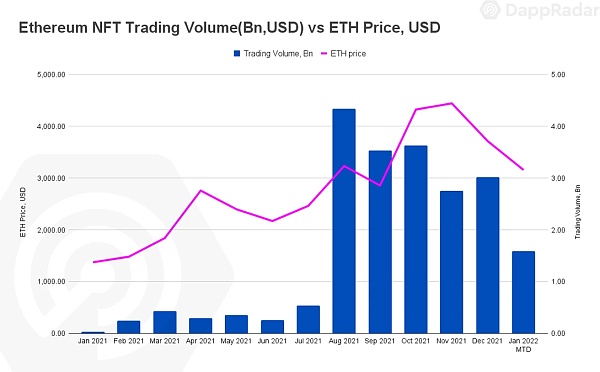
Additionally, the community is joining forces, such as the recently launched LooksRare marketplace, strengthening the NFT marketplace. Since the promise of NFTs is undeniably strong, investors may view crypto asset downtrends as buying opportunities as the value of the native asset (ETH in this case) reduces the actual price of NFTs.
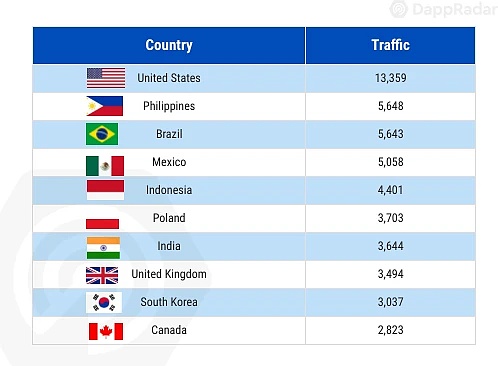
Finally, when it comes to NFTs as collectibles, the US remains the most active region. The United States is far ahead in terms of NFT traffic on DappRadar, with Brazil and Mexico, both in the Americas, in the top four. And Filipino users on the other side of the world have converted their huge interest in sports, fashion and celebrities into interest in the NFT field.
Strong correlation between DeFi and macro indicators
Although lagging behind blockchain games and NFTs, the total locked value in the DeFi space reached a record high at the end of 2021. Competitiveness in the space has picked up significantly, driven by attractive schemes including liquidity mining schemes.
However, no other area is more exposed to the crypto market than DeFi, so macro indicators, as well as on-chain DeFi indicators, may give us some clues about user behavior trend patterns.
Although the respective native tokens have a great impact on TVL, the usage of users does not. Comparing macro indicators such as Bitcoin's Fear and Greed Index (FGI) with user usage, we can see that DeFi relies heavily on the crypto market. [Note: FGI is an analytical tool widely used in cryptocurrency trading to measure market sentiment on a scale from 0 to 100, from very fearful (0) to very greedy (100). ]
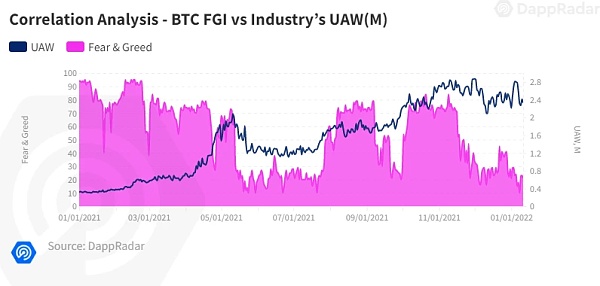
The two charts below show the correlation between FGI, the number of UAWs for the entire dapp industry, and the number of UAWs connected to DeFi dapps only. Compared to the dapp industry as a whole, there is no clear correlation between these two variables. As mentioned earlier, the behavior of NFTs is independent of the crypto market and is affected by its utility, maturity, use cases, etc., and the same is true for blockchain games. However, in DeFi, use and value are closely linked.
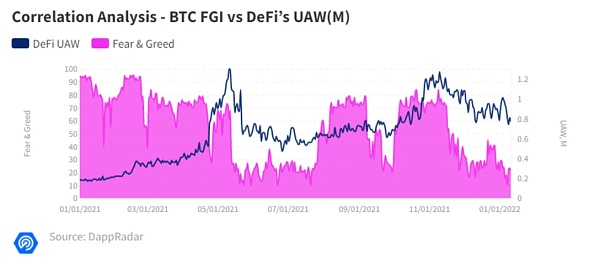
Looking at the correlation between FGI and DeFi users in detail, we can see that DeFi usage spiked to an all-time high of 1.25 million in November — correlating with the surge in the prices of AVAX, SOL, and LUNA. As the crypto market cooled towards the end of the year, usage fell below 1 million UAW again.
A similar situation occurs when analyzing the three blockchains with the highest TVL and their native assets.
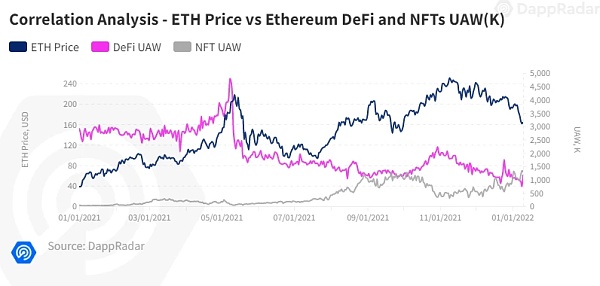
Starting with Ethereum, the price of ETH has no correlation with NFT. But by observing the price of ETH and the usage of DeFi, we can conclude that DeFi has a slight correlation with the price of its underlying native assets.
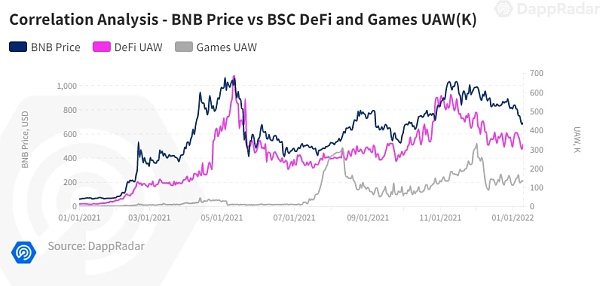
On BSC, the UAW of DeFi dapps connected to BSC followed a similar trajectory to BNB price, again illustrating the correlation between DeFi and its underlying native asset.
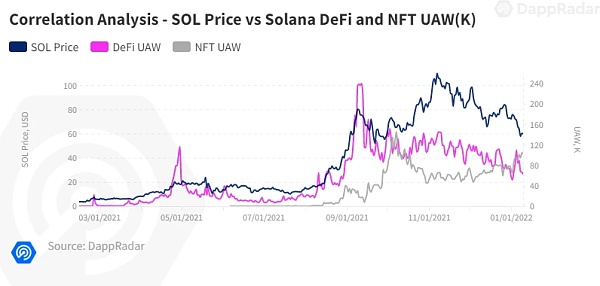
The last example is Solana. Comparing the usage of DeFi and NFT on Solana once again proves that user behavior in DeFi is largely dependent on the encrypted market.
Blockchain Gaming Adoption Remains Stable
DeFi and NFTs follow two different paths. As far as DeFi is concerned, macroeconomic indicators play an important role in user usage in the space. While NFT seems to be more independent, the same situation applies to blockchain games.
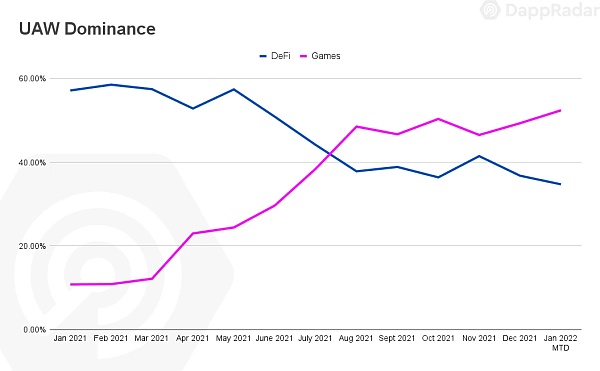
Last year, we witnessed the rapid growth and widespread adoption of blockchain games, thanks to the concept of P2E (Play-to-Earn, Earn While Playing) and Metaverse. Just like what we've seen in the NFT space, these trends externally affect how users behave. In this case, the positive sentiment surrounding these two concepts makes people want to play blockchain games.
There is no doubt that blockchain games are attracting more users every month, increasing the player base tremendously. With P2E and GameFi widely expected to boom in 2022, we can predict that games will continue to drive dapp usage in the crypto industry in 2022.
in conclusion
in conclusion
User behavior patterns are insightful and help to predict trends that may develop across the industry in the coming months.
Analysis of demographics reveals growing interest in blockchain in Asian markets. Their interest in games and NFTs has increased significantly. Age and equipment analysis can also help monitor potential demand in the short term.
Additionally, combining macro metrics with on-chain metrics can also provide clues to user behavior patterns. In this case, we can observe how NFTs and games function independently of factors affecting the industry such as crypto market trends and other relevant indicators.
risk warning:
risk warning:
According to the "Notice on Further Preventing and Dealing with the Risk of Hype in Virtual Currency Transactions" issued by the central bank and other departments, the content of this article is only for information sharing, and does not promote or endorse any operation and investment behavior. Participate in any illegal financial practice.


