Are your DeFi tokens overvalued?


Editor's Note: This article comes fromBanklessEditor's Note: This article comes fromLucas Campbellsecondary title
introduction
introduction
DeFi (decentralized finance) has attracted a lot of attention in the past two years. Some DeFi projects will also issue their own tokens, such as MakerDao's governance token MKR, and many people have participated in it.
However, do you really understand the value behind these DeFi project tokens?Lucas Campbellauthor of this article
If you are interested in DeFi projects and their value, and want to be ahead of 99.9% of investors, I recommend reading this article. Friends who already have a certain understanding of the DeFi protocol can skip directly to parts 4-6.
secondary title
1. On-chain cash flow and the birth of encrypted capital assets
The advent of on-chain cash flows has given birth to a new asset class - encrypted capital assets. The beauty of crypto capital assets is that we don't have to wait for a company to report earnings every quarter. Instead, it's always available and updated every 15 seconds.
(Odaily Note: Robert Greer proposed three "super class" assets in his seminal article "What is an Asset Class, Anyway" published in 1997, which are capital assets (such as stocks and bonds) investment), consumable/convertible assets, and value-preserving assets. The author means that DeFi tokens are capital assets.)
Usually, we use an ancient indicator to evaluate traditional capital assets, which is the price-earnings ratio (PE Ratio). In simple terms, the P/E ratio is how the market values an asset based on the income its asset generates.
For example, Apple stock has a P/E ratio of 23.75, which means investors are willing to pay $23.75 for every dollar the company currently earns. An asset with a high P/E ratio generally means that the asset is overvalued or has high growth expectations; if an asset has a low P/E ratio, it means that the market believes that the asset is either undervalued or has low growth expectations in the future.
In DeFi, we can also use this framework to measure the value of the tokenization protocol, so as to analyze whether some DeFi tokens are worth buying.Although collecting data on on-chain cash flows from major DeFi protocols seems like a daunting task. But luckily, I'm inMy friend provided me with some data on the current income status of DeFi projects, and I would like to express my gratitude here.
secondary title
2. DeFi Token Protocol Directory
There are many DeFi protocols, and this article mainly involves the protocols, mainly some tokenization protocols, as follows:
0x: Liquidity protocol, market fees are allocated to ZRX token holders/liquidity providers;
Aave: money market protocol, the fee income is used to destroy the native token LEND;
Augur: Derivatives protocol, the proceeds from the prediction market will be distributed to REP token holders;
Bancor: liquidity agreement, a part of the transaction fee is allocated to BNT liquidity providers;
Compound: money market protocol, accrued interest is allocated to insurance reserves;
dYdX*: Liquidity agreement for margin trading, transaction fees are allocated to the parent company;
Kyber: Liquidity protocol, a part of the transaction fee is used to destroy the native token KNC or directly distribute to those who participate in governance;
Maker: Stability protocol, part of the interest generated by borrowing Dai will be used to purchase and destroy the native token MKR;
Nexus Mutual: a derivatives agreement that earns premiums by selling insurance;
Synthetix: Derivatives protocol, transaction fees are allocated to SNX token holders to encourage them to hold SNX and issue synthetic asset Synths;
(Note: * indicates an untokenized agreement or an asset that is not publicly accessible)
3. DeFi annualized income analysis
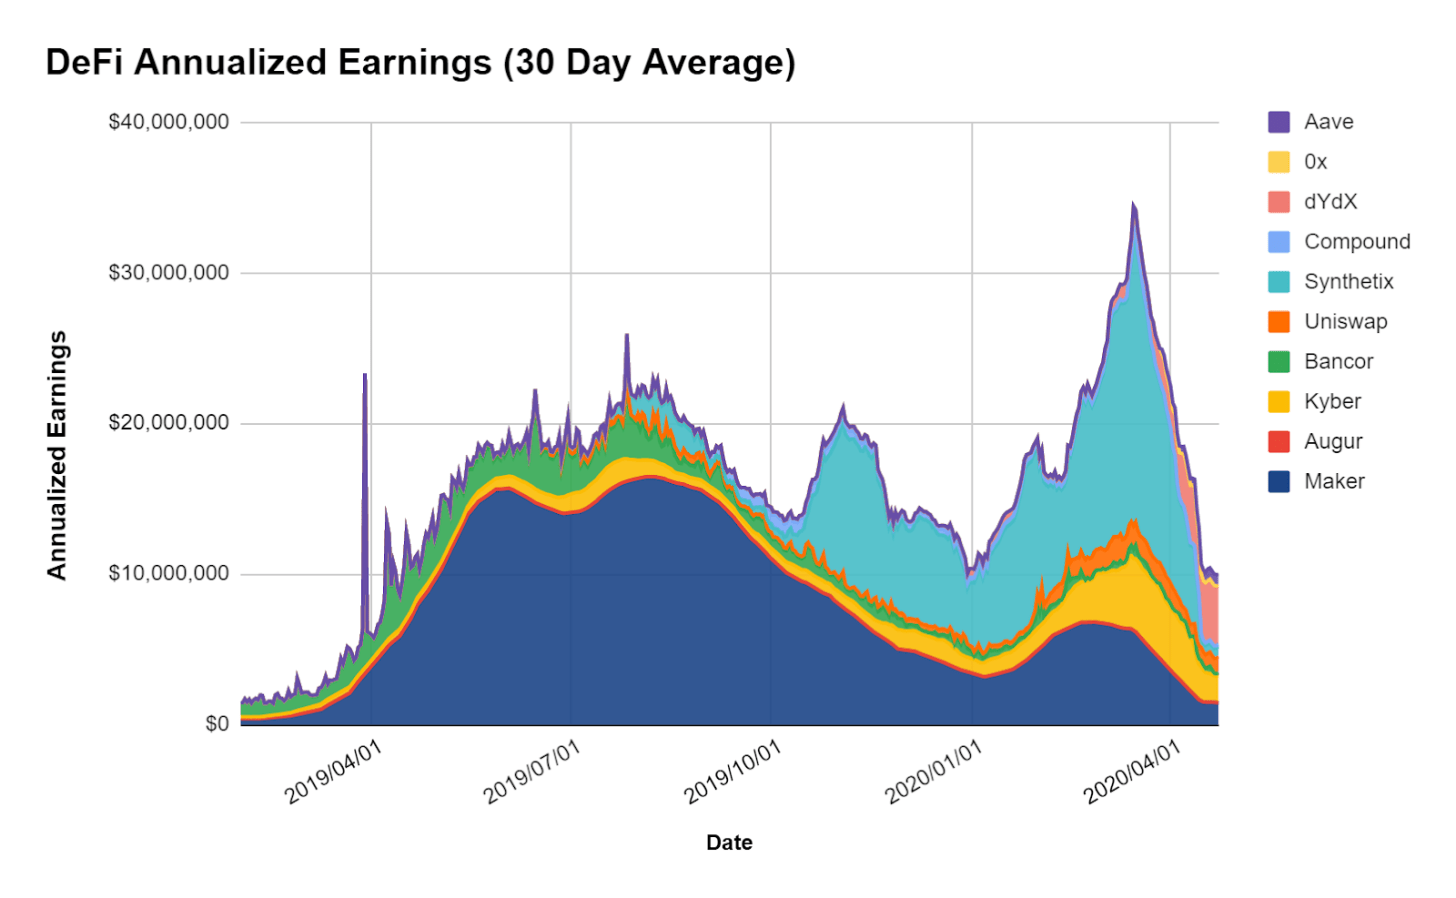
image description
Average 30-day annualized return calculated by Token Terminal
Maker (MKR) protocol income
In 2019, Maker dominates in terms of annualized returns, with a clear advantage. The simple design of the single collateral system Sai (Single Collateral Dai) has allowed the protocol to generate impressive yields - even by today's standards. In a single-collateral system, the protocol uses all interest generated by lending Dai to buy back and burn MKR—effectively providing MKR holders with a considerable cash flow during the first year of the protocol’s entry into force.
However, the introduction of multi-collateral Dai has changed the original pattern. The majority of protocol earnings are now distributed to Dai holders in the form of the Dai Savings Rate (DSR), rather than all to MKR holders. This way, the difference between the DSR and the stability fee is effectively the "net profit" of the protocol.
While Maker's profit margins have fallen with the upgrade, the worst is yet to come. In order to eliminate the impact of Black Thursday (312 plunge) and incentivize DeFi users to mint DAI to restore the parity between DAI and the US dollar, Maker reduced the stability fee to 0%. As a result, the expected annualized return of the Maker protocol fell to its lowest level since its inception.
Synthetix (SNX) Protocol Earnings
In the case of Synthetix, front-runners (the original text uses front-runners, front-runners) manipulate asset prices in the spot market, and then front-run transactions on Synthetix before the Oracle (oracle machine) updates the price, successfully creating huge arbitrage opportunities at the expense of other SNX token holders. In the end, the front-running attack affected the entire Synthetix network and created extraordinary benefits for this derivatives protocol. Fortunately, the front-running issue has been largely alleviated, and Synthetix's earnings are about to return to normal.
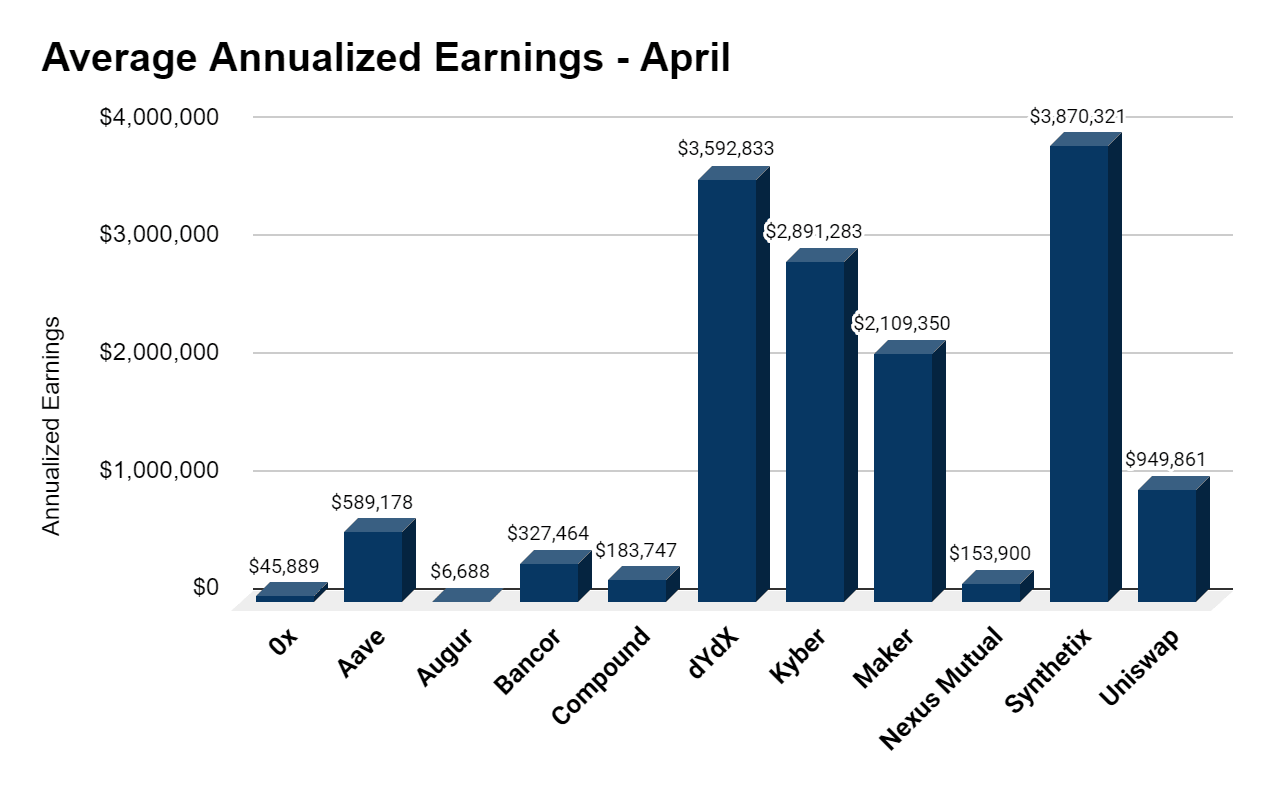
image description
Annual revenue calculated by TokenTerminal based on April data
In the graph above, we can also see that Synthetix is still the most profitable protocol. But in fact, until mid-April, Synthetix was still solving the problem of "front-running transactions", so its data should be looked at separately.
In the first 15 days of April, Synthetix's annual average revenue was about $6 million; the expected revenue for the second half of April was about $640,000, an order of magnitude lower than the first half. While the decline in revenue appears to be negative, it also suggests that Synthetix seems to have resolved the "front-running" issue, and future data will be more accurate.
Kyber (KNC) Protocol Earnings
As Maker and Synthetix have diminishing marginal returns, dYdX and Kyber Network have gradually risen in the DeFi space and gradually took the lead.Kyber Network's on-chain liquidity protocol has rapidly grown into a leader in the DeFi ecosystem. In March alone, Kyber approximatelyNearly $200 million in monthly transaction volume from 13,000 addresses
. As a result, the protocol’s transaction volume also translates into considerable income for KNC token holders — around $2.89 million in annual revenue based on April’s transaction volume.
dYdX Protocol Earnings
The second highest earner in April was dYdX, a decentralized exchange (DEX) that supports margin trading. Through dYdX, users can carry out lending business and derivatives transactions. The team also recently announced support for BTC perpetual contracts.
The interesting thing about dYdX is that although it is a product built on top of a DeFi protocol, the DEX fee belongs to the underlying company, not to a decentralized ecosystem token holder. So even though dYdX operates a non-custodial exchange powered by its users, the fact that transaction fees are distributed to the parent company actually makes dYdX closer to a CEX (centralized exchange) than a DeFi protocol.
On DEX, Uniswap is one of the last major contributors to DeFi revenue. As of April, the Uniswap protocol generated about $1 million in proceeds. While Uniswap has been in the doldrums since its peak ($1.75 million) in early March, the company is still up 110% year-to-date in projected earnings.
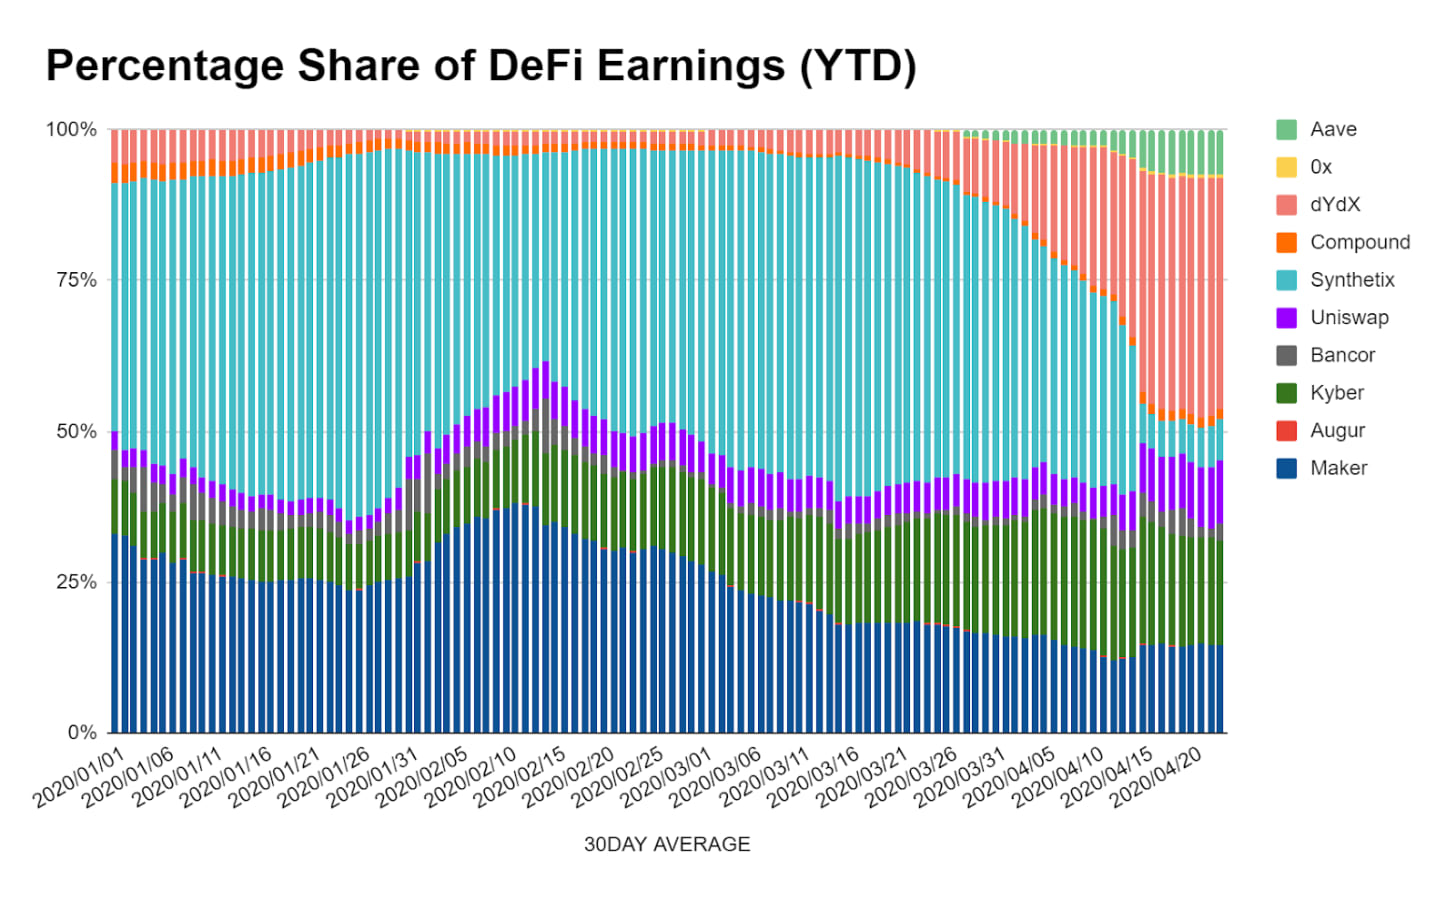
image description
Percentage of total DeFi revenue, data from TokenTerminal.Uniswap V2Previously, we had an idea, what would happen if Uniswap issued native tokens? It seemed like a joke at the time, but
The announcement in late March strongly hinted that they might issue a governance token.
In Uniswap V2, the protocol fee mechanism is included. For ordinary users, there is no difference from before; for liquidity providers, the fee captured is reduced from 0.30% to 0.25%. The distribution ratio of this fee is written into the core contract and cannot be tampered with.
According to the current transaction volume, Uniswap can probably generate an annual fee of about US$5 million, and contributors to the agreement and ecology, including the project team, can capture about US$830,000 in fees. These fees can be used to support the development of the protocol and the construction of the ecology.
Overall, the emergence of governance tokens will not only provide exit opportunities for former Uniswap investors, but will also provide a long-term sustainable model for the development of the protocol.
Aave Protocol Benefits
According to DeFiPulse, Aave ranks fifth with a total locked value of $42 million; in April alone, the loan agreement in the project increased its annualized return from $314,000 to $746,000 in less than 300,000. A 137% increase in just a few days.
secondary title
We now understand how these agreements stack up in terms of benefits. Time to do a valuation analysis on these tokenization protocols and see if they are overvalued or undervalued. We introduce the "price-earnings ratio" for analysis, as follows:
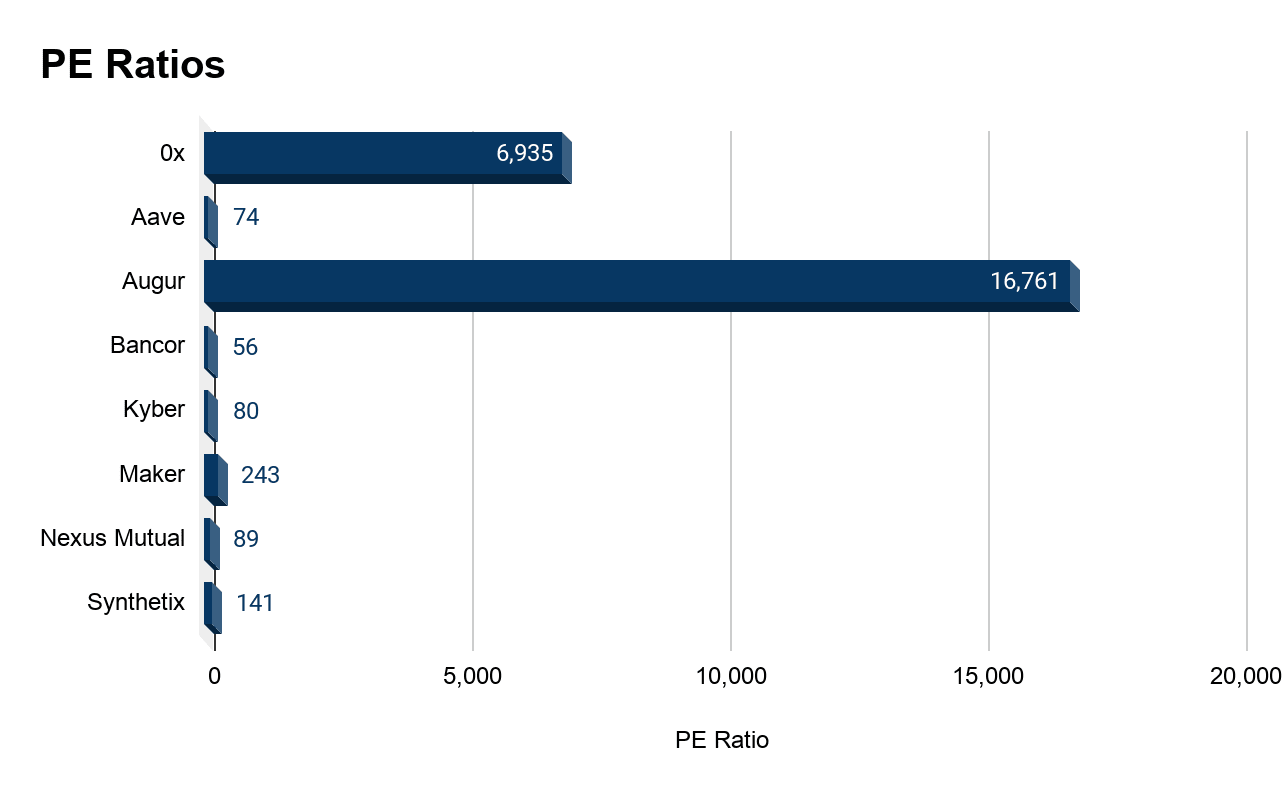
image description
The lower the value, the lower the cost of purchasing the asset per unit of profit, data as of 05/01/20.
Note that Compound, dYdX, and Uniswap are all tokenless and therefore not included in the above diagram.
In the above figure, we can find that the price-earnings ratios of other protocols are higher than those of other agreements, which are ridiculously high, which are 6935 times and 16761 times respectively. Such multiples are also rare in the traditional financial field (basically invisible), which also shows that investors have extremely high growth expectations for liquidity and derivatives agreements.
On the other hand, Bancor, Aave, and Kyber currently have the lowest P/E ratios in the DeFi space, none exceeding 100.
Aave ranks second to last, currently at 74; in the past three months, Kyber’s price-earnings ratio has increased greatly, and it has reached 80; as a liquidity protocol, Bancor’s current price-earnings ratio is only 56 times, and the average expected return is about 327,000 USD, with a market cap of $13.6 million (the lowest valuation in the space).
Therefore, if the price-earnings ratio of the DeFi protocol is lower than 100 times, it may indicate that its value is basically equivalent to the income, and it is not overvalued, which also means that it is a good choice for potential investors.
secondary title
5. DeFi Token Performance
Year-to-date, DeFi tokens are up 43% on average, led by Aave (LEND) and Kyber (KNC).
Among them, affected by the upgrade of Katalyst and the fundamental growth of Kyber Network in terms of transaction volume and profitability, the price of KNC has increased by 213%; followed by Aave, since its name was changed to EthLend in January this year, the price of LEND tokens has increased by 135%.
In fact, before the "312 crash", Maker (MKR) performed very well. As of the end of February, MKR’s yield peaked at 47.61%. However, its price eventually fell sharply due to the "Black Thursday" crash and the auction of MKR to pay off debt. After the sharp drop, MKR has also followed the recovery of the market, rising by about 74% since hitting the bottom of $200 in late March.
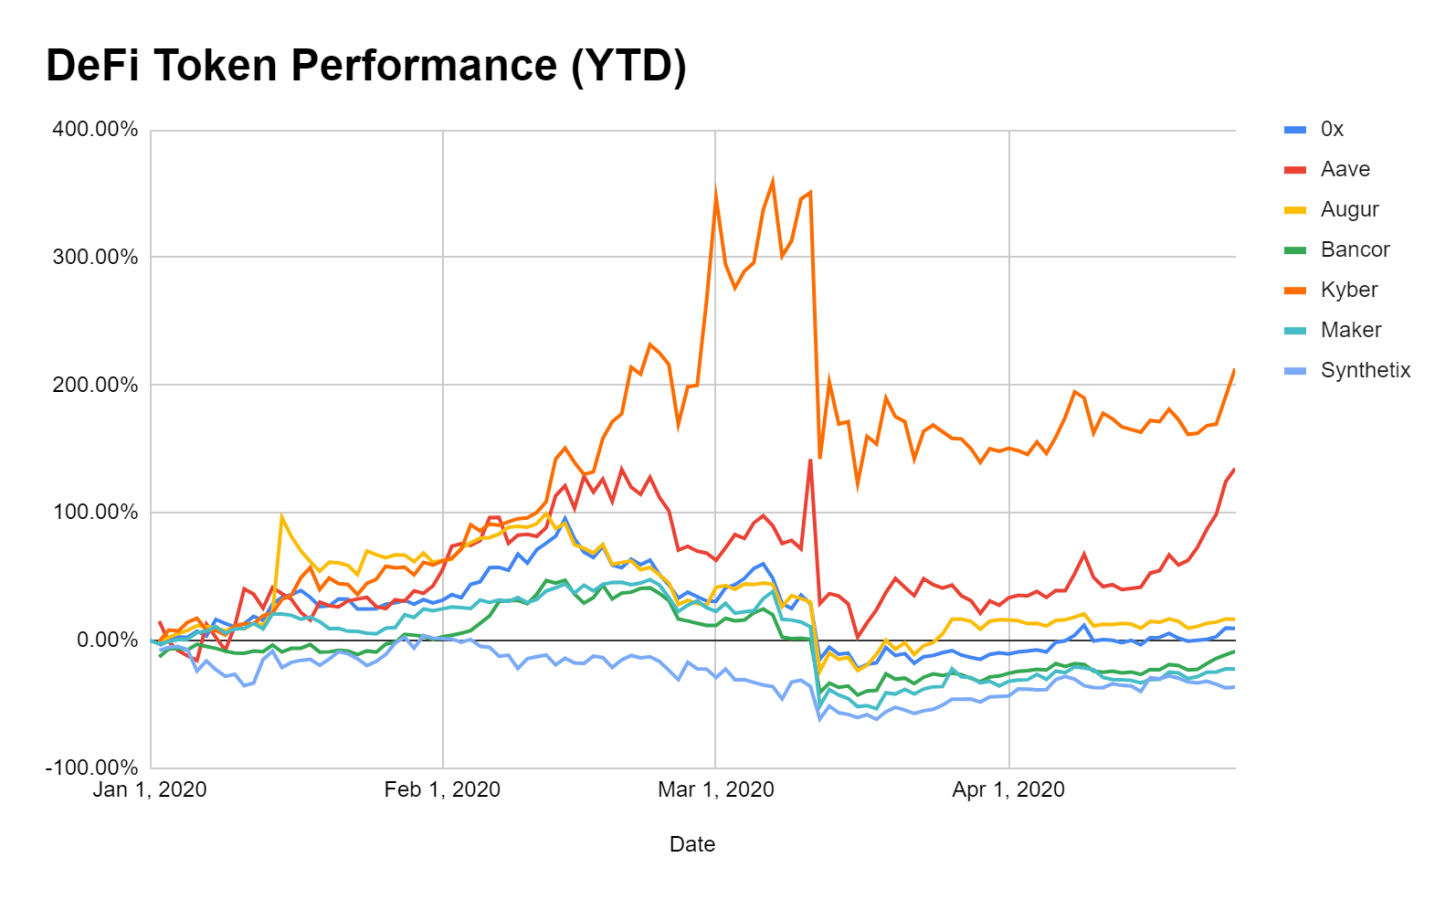
image description
Performance of major DeFi tokens, data from TokenTerminal
The prices of the other two DeFi protocols with high P/E ratios, 0x and augur, remained basically stable. Augur’s accumulative income has increased by 16.64% this year, and 0x’s ZRX token has increased its accumulative income by nearly 10% this year.
secondary title
Knowing the protocol return and the price performance of the underlying token, we can now see if there is a correlation between the two by plotting the difference between the change in the price of the token and the change in the annualized return of the protocol. As follows:
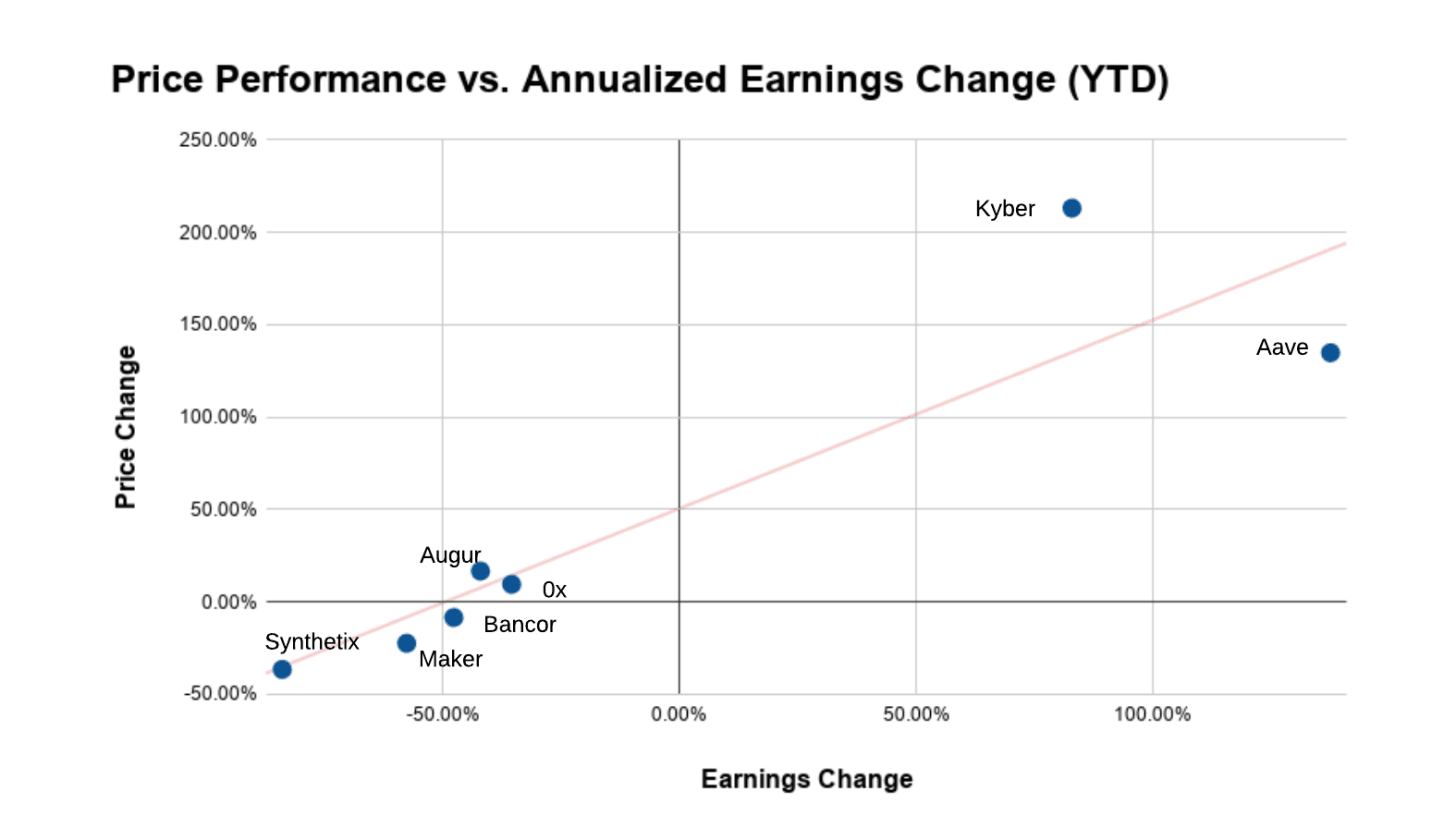
image description
Changes in DeFi tokens and annualized returns, data from Token Terminal
The above figure shows that the growth of Kyber and Aave's annualized income and token performance show a highly positive correlation trend.
Of course, we are still not 100% sure whether revenue drives price or price drives revenue.
Generally speaking, when the usage of the protocol increases, the income increases accordingly; as the income increases, it also means that the token is more valuable to potential investors.
While a causal relationship between price and value (earnings) cannot be guaranteed, it is clear that there must be a significant correlation between the two, and we will continue to explore this relationship later.
secondary title
7. Conclusion
We are slowly starting to understand crypto assets.
The combination of transparent on-chain cash flow and tokenized protocols creates a new class of assets - crypto capital assets.
Many DeFi tokens allow holders to capture a portion of the cash flow from value-added participation in the ecosystem, whether by participating in governance, becoming a liquidity provider, or simply holding the token.
DeFi tokens represent the economic rights of protocol proceeds, which allows us to study these assets within the framework of traditional capital assets. This new asset also applies to some valuation models in traditional finance.
Although DeFi currently has nearly $1 billion in value locked, the industry as a whole is still extremely profitable, and the aggregate annualized revenue generated by the Ethereum currency protocol is less than $10 million. It's also a tiny number in the entire crypto ecosystem.
In addition, only $1 billion of value is locked in the DeFi chain, which is far from the storage value of hundreds of billions or trillions of dollars in banks. Decentralized finance as a whole still has a long way to go.