






五大歷史級指標同時亮燈,比特幣熊市見底


- 核心觀點:多項基於市場週期、相對強度和鏈上成本的長期指標同時發出極端訊號,表明比特幣可能已接近或正處於本輪熊市的價格與時間低點,未來1-3年或迎來顯著正收益,但邊際收益呈遞減趨勢。
- 關鍵要素:
- 比特幣價格較歷史高點下跌50%,熊市已持續超40週;歷史週期顯示低點通常出現在高點後第60週,即2026年11月底左右。
- 比特幣兌納斯達克100指數的14週RSI移動均線達72.6,創歷史最高超賣水平;歷史僅有0.35%時間高於70,此訊號預示未來1-3年表現優異。
- 比特幣兌黃金的RSI於2026年2月創歷史最高超買(即比特幣超賣),同樣屬於極端罕見事件,歷史上往往對應比特幣長期價格低點。
- 比特幣鏈上實際價格為5.3萬美元,比現貨低18%,歷史上僅12%時間低於該水平;每次進入該區域後,未來150週均錄得顯著正收益。
- 當前週期是首個涵蓋ETF持倉、企業持有及複雜衍生品交易的週期,結構性變化可能導致歷史規律失效,需謹慎對待樣本量小的局限性。
Original from Blockworks Research
Compiled by Golem, Odaily Planet Daily (@web3_golem)

Key Takeaways:
- Bitcoin is currently down 50% from its all-time high, with the bear market lasting over 40 weeks. A series of long-term cycle indicators suggest the market may be at or near a low point in both price and time.
- This month, Bitcoin hit its most oversold level ever against the Nasdaq index, and in February of this year, it also hit its most oversold level ever against gold. Previous instances approaching these extreme levels have typically signaled a long-term cycle low and foreshadowed strong performance and positive returns for Bitcoin over the next 1-3 years.
- Bitcoin's realized price (the aggregate on-chain cost basis of the circulating supply) is currently $53,000, 18% below the spot price. Every bear market low in history has seen Bitcoin's price fall below the realized price. Bitcoin's price has been below the realized price only 12% of the time in its history. Starting from this point, Bitcoin has generated considerable returns over 1-3 year timeframes.
- Historical bear market cycles typically bottom around week 60 after the all-time high, suggesting the low for this cycle could occur around the end of November 2026.
- In summary, the confluence of various factors suggests that the period from now until December 2026 may represent a highly attractive long-term re-accumulation opportunity for Bitcoin.
Diminishing Returns and the Need for Conditional Investing
Since March 2021, Bitcoin's price has largely been range-bound; against the Nasdaq index, it has been flat since November 2017, a period spanning nearly nine years. Over this timeframe, Bitcoin's performance relative to stock indices has been quite flat, while its volatility has been significantly higher. On a risk-adjusted basis, Bitcoin has underperformed stock indices.
This context is crucial for how to approach holding Bitcoin. As Bitcoin's price rises and falls, its marginal returns will diminish. The passive, always-long strategy that rewarded holders over the past few cycles appears to be losing its effectiveness. Therefore, achieving excess returns increasingly requires seizing opportunities to tactically increase or decrease Bitcoin exposure.
To identify these opportunity windows, the indicators presented in this article are conditional signals that remain "inactive" for most of history, with their strongest signals appearing in the tails, occurring only a few times per decade.
Currently, these signals have simultaneously emerged and all point to the same conclusion: Bitcoin may be at or near a long-term cyclical price low.
Indicator 1: Nasdaq/Bitcoin Relative Strength Signal
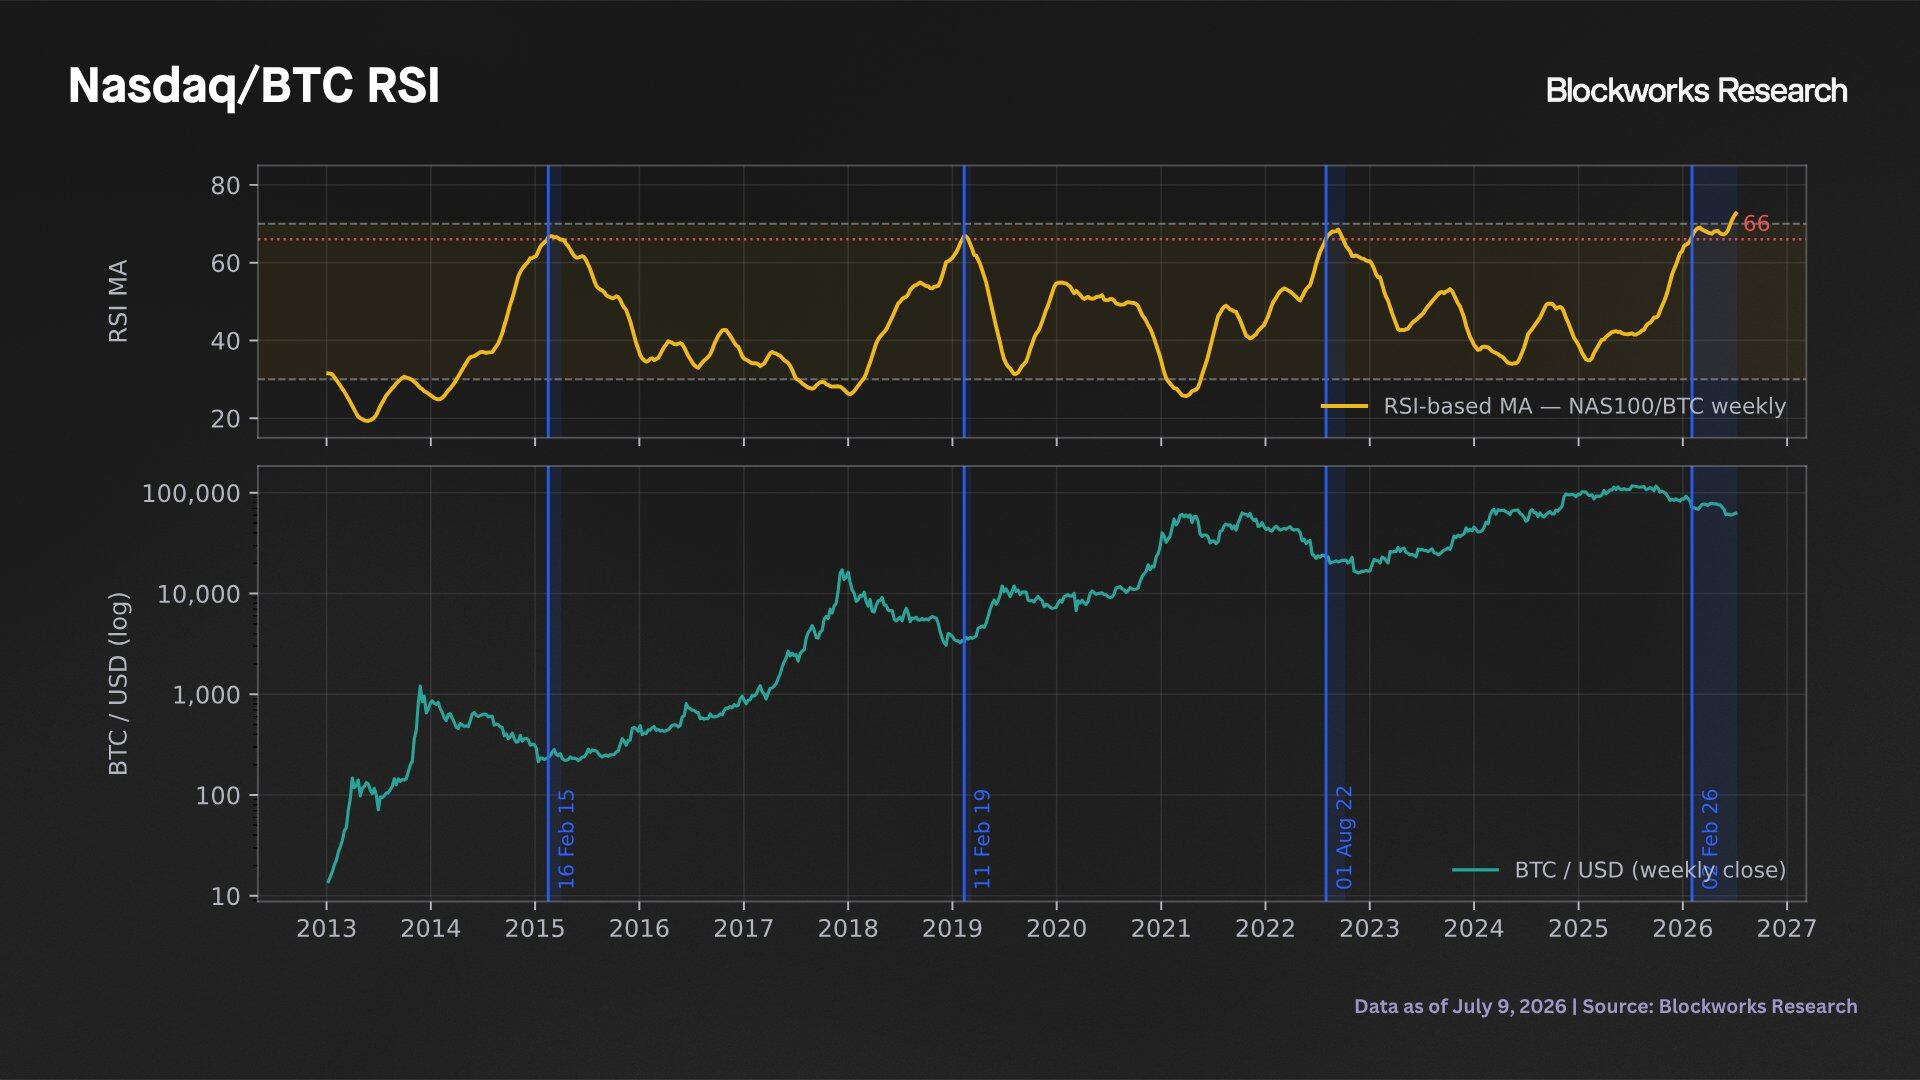
The first signal is based on the ratio of the Nasdaq 100 Index to Bitcoin, calculated using weekly closing prices over the past 875 periods. We compute the 14-period Relative Strength Index (RSI) of this ratio and smooth it using a 14-period simple moving average.
An elevated RSI indicates the Nasdaq is overbought relative to Bitcoin; a decreasing RSI indicates the opposite. This is not an intraday trading indicator. It is a 14-week moving average of a 14-week oscillator, and its transitions between overbought and oversold states occur over multi-year market cycles, not days or weeks.
Nasdaq/BTC RSI
Nasdaq relative overbought conditions are rare events. The moving average of the RSI has been above 65 only 5.78% of the time in its history and above 70 only 0.35% of the time. These thresholds were breached only during four periods: February 2015, February 2019, August 2022, and the period that began in late January 2026 and continues to the present.
The current value needs to be analyzed from three perspectives:
- Firstly, the current level of 72.6 is at an all-time high, 4.1 points higher than the previous high of 68.5 set in September 2022. All observations above 70 have occurred within the past month.
- Secondly, the current cycle has lasted 24 weeks, setting a historical record, far exceeding the 11 weeks in 2015, 4 weeks in 2019, and 10 weeks in 2022.
- Thirdly, having occurred only four times in the past 16 years, the current situation represents one of the rarest phenomena for this indicator. By this measure, the Nasdaq is more overbought relative to Bitcoin than ever before. Conversely, looking at the pair and its RSI inversely, this represents the most severe oversold condition for Bitcoin relative to the Nasdaq over a long timeframe.
Indicator 2: Long-Term Expected Returns
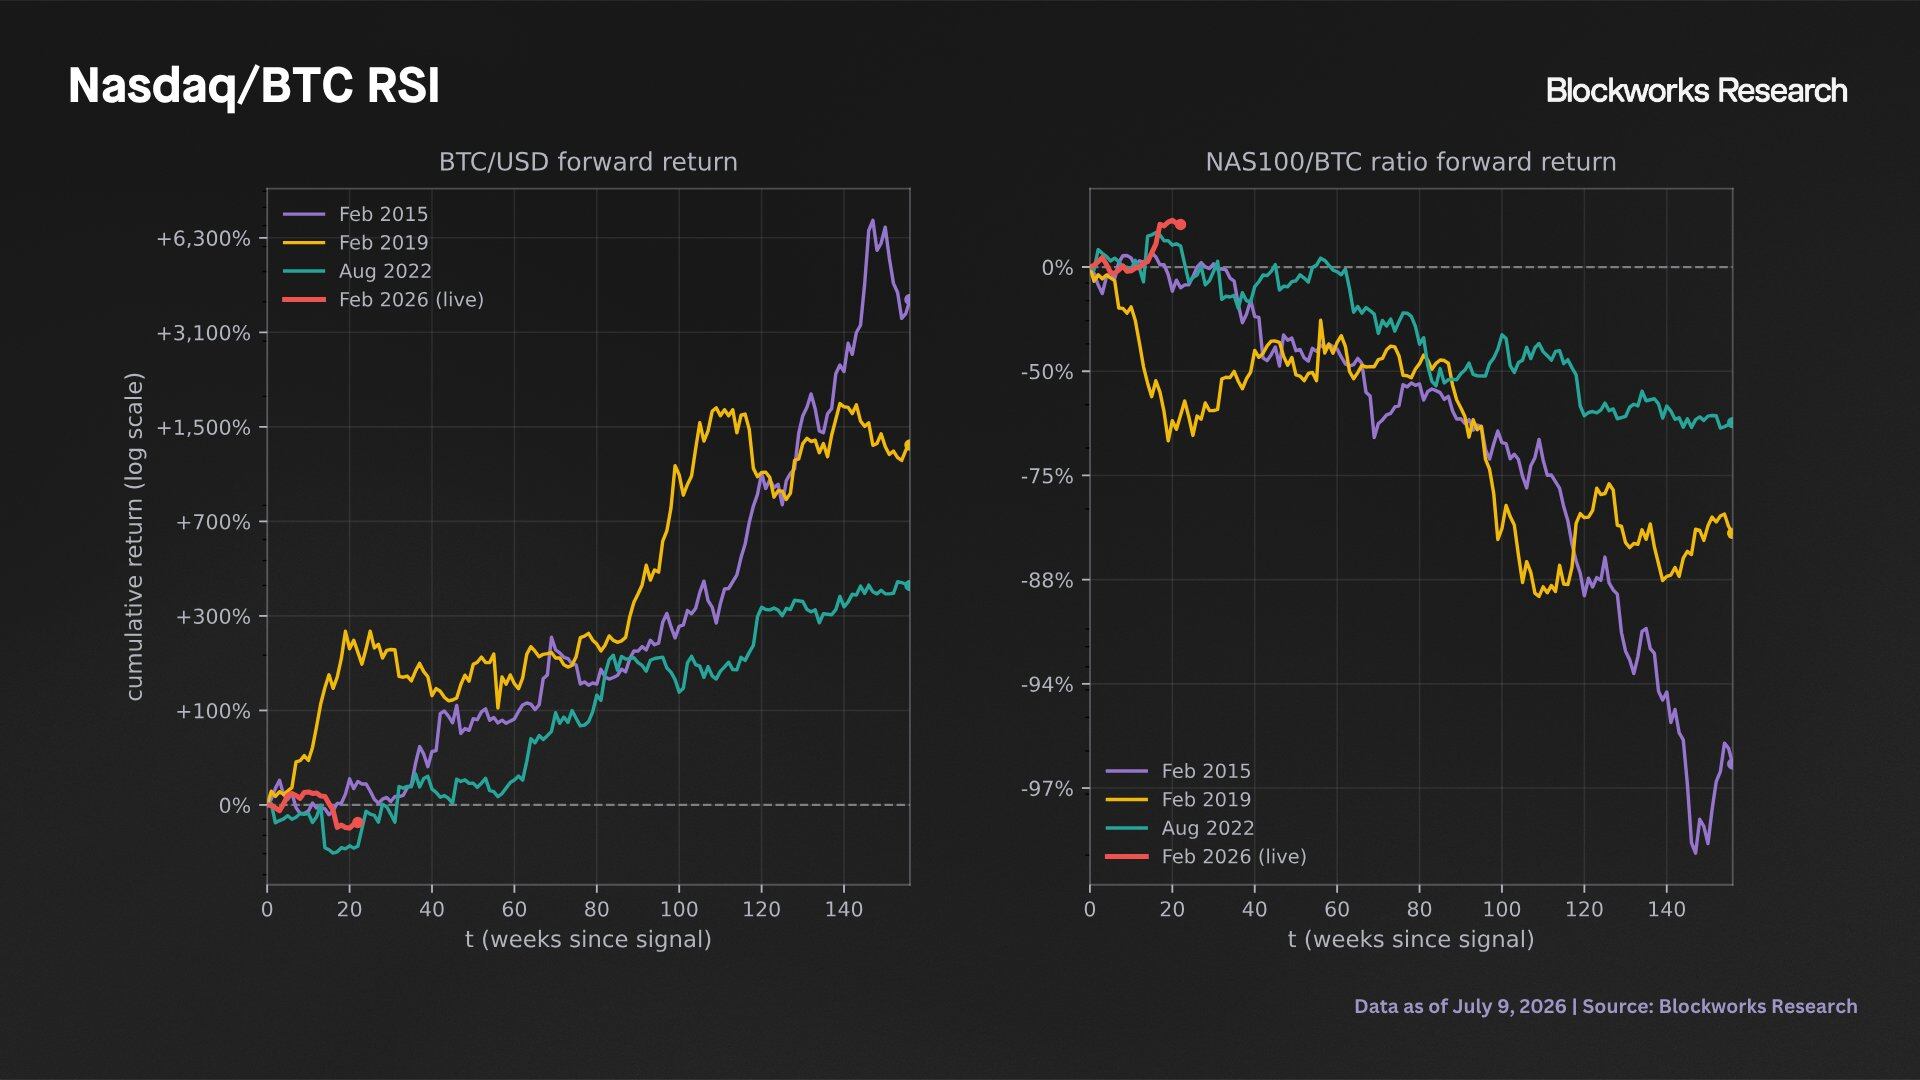
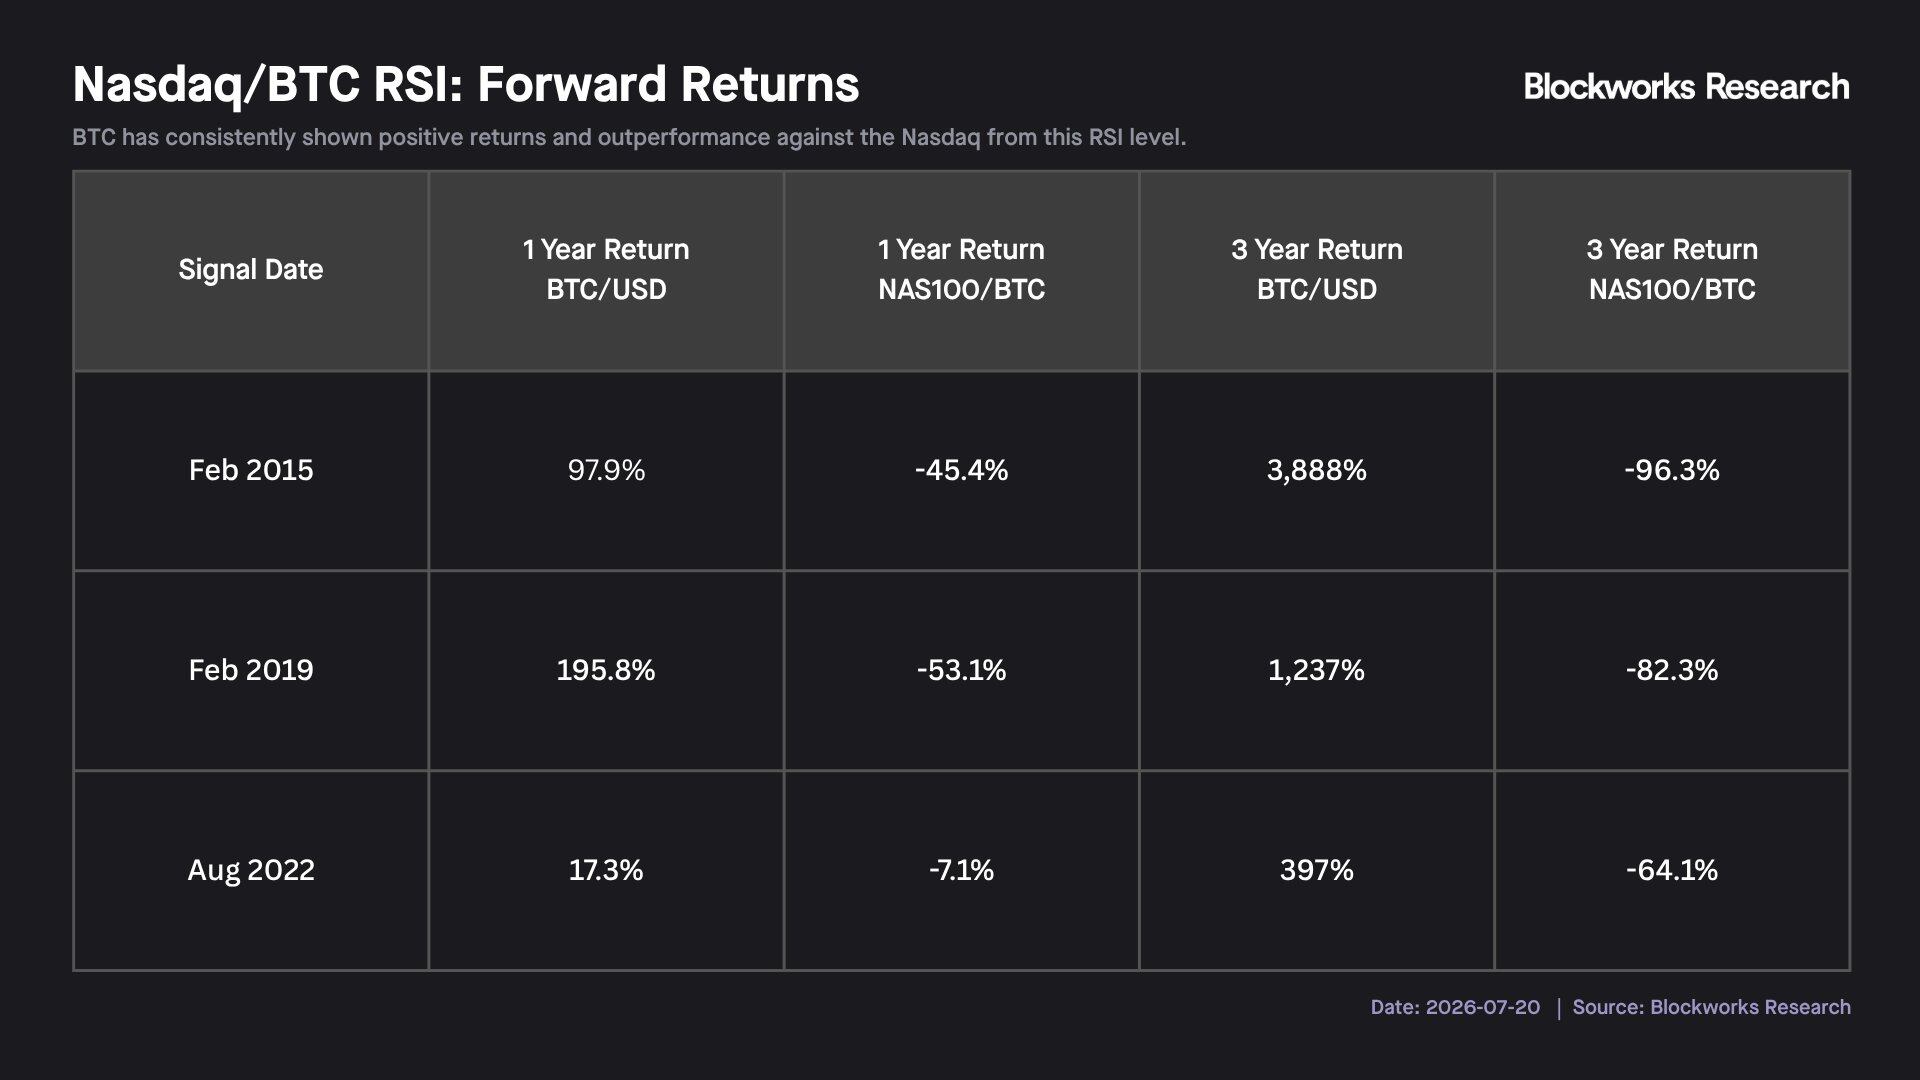
Marked by periods when the Nasdaq/Bitcoin RSI exceeded 66, the expected return profiles for BTC/USD and BTC/NAS100 in the three completed cycles show upside asymmetry, but only over longer timeframes.
Comparison of Expected Return Profiles for BTC/USD and BTC/NAS100
Nasdaq/BTC RSI Expected Returns
This table has two important characteristics:
- Firstly, the timeframe. Short-term expected returns offer little value, as returns over 30-120 days are small and variable in direction. For example, holding Bitcoin in 2022 resulted in a 29.1% loss over 120 days, but a 397% gain over three years. The relative strength signal is not indicative of price direction over the next one to two months.
- Secondly, the decay in return magnitude. The three-year Bitcoin return for each cycle is roughly one-quarter to one-third of the previous cycle, consistent with the law of diminishing marginal returns discussed earlier. In all observations, Bitcoin significantly outperformed the Nasdaq over the subsequent three years.
Indicator 3: Gold/Bitcoin Relative Strength Signal
If the Nasdaq represents Bitcoin's status as a risk asset, then gold represents its status as a monetary store of value.
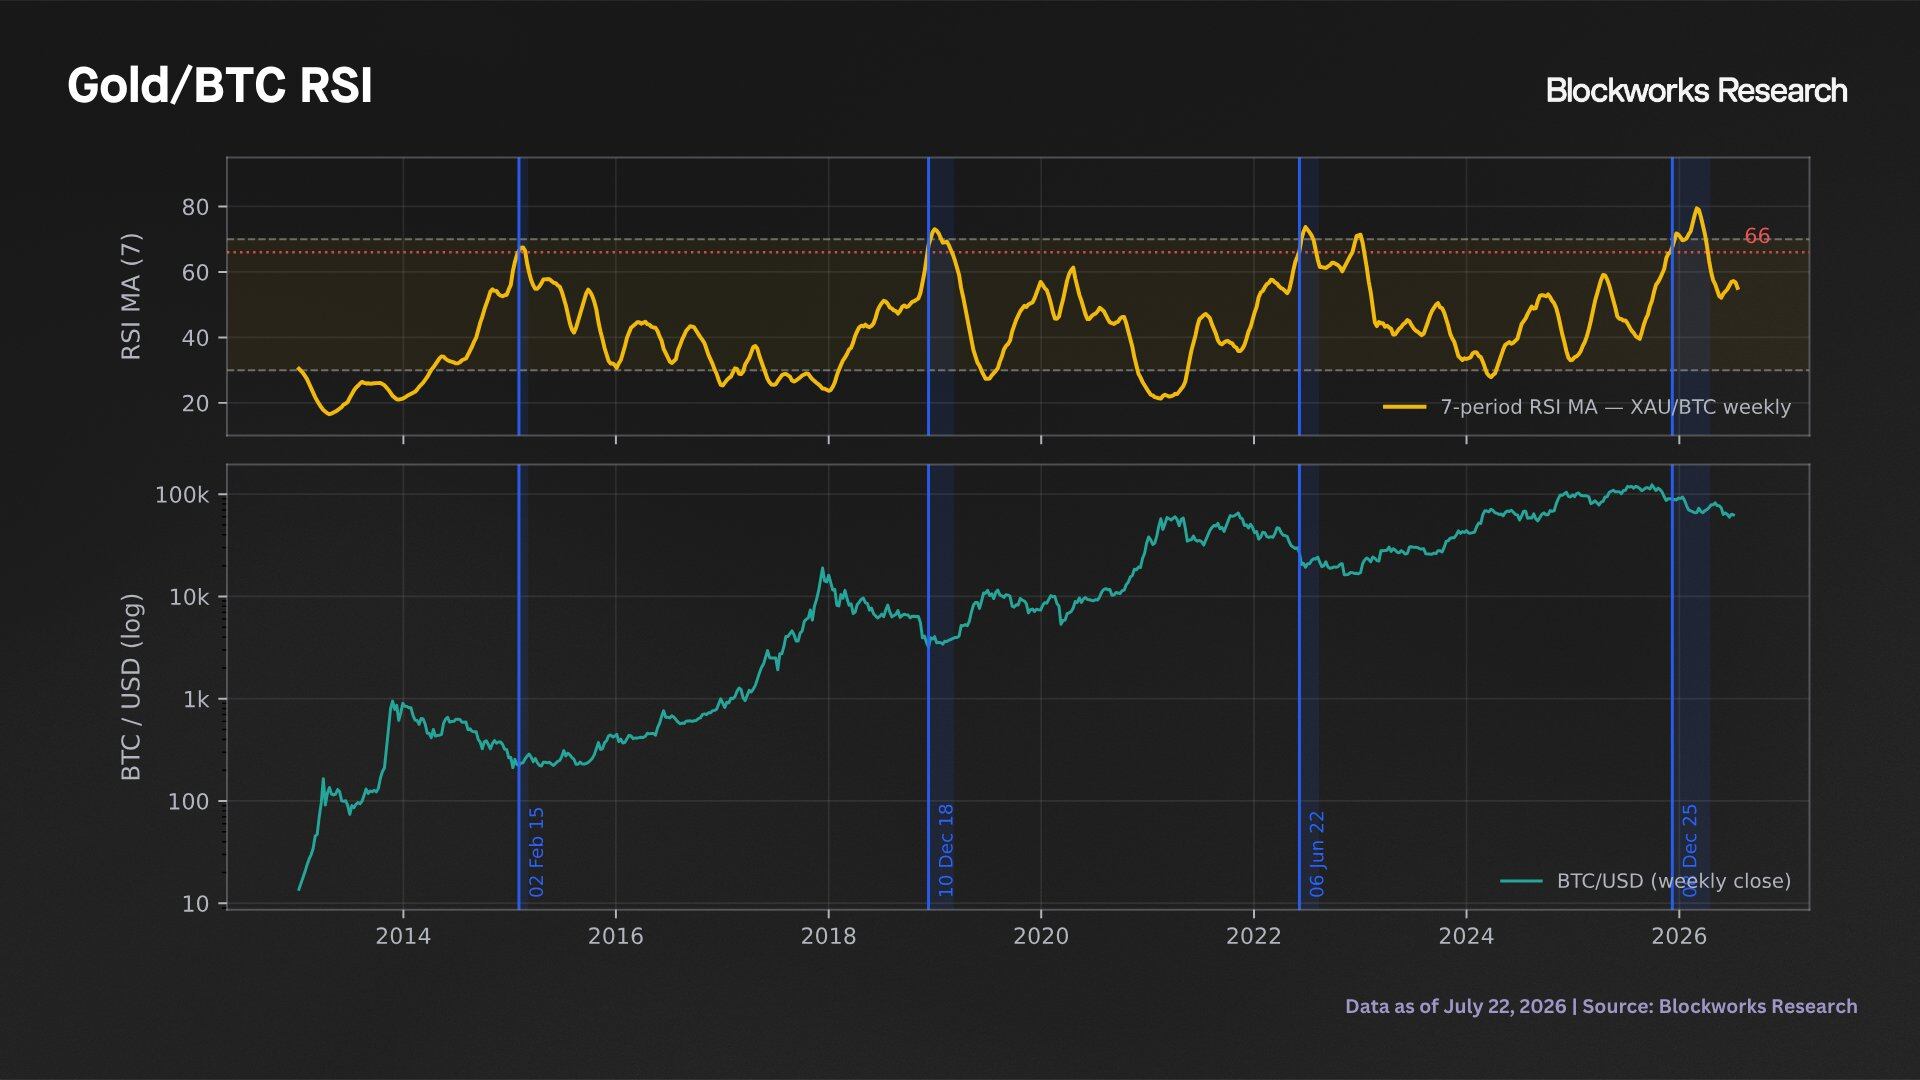
Constructing a similar indicator on the Gold/Bitcoin ratio, we observe similar data: readings above 66 are rare, exhibit mean-reverting properties, and are clustered around extreme values. Based on this indicator, February 2026 represented the most overbought period in the history of the Gold/Bitcoin ratio.
Gold/Bitcoin RSI
Elevated RSI readings for this pair have coincided with long-term cyclical price lows for Bitcoin, demonstrating a characteristic pattern. The expected return profile for this indicator is similar to the Nasdaq study: over 1-3 year timeframes, given such extreme RSI readings, Bitcoin has historically outperformed both Gold and the US Dollar.
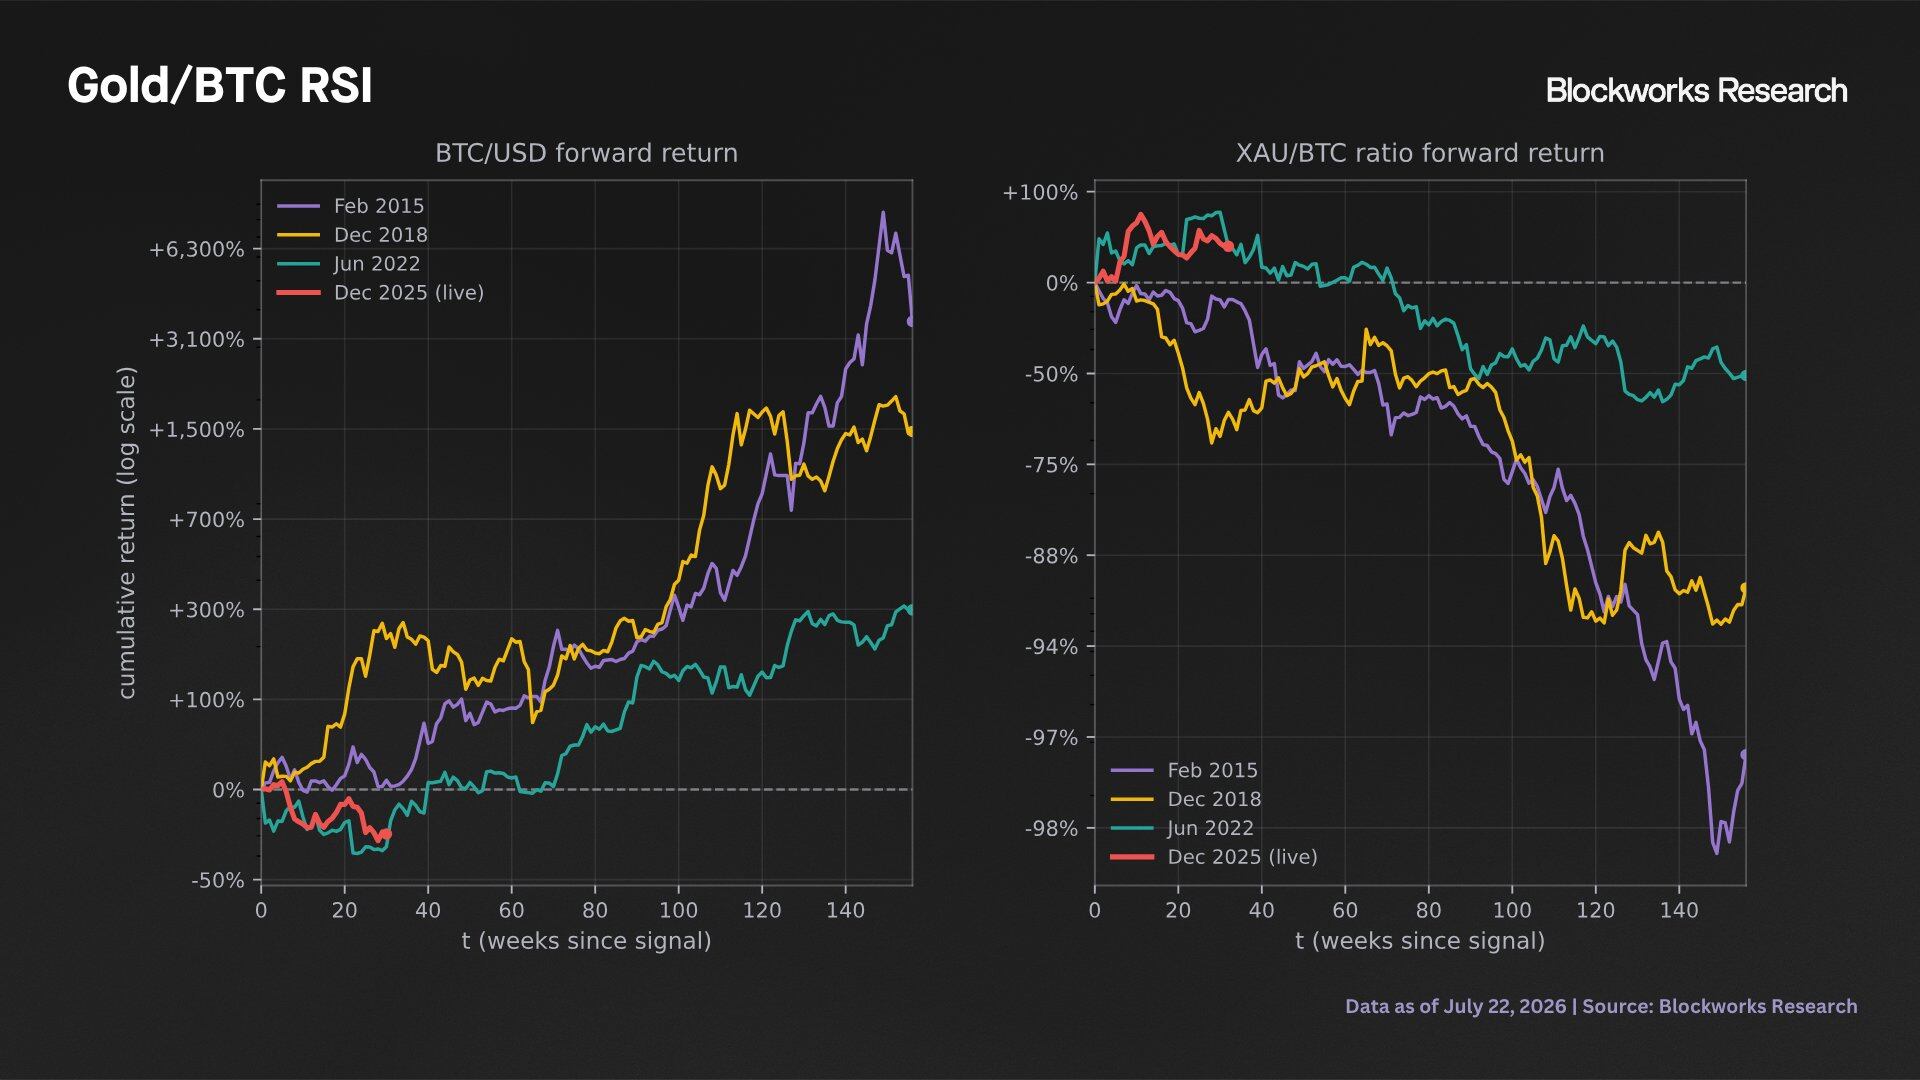
Comparison of Expected Return Profiles for BTC/USD and XAU/BTC
Indicator 4: Bitcoin Realized Price (On-Chain Cost Basis)
Bitcoin's realized price estimates the aggregate on-chain cost basis of all circulating Bitcoin. Unlike the spot price, which reflects the current market value of Bitcoin, the realized price measures the average price at which the existing supply last moved on-chain, thus estimating the on-chain cost. Historically, the realized price has represented Bitcoin's deep value.
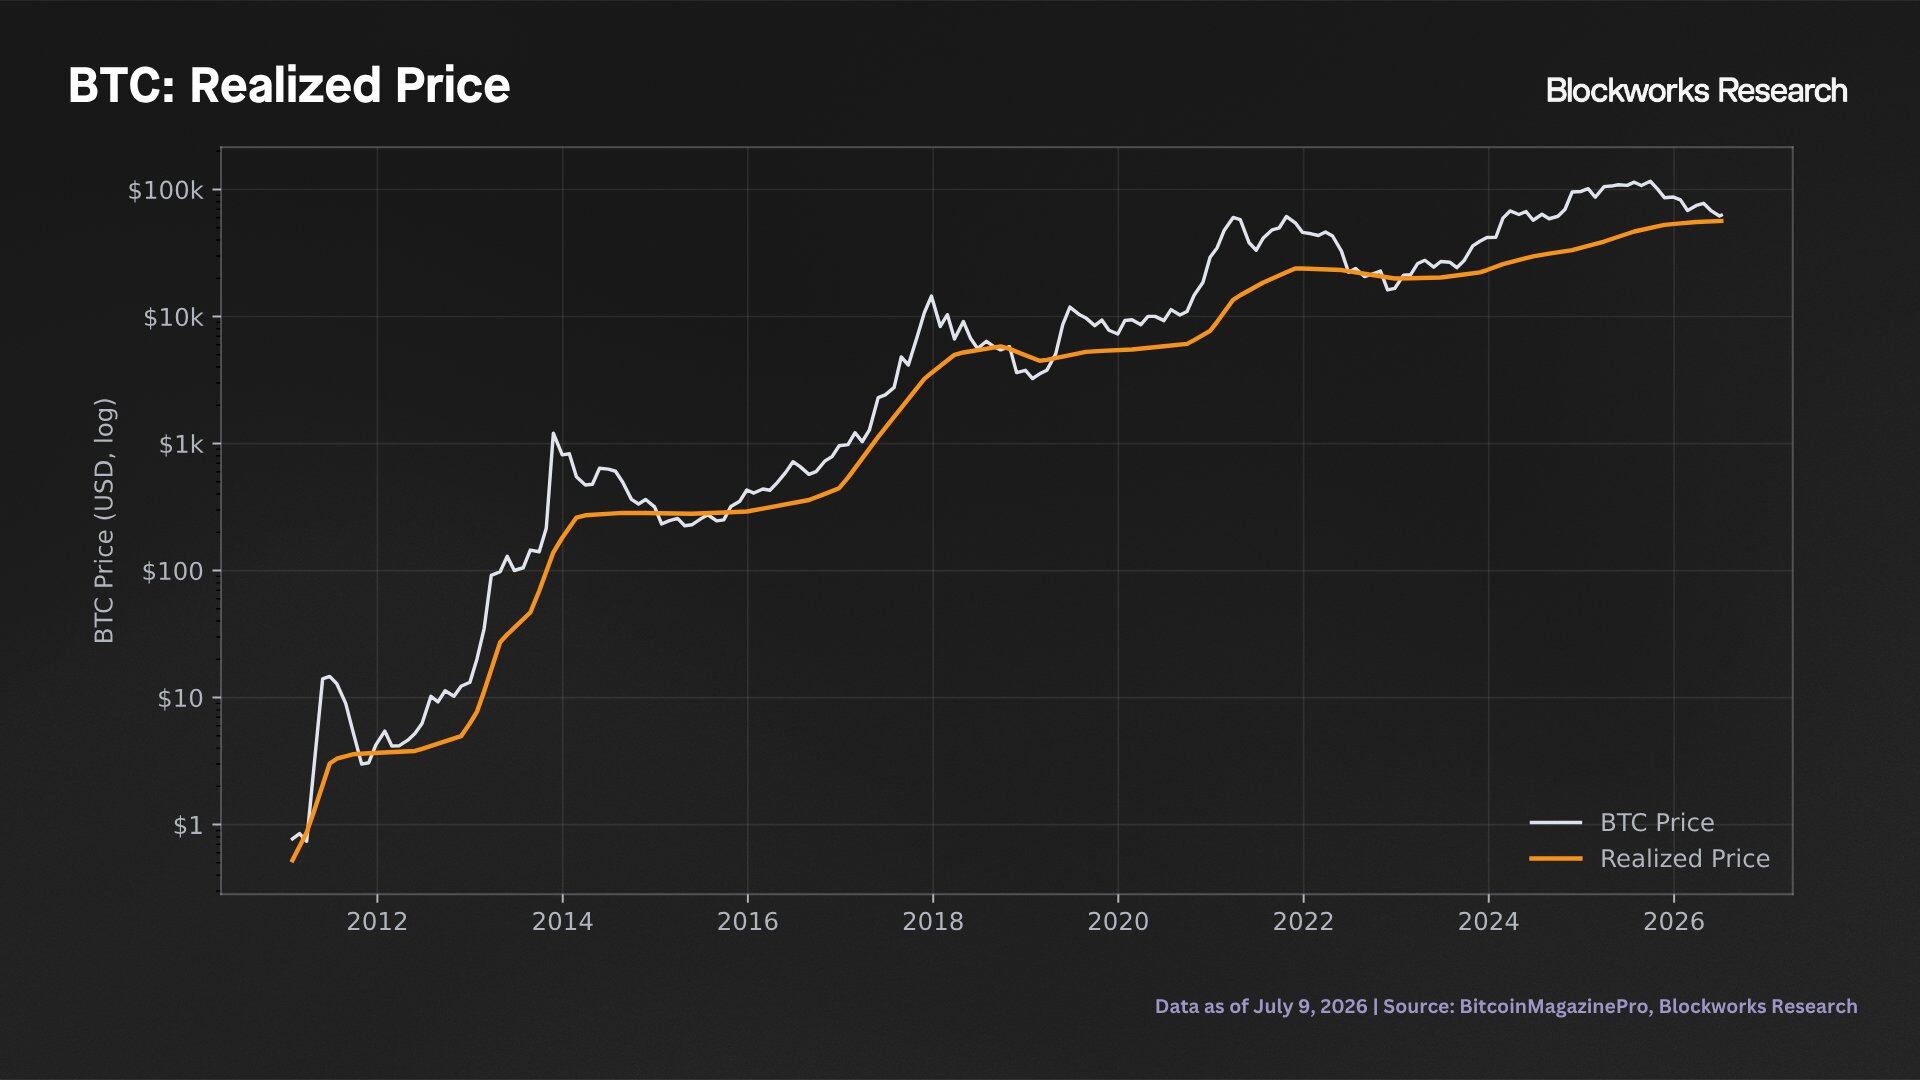
Bitcoin On-Chain Realized Price
The realized price is a reference standard, not a floor. Currently, the realized price is $53,000, 18% below the spot price. Bitcoin's spot price has been below the realized price only 12% of the time in its history.
Similar to the RSI indicators mentioned above, this situation is a tail-end cycle signal. Every bear market low in Bitcoin's history has seen the spot price fall below the realized price, and historically, entering this zone often precedes further price declines before a bottom is formed. Therefore, a drop to or below $53,000 aligns with historical patterns rather than contradicting them.
Starting from entry into this zone, the long-term expected returns have been quite substantial.
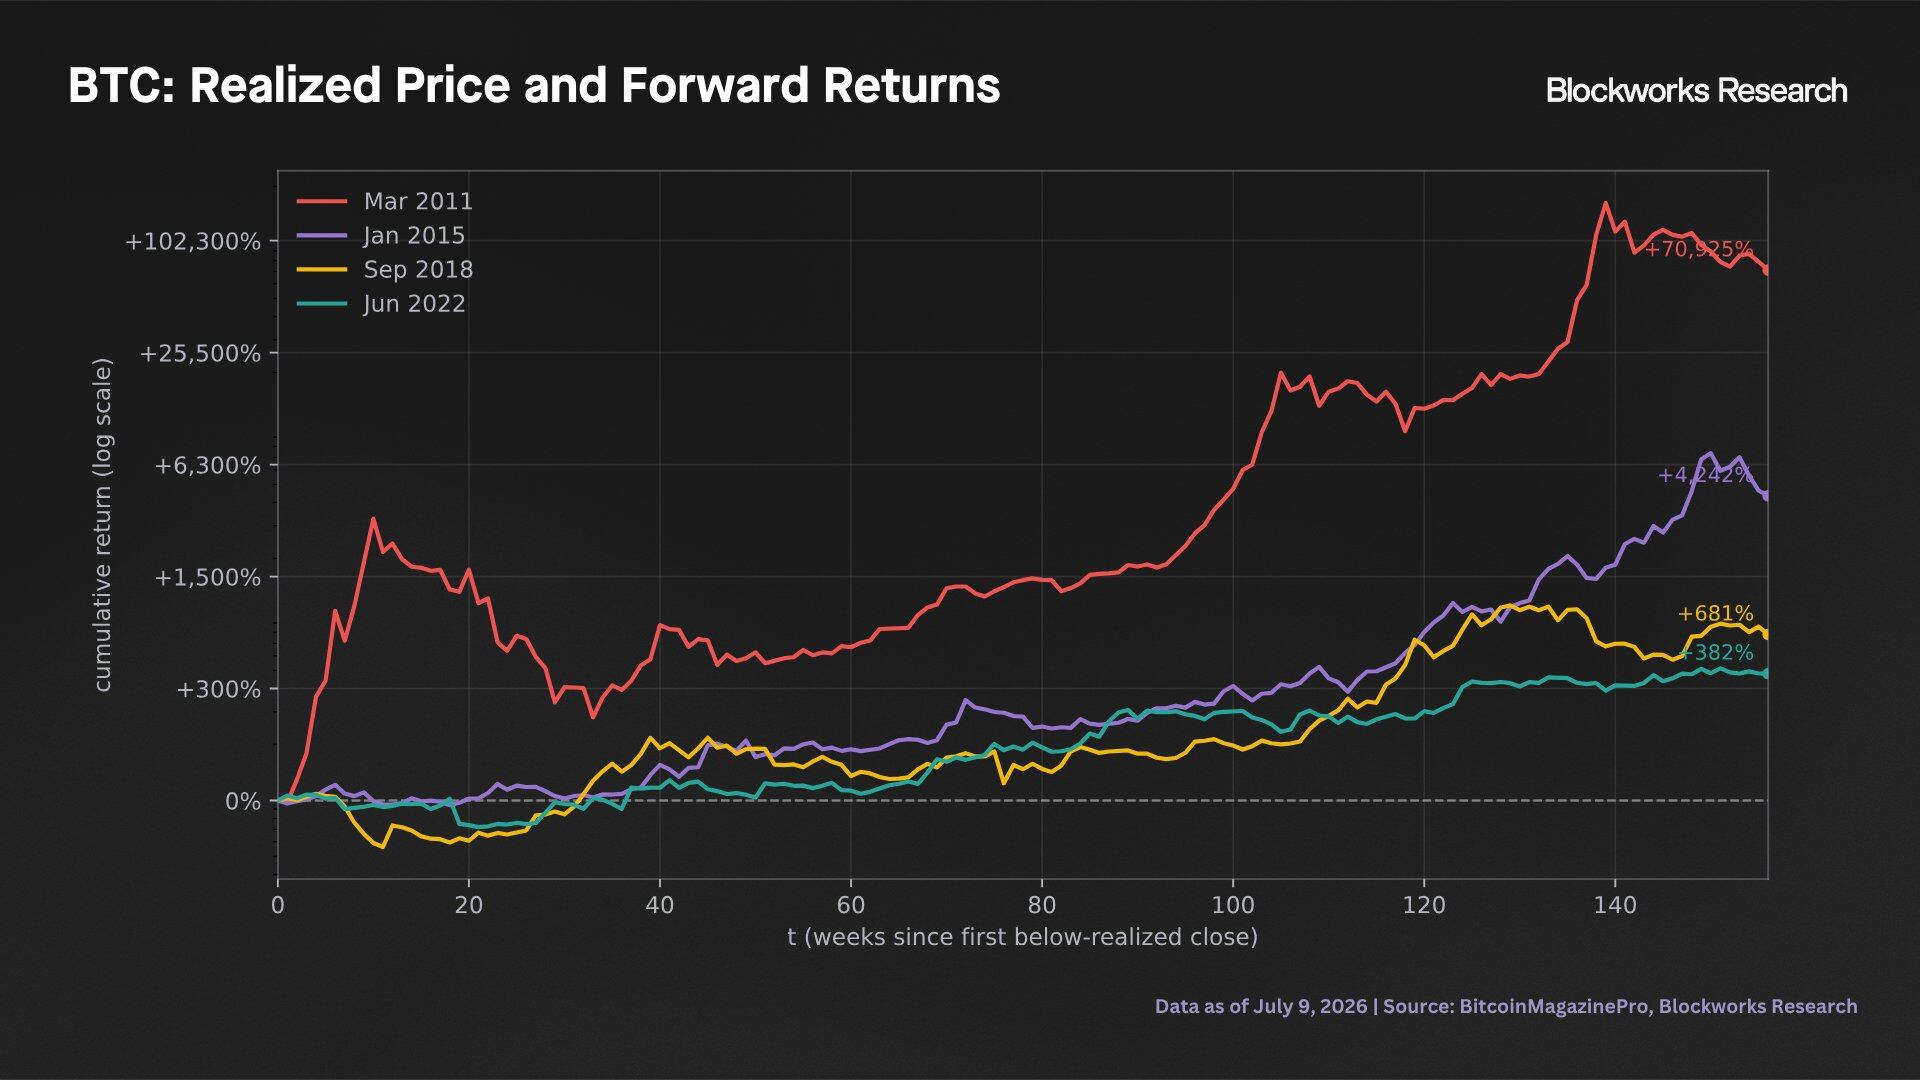
Price Performance After Bitcoin Spot Price Falls Below Realized Price
Calculated from the first weekly close below the realized price in each cycle, historical data shows significant positive returns over the following 150 weeks. The magnitude of these numbers has decreased per cycle, consistent with the decay trend seen in the RSI indicators, but the direction is uniform.
Historically, Bitcoin's first weekly close below the realized price has marked the final phase of a bear market, not its beginning or middle. Nevertheless, the multiple of Bitcoin's spot price to its realized price has pulled back significantly from the previous 2025 highs, indicating reduced market risk.
Indicator 5: Cycle Clock
The last indicator is the most straightforward, illustrating the historical structure of Bitcoin bear markets using price and time as metrics.
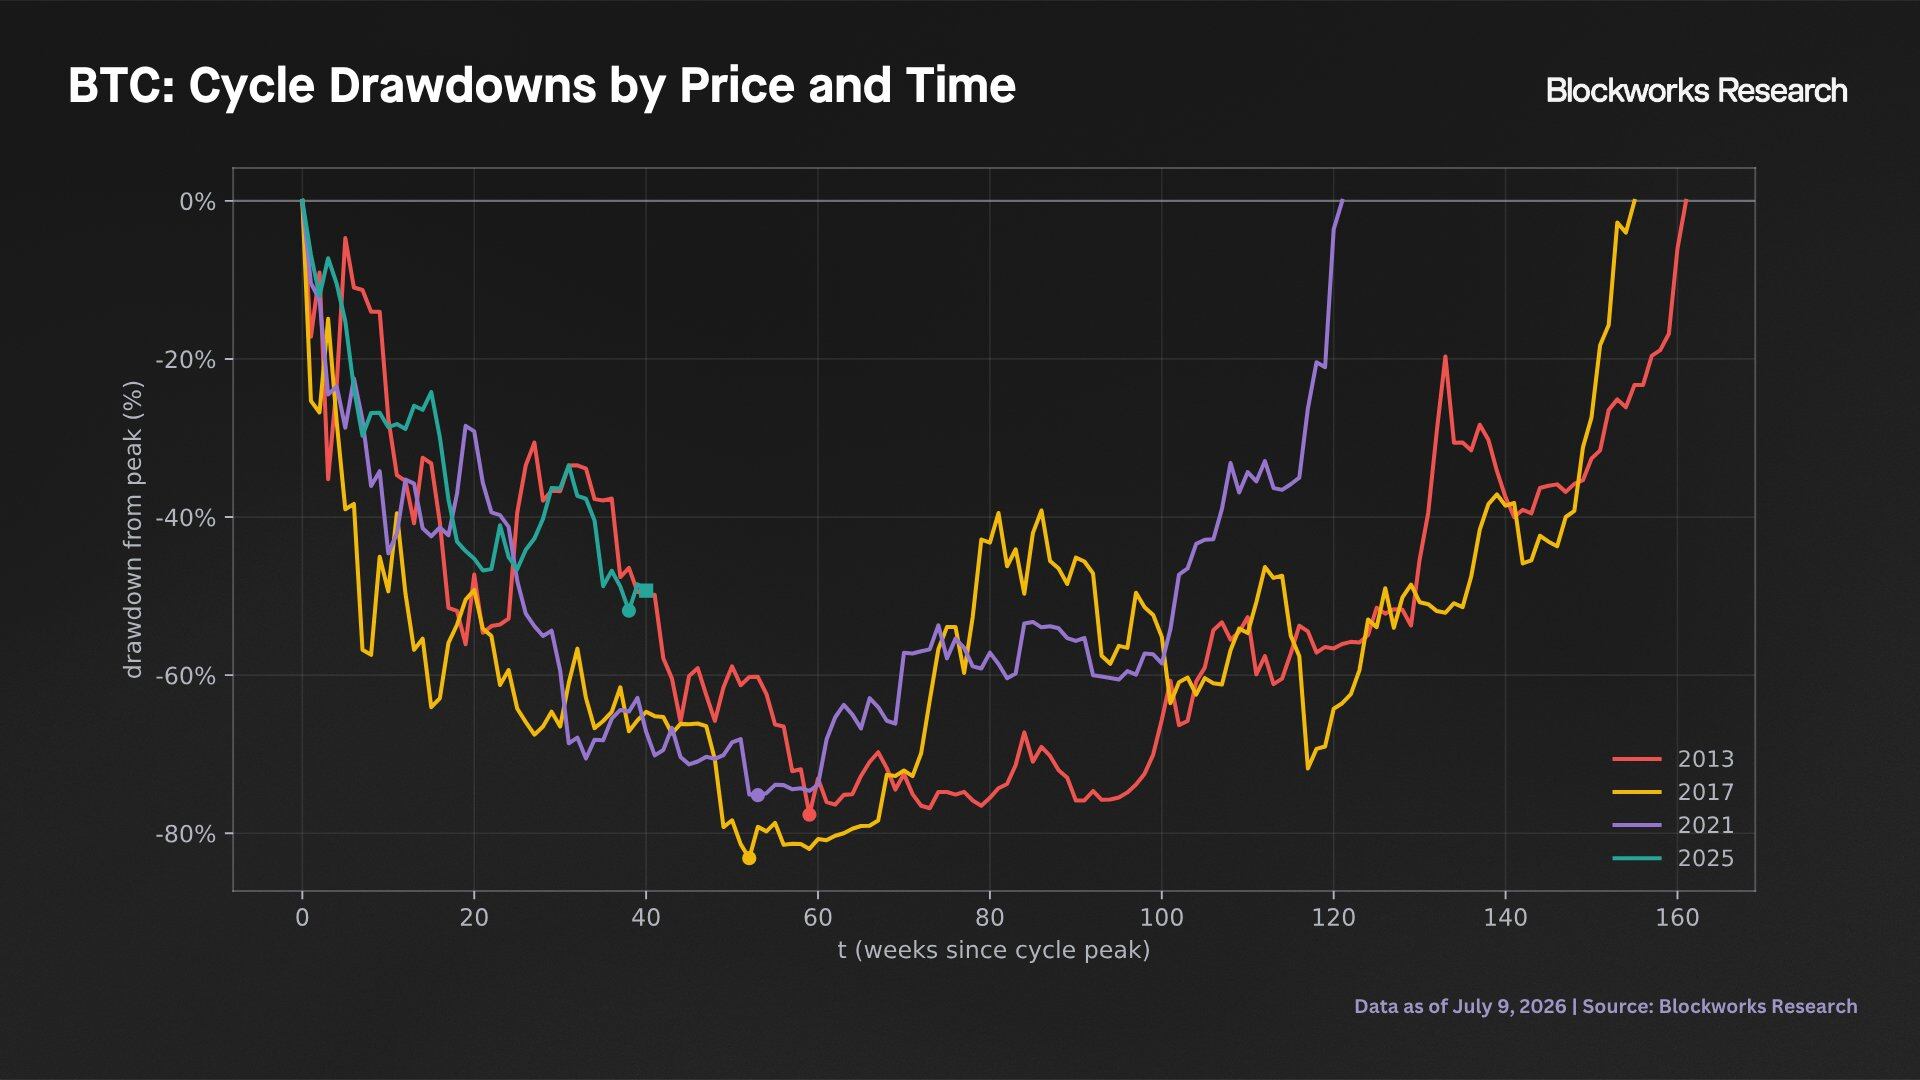
Bitcoin Bear Market Duration
In the cycles of 2013, 2017, and 2021, Bitcoin's price low typically occurred around week 60 after the all-time high. The current cycle is at week 40 with a drawdown of 50%, broadly consistent with the trajectories of the previous three cycles. If the week-60 pattern holds, Bitcoin's low would form around the end of November 2026.
Despite the extreme levels already shown by the Nasdaq 100/Bitcoin and Gold/Bitcoin RSI indices, the drawdown in this cycle still aligns with historical drawdown paths.
The time dimension also shows compression between cycles, with each cycle reaching new all-time highs in a shorter period. In other words, the time taken to reclaim the previous high is shorter than the cycle before. Assuming this trend continues, a new all-time high should occur within 120 weeks of the previous high, implying a new peak before February 2028.
These two observations themselves contain no inherent mechanism; they are purely empirical regularities observed over a few cycles. They serve as temporal anchors, layered on top of the conditional signals mentioned above, bounding Bitcoin's remaining downside. If historical structure holds, Bitcoin is approximately 20 weeks away from its low, or it may have already bottomed.
Bitcoin Price Outlook
Given the current situation, the following scenario combination incorporates the background and historical outcomes described earlier to depict a range of possible paths for Bitcoin over the next three years. This is not a prediction or assertion of likely outcomes, but rather aims to answer a question: If the current situation resolves similarly to how analogous situations have resolved in the past, where might the price head?
Assuming diminishing marginal returns on both upside and downside, an existing discount to the realized price, and referencing historical drawdown paths in price and time, we constructed possibilities for Bitcoin's price trajectory under these conditions. Each possibility is derived from the three-year performance of Bitcoin following a particular signal, scaled with varying intensity (from 0.33 to 0.80) to account for cyclical return compression. The bands in the chart mark the boundaries of the historical distribution after applying reduced intensity, not the boundaries of possible market movement.
The shaded bands illustrate the range of these possibilities.
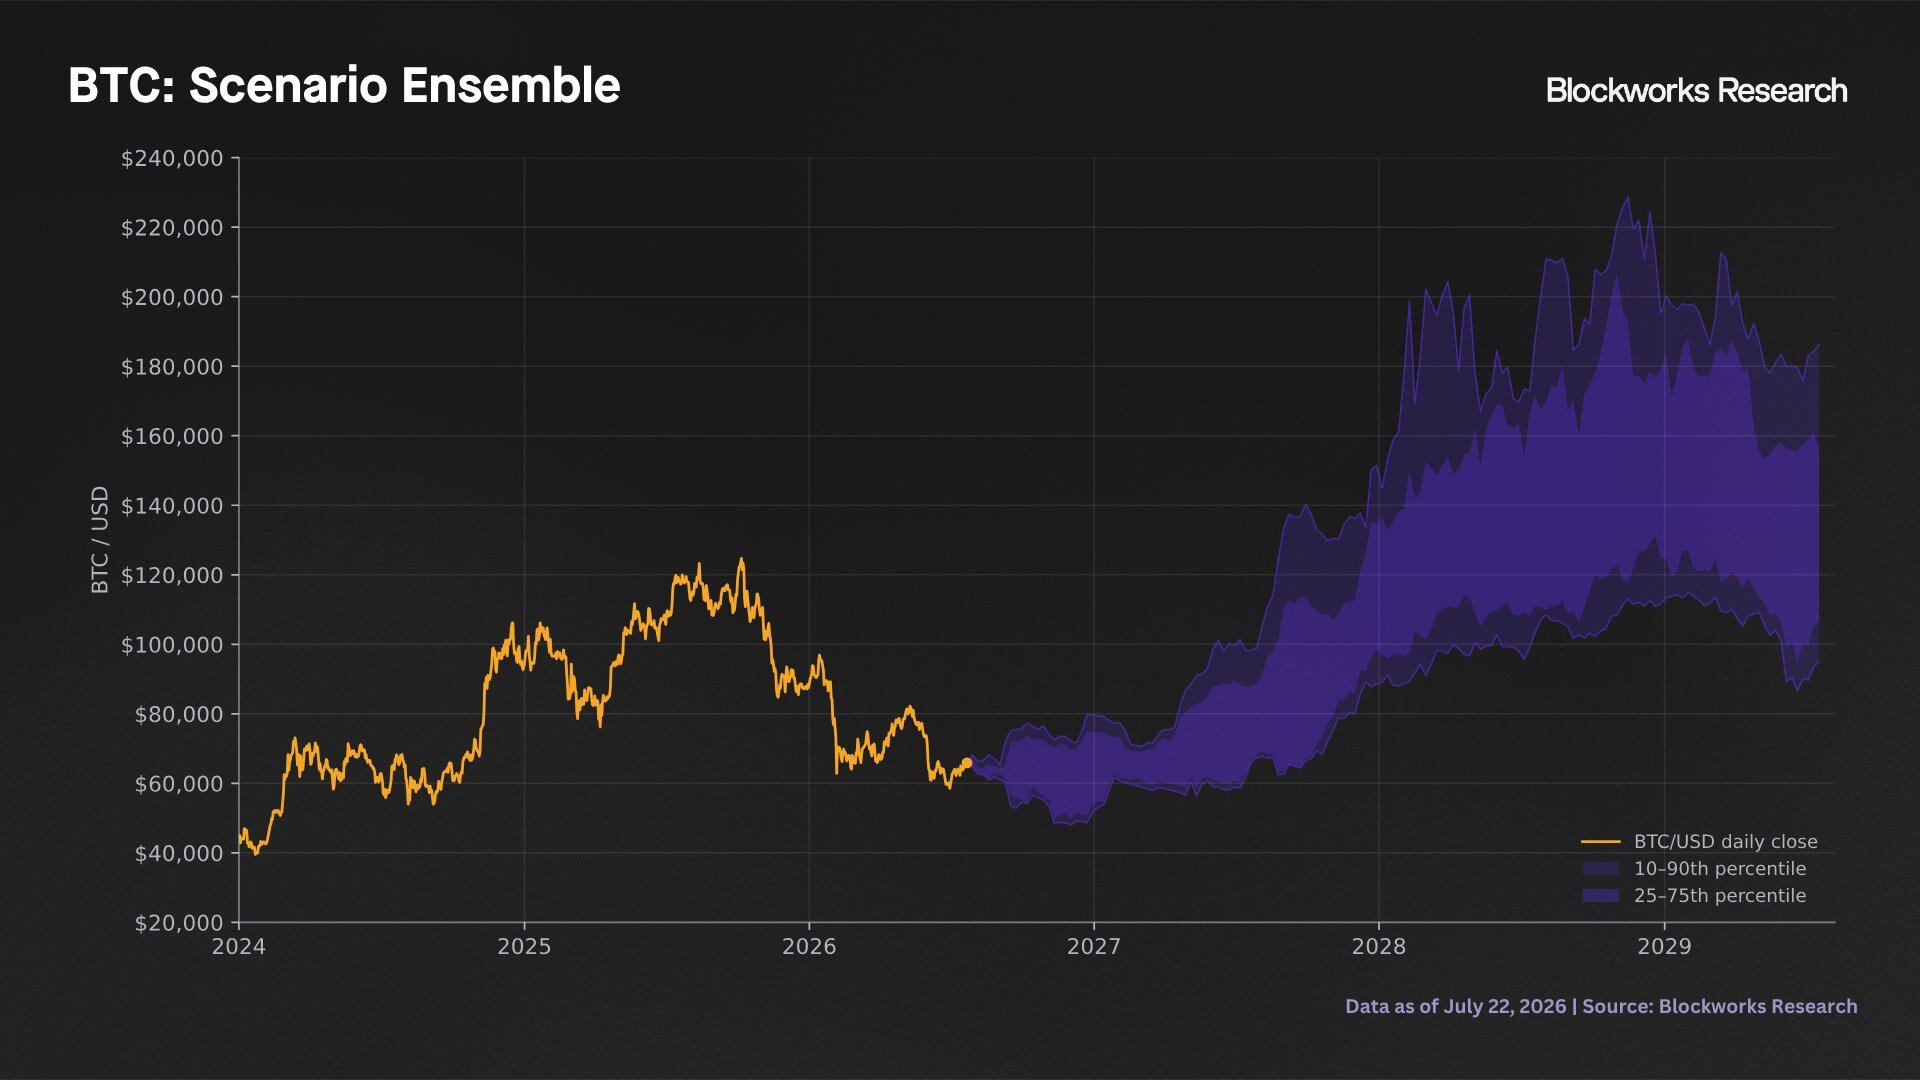
Bitcoin Future Price Trajectory Prediction
These shaded bands are scaled recreations of historical paths following signal generation. All these possible outcomes are satisfactory in that they describe plausible scenarios of history repeating itself, rather than all possible outcomes, and they do not incorporate scenarios where the signals fail.
While returns towards the end of 2026 are expected to be mixed, the distribution of returns turns significantly positive and asymmetrically skewed to the upside by 2027 and 2028. Given the current market environment and projected paths, the coming quarters may present a highly attractive opportunity for long-term investment in Bitcoin.
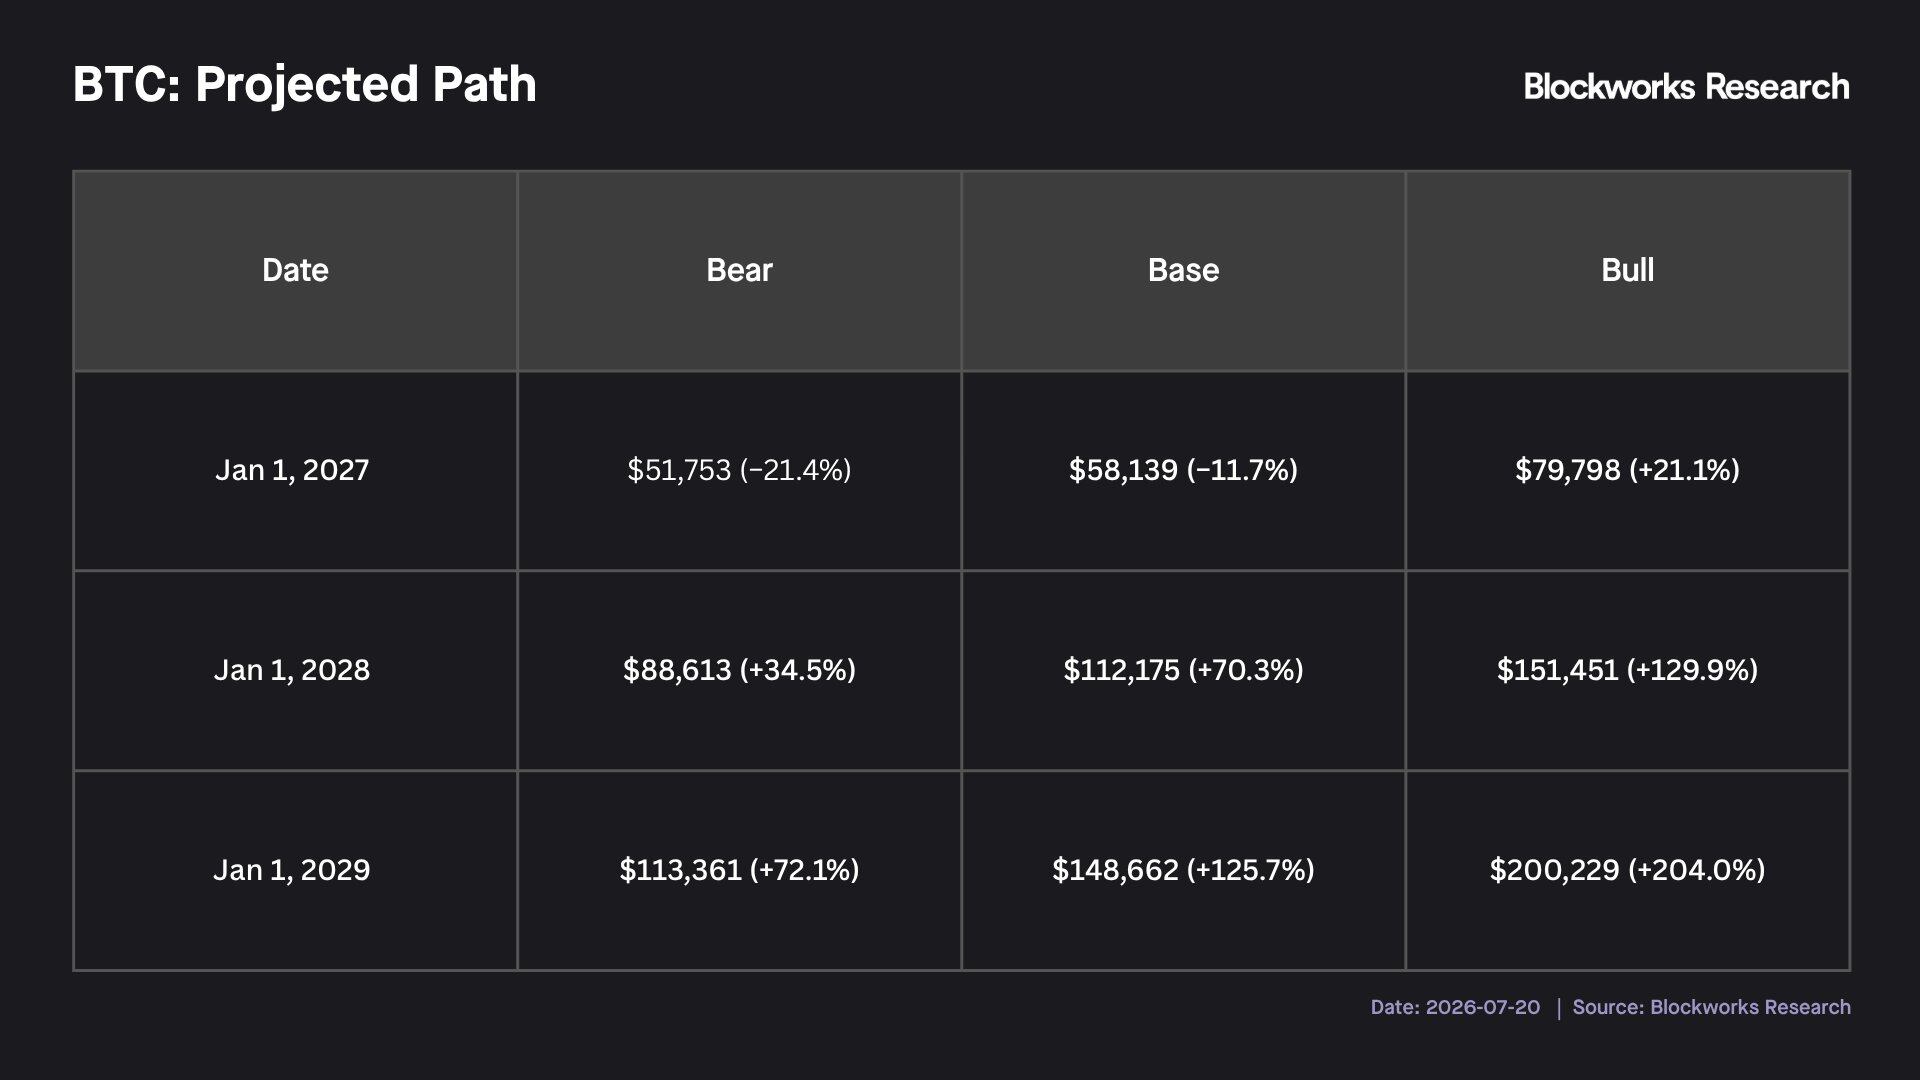
3-Year Bitcoin Price Prediction
Risks and Limitations
Each indicator should be assessed and weighed on its own merits. These indicators should not be interpreted as the mechanism or causal factor for Bitcoin cycle lows, but rather as manifestations that have historically coincided with and characterized long-term cyclical lows.
Furthermore, the listed indicators are not exhaustive of all metrics useful for approximating long-term cyclical price lows. The analysis is based on a small sample size. The RSI moving average shows effective samples from four independent cycles, one of which is yet to be confirmed; the realized price study is based on four cycles, and the cycle symmetry analysis is based on the three completed cycles. With such a small sample size, the historical expected return distribution can describe past behavior, but a deviation in a single cycle would significantly weaken all presented relationships.
Additionally, the presented signals should not be viewed as independent corroborations. The RSI indicators, proximity to the realized price, and the cycle clock position are, to a large extent, different measures of the same underlying fact: Bitcoin has experienced a significant and sustained decline from its highs. During any deep, persistent drawdown, each indicator should be expected to trend towards extremes. Therefore, their simultaneous occurrence may be more akin to a single observation measured in multiple ways, rather than multiple independent and unique observations.
Structural changes could cause this cycle to ultimately diverge. The current cycle is the first to feature ETF holdings, significant corporate ownership, and a more complex derivatives landscape including options and perpetual futures. The four-year cycle framework may eventually prove to be merely a description of four observations, rather than a persistent characteristic of the asset.
Finally, the RSI signals are relative. Bitcoin outperforming the Nasdaq or Gold could mean either that both assets are rising, or that the two assets are declining at different speeds. Even if the RSI signals are favorable for Bitcoin, a pullback in stock markets or gold prices from their current highs could drag down Bitcoin's nominal price. The signals presented here have little predictive power over the next few months and only reflect the asymmetry of price movements over the next 1-3 years.
Conclusion
Considering the aforementioned indicators, the conclusion we arrive at is that Bitcoin is likely at or near a cyclical low, which could form before the end of the year, after which an upward trend is expected to resume.
Each signal has appeared near historically rare extreme values, and each has previously heralded substantial returns for Bitcoin and outperformance against equities in the following years. If the low has not already occurred, the period between now and that low likely represents a highly attractive long-term re-accumulation zone for Bitcoin. These signals have remained inactive for most of history, but they are now flashing a "green light."


