






美国领先经济指数今晚公布,这个指标比美联储会议更早给出衰退与软着陆的答案


- 核心觀點:文章聚焦於即將公布的美國6月領先經濟指數,指出其在聯準會(Fed)議息會議前的政策空窗期具有重要訊號價值。核心問題是判斷經濟改善是真實的實體復甦,還是僅由資產價格驅動的「倒影」。
- 關鍵要素:
- 5月領先經濟指數連續第二個月上升,六個月降幅收窄至0.3%,顯示趨勢改善。
- 但5月改善完全由股價與利率利差等金融分項驅動,非金融面(如消費者預期)依然疲弱。
- 歷史上該指數通常在衰退前11-12個月觸頂,當前六個月增速遠高於約-4%的傳統衰退觸發門檻,指向經濟放緩而非衰退。
- 5月滯後指數(Lagging Index)月增率微降,但六個月變化為正,與領先指數組合指向「軟著陸」的週期中後段特徵。
- 投資者應重點關注非金融分項(特別是消費者預期與新訂單)是否轉正,以此判斷軟著陸敘事的實體側確認。
At 10:00 AM Eastern Time on July 20, the U.S. Conference Board will release the June Leading Economic Index (LEI), the first macro data point to land this week. It deserves serious attention because, with the Fed's Federal Open Market Committee (FOMC) meeting scheduled for July 28-29 still over a week away, the market lacks authoritative policy guidance during this period, and this indicator provides an alternative clue. It does not predict interest rates, but it measures the direction of economic momentum, making it more suitable as a supplementary signal for assessing recession risks, the probability of a soft landing, and corporate earnings outlook. The May reading rose for the second consecutive month, with the six-month decline narrowing to 0.3%, but the driving force came almost entirely from financial components like stock prices and interest rate spreads, while non-financial aspects remained weak. The question this June data needs to answer is straightforward: Is the economic improvement real, or merely a reflection of asset prices?
Key Takeaways
The Conference Board's official announcement confirms that the next release of the U.S. Leading Economic Index is scheduled for Monday, July 20, at 10:00 AM Eastern Time, making it one of the earlier macro data points released this week.
The May reading was 99.3 (with 2016 as the base year of 100), a slight month-over-month increase of 0.1%, marking the second consecutive monthly rise, following an increase of 0.2% in April.
The key improvement lies in the trend: the six-month decline from November 2025 to May 2026 narrowed to 0.3%, significantly smaller than the 1.3% contraction in the preceding six months.
There are concerns about the driving structure. The organization explicitly stated that the May increase was entirely contributed by financial components, especially stock prices and interest rate spreads. On the non-financial front, only the ISM New Orders Index showed some strength, while consumer expectations remained the primary drag.
During the same period, the Lagging Economic Index stood at 120.5, down 0.1% month-over-month, but its six-month change was solidly positive at 0.9%. The combination with the Leading Index points towards slowing growth rather than a recession.
Historically, this index typically peaks 11 to 12 months before the start of a recession. The current negative territory of the six-month growth rate is not yet close to the traditional recession trigger threshold of approximately negative 4%.
Why This Data is Particularly Important This Week
A Substitute Signal in a Policy Vacuum
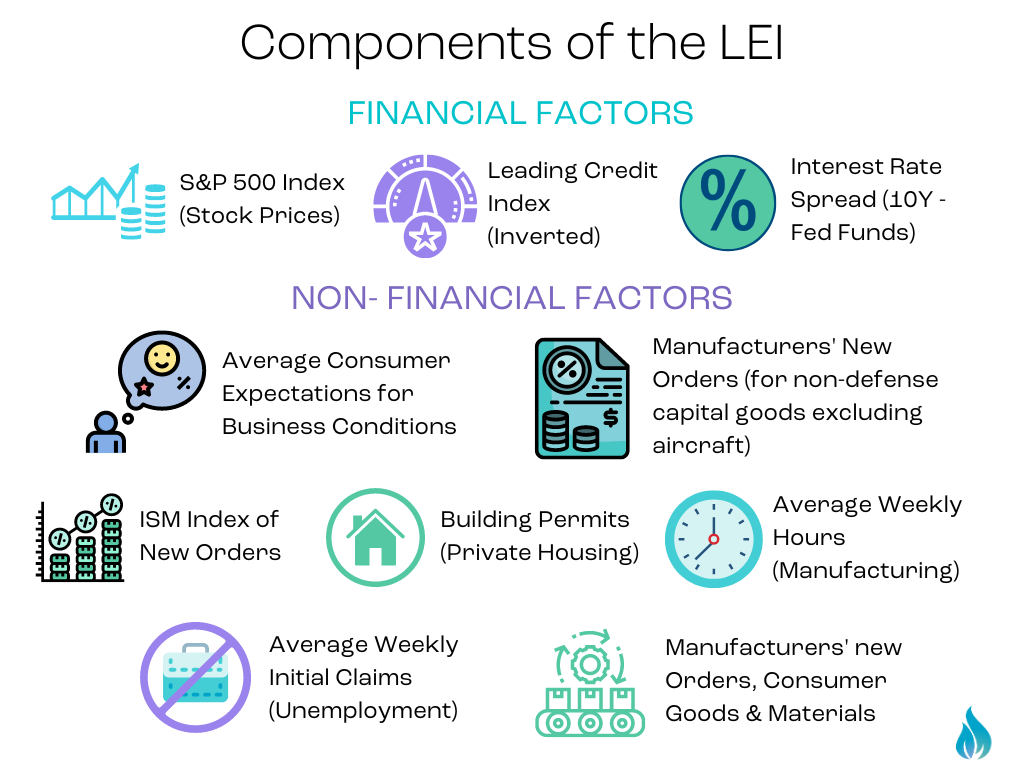
Its timing determines its significance. The Fed's FOMC meeting is not until July 28-29, meaning from today until next Tuesday, the market lacks official policy guidance. In such a vacuum, any data with forward-looking attributes is likely to be amplified. The Leading Economic Index comprises ten components, covering new orders, building permits, initial jobless claims, consumer expectations, stock prices, and interest rate spreads. It measures not the current economic state but the direction of momentum over the coming quarters. This is precisely why it is suitable as a supplementary signal rather than a trading signal.
It's Not for Predicting Interest Rates
One thing needs to be clear: this indicator is not suitable for betting on the Fed's next move. Among its ten components, stock prices and interest rate spreads are themselves products of market pricing. Using it to predict interest rates is methodologically close to a circular argument. Its real purpose is to answer three other questions: the direction of recession risk, the credibility of the soft-landing narrative, and the support for corporate earnings in the coming quarters. The impact of these three factors on the pricing of stocks, credit, and risky assets can be no less significant than the wording change in a single meeting statement.
The Foreshadowing from the May Reading
The Numbers Themselves Show Improvement
The May data released on June 18 showed the Leading Economic Index edged up 0.1% month-over-month to 99.3, rising for the second straight month. More importantly, the six-month change: the decline from November 2025 to May 2026 was only 0.3%, compared to a contraction of 1.3% in the prior six months (May 2025 to November 2025). This three-quarters reduction in the decline represents the most significant trend improvement since 2025.
But the Driving Structure is Unhealthy
The organization provided a candid qualification in the same announcement. Justyna Zabinska-La Monica, Senior Manager of Business Cycle Indicators, explicitly stated that the May increase was entirely driven by financial components, particularly stock prices and interest rate spreads. On the non-financial side, only the ISM New Orders Index showed some strength, while consumer expectations remained the primary drag. She also emphasized that despite two consecutive months of increase, the index's six-month and twelve-month growth rates remain negative, pointing to slowing economic expansion ahead.
This structural issue is key to understanding the June data. If the June improvement continues to depend on stock prices, then what this indicator reflects is less a repair of the real economy and more a self-reinforcement of asset prices. A truly convincing signal would be non-financial components like consumer expectations, new orders, or building permits starting to turn positive.
How to Interpret Recession Signals and the Soft Landing Narrative
Three Dimensions for Assessment
The organization evaluates the severity of downside signals using three dimensions: duration, magnitude of decline, and breadth of diffusion. Historical patterns show that the Leading Economic Index typically peaks 11 to 12 months before the start of a recession. Tracking by Recession Dashboard notes that while the current six-month growth rate is negative, it is far above the traditional recession trigger level of around negative 4%. The organization's judgment is one of slowing, not recession.
Another technical detail worth noting is whether the diffusion index falls below 50. In mid-2025, the index was below 50 for several consecutive months, triggering a recession signal. Recent readings, however, show this pressure has eased. The position of the diffusion index in the June data will be a direct window into the strength of the signal.
Reading in Conjunction with the Lagging Index
Looking at the Leading Index in isolation can be misleading; cross-referencing it with the Lagging Index is more reliable. The May Lagging Index stood at 120.5, a slight month-over-month decline of 0.1%, but its six-month change was a positive 0.9%, significantly stronger than the flat reading in the prior six months. A weakening Leading Index combined with a strengthening Lagging Index is a classic feature of the mid-to-late cycle, typically corresponding to a state of slowing growth that has not yet stalled – the soft-landing scenario often discussed by the market. If the June data shows an improvement in the Leading Index alongside a weakening Lagging Index, it would signal a more substantive change in the cyclical position.
What This Means for Investors
Three Transmission Channels
The first is the corporate earnings channel. Components like new orders and consumer expectations lead corporate revenues by approximately two to three quarters. Their direction directly relates to management's outlook for the second half of the year in the upcoming earnings season. The second is the risk appetite channel. If the data confirms the soft-landing narrative, tolerance for valuations in risk assets will rise. Conversely, if non-financial components continue to deteriorate, the market will start pricing in downward earnings revisions. The third is the policy expectation channel. While this indicator doesn't directly impact the July decision, it influences market pricing for the path in September and beyond.
For cross-asset investors, macro turning points often first manifest in such forward-looking indicators before transmitting to risk assets. Digital assets are also influenced by this chain. Investors tracking the correlation between macro variables and crypto assets can observe price reactions during risk appetite shifts on MEXC.
Potential Risks and Observation Points
There are three types of risks. First, interpretation risk: this is a monthly indicator with significant single-month volatility. The six-month growth rate and diffusion index are much more informative than the month-over-month figure. Drawing conclusions based on just one month's data is prone to error. Second, structural risk: if improvement continues to be driven by stock prices, the index could reverse quickly if the stock market corrects. This type of improvement, propped up by asset prices, lacks resilience. Third, lag risk: historically, this indicator peaks 11 to 12 months before a recession. This lead time means it is good at signaling direction but poor at timing. Using it for market timing is almost certain to fail.
Going forward, it's also crucial to watch if this release includes an annual benchmark revision. Historically, such revisions recalculate the complete historical series of the index, making the revised level values and month-over-month changes non-comparable with previously published data. This is a technical pitfall easily overlooked when interpreting the data.
Exclusive View from the MEXC Crypto Pulse Research Team
What truly matters about this data isn't whether it can predict a recession, but that it quantifies one of the most pressing current questions: Is the economic improvement real, or is it a self-fulfilling result of financial asset prices? The May reading provided an uncomfortable answer: the rise came entirely from stock prices and interest rate spreads. When an indicator measuring the outlook for the real economy is primarily propped up by asset price components, it loses some degree of information value independent of the market. Whether the June data can break this cycle is far more important than whether the headline reading rises or falls by a few tenths of a percentage point.
There are two areas where the market might misinterpret the data. First, mistaking two consecutive months of increase as confirmation of a turning point. The six-month and twelve-month growth rates remain negative; these smoothed indicators are the true arbiters of the trend. The month-over-month figure contains much more noise than signal. Second, trading this indicator as if it were a forward guide from the Fed. Its ten components already embed market pricing itself. Using it to derive the policy path is logically circular. The risk lies in mistaking market sentiment for independent evidence.
The most important thing for investors to focus on next is not the headline reading, but the component structure. Specifically, whether non-financial components, especially consumer expectations and new orders, begin to contribute positively. If this happens, the soft-landing narrative will gain confirmation from the real side. If they continue to drag, then the current improvement is merely a byproduct of the stock market bull run, and its sustainability is entirely dependent on risk assets themselves.
The lesson for crypto and cross-asset markets is this: during a policy vacuum, the market's sensitivity to any forward-looking data will systematically increase. As high-beta assets for liquidity and risk appetite, digital assets often exhibit more volatile swings than stocks at such junctures. Understanding the transmission chain of macro data is more valuable than chasing the rise or fall of a single number. This is also why, in the week leading up to the FOMC meeting, understanding the structure of the leading indicator is more important than memorizing its value.
Frequently Asked Questions
When is the U.S. Leading Economic Index Released?
The Conference Board is scheduled to release the June reading on Monday, July 20, 2026, at 10:00 AM Eastern Time, making it one of the earliest macro data points this week. The previous release was on June 18, covering the May data. The index is published monthly, usually alongside the Coincident Economic Index and the Lagging Economic Index. Investors can access the full press release and component data on the organization's official website.
What Exactly Does This Index Measure?
It is composed of ten components covering manufacturing new orders, building permits, initial jobless claims, consumer expectations, stock prices, and interest rate spreads. Its design purpose is to signal peaks and troughs in the business cycle. It measures not the current state of the economy but the direction of momentum over the coming quarters. Historically, the index typically peaks 11 to 12 months before the start of a recession, making it better suited for judging direction than timing.
What Was the Previous Reading?
The May reading was 99.3 (with 2016 as the base year of 100), a slight month-over-month increase of 0.1%, marking the second consecutive monthly rise, following a 0.2% increase in April. More noteworthy is the trend improvement: the six-month decline from November 2025 to May 2026 narrowed to 0.3%, significantly smaller than the 1.3% contraction in the preceding six months. However, the organization explicitly stated that the rise was entirely driven by financial components like stock prices and interest rate spreads, and the six-month and twelve-month growth rates remain negative.
Will This Data Affect the Fed's July Decision?
The direct impact is limited. The Fed's FOMC meeting is scheduled for July 28-29, and its decision will primarily be based on inflation and employment data. The index's ten components already include market-pricing products like stock prices and interest rate spreads, making its use for deriving the policy path a circular argument. It is better suited as a supplementary signal for recession risk, soft-landing probability, and corporate earnings outlook, rather than an interest rate prediction tool.
Does the Current Reading Mean Recession Risk is Rising?
The organization's current assessment is one of slowing, not recession. Although the six-month growth rate is still negative, it is far above the traditional recession trigger threshold of around negative 4%, and the decline is narrowing. Over the same period, the Lagging Index's six-month change is a positive 0.9%, and its combination with the Leading Index points to slowing growth that hasn't stalled. Judging recession signals requires synthesizing the three dimensions of duration, magnitude of decline, and breadth of diffusion. Data from a single month is insufficient to draw a conclusion.
Which Specific Components Should Investors Focus On?
The component structure holds more information than the headline reading. The most critical is whether non-financial components can turn positive, particularly consumer expectations (currently the main drag) and manufacturing new orders (which lead corporate revenues by about two to three quarters). If these components begin to contribute positively, the soft-landing narrative will gain confirmation from the real economy. If improvement continues to be supported by stock prices, the index could reverse quickly in a market correction, as this type of improvement lacks resilience.
What is the Connection Between This Macro Indicator and the Crypto Market?
The link lies in the transmission of risk appetite. Digital assets are high-beta assets for liquidity and risk appetite. The direction of macro momentum influences the pricing of crypto assets through the risk appetite channel. During the Fed's policy vacuum, market sensitivity to any forward-looking data increases, and crypto assets often exhibit more volatile swings than stocks. Furthermore, if the data points to pressure on corporate earnings, tolerance for valuations across overall risk assets decreases, and digital assets are not immune to this effect.
Disclaimer
This content is for informational and research discussion purposes only and does not constitute any investment advice, financial advice, legal advice, tax advice, or trading recommendation. Prices of crypto assets, stocks, and related financial instruments can fluctuate significantly. Macroeconomic indicators are subject to revision and lag, and historical patterns do not guarantee future results. Third-party data and institutional announcements cited may be delayed, revised, or contain errors. Readers should conduct their own verification. Any investment decisions should be based on individual independent research, financial situation, and risk tolerance. Consultation with a licensed professional should be sought when necessary. The MEXC Crypto Pulse team assumes no responsibility for any direct or indirect losses arising from the use of the information contained in this content.


