






Where is the oil price heading? A comprehensive analysis of the energy market under the shadow of the Iran conflict


- Core Viewpoint: The US-Israel military conflict in February 2026 led to the near-blockade of the Strait of Hormuz, causing a daily supply disruption of approximately 14 million barrels of crude oil. Brent crude surged to $138/barrel and then fluctuated at high levels. The market generally underestimates the time lag between diplomatic agreements and supply restoration. Even if a ceasefire is achieved, the full normalization of oil supply will not occur until 2027, which determines that oil prices in the second half of 2026 will exhibit a pattern of "low prices with high volatility."
- Key Elements:
- Unprecedented Scale of Supply Shock: The daily disruption of approximately 14 million barrels of crude oil is more than three times the scale of the 1973 Arab oil embargo. In March, global oil supply plummeted by 10.1 million barrels per day in a single month.
- Dramatic Price Swings: Brent crude soared from below $80 to a peak of $138 on April 7, and as of May 26, 2026, it remains fluctuating at high levels within the $97-$105 range.
- Significant Supply Recovery Lag: ADNOC states that even if the conflict ends immediately, the full resumption of traffic through the Strait of Hormuz would not be possible until the first or second quarter of 2027 at the earliest, limiting the downside for oil prices even after a peace agreement is reached.
- Divergent Institutional Forecasts: The EIA predicts Brent's average price in 2026 will be around $96, Goldman Sachs has lowered its forecast to $85, Morgan Stanley holds a hawkish view at $110, and Macquarie has even proposed an extreme scenario of $200.
- Macro and Crypto Market Linkage: Oil prices above $100 suppress expectations for Fed rate cuts, exerting macro pressure on risk assets; concurrently, in some regions, demand for BTC and USDT as alternative stores of value and cross-border remittance tools may rise.
Overview
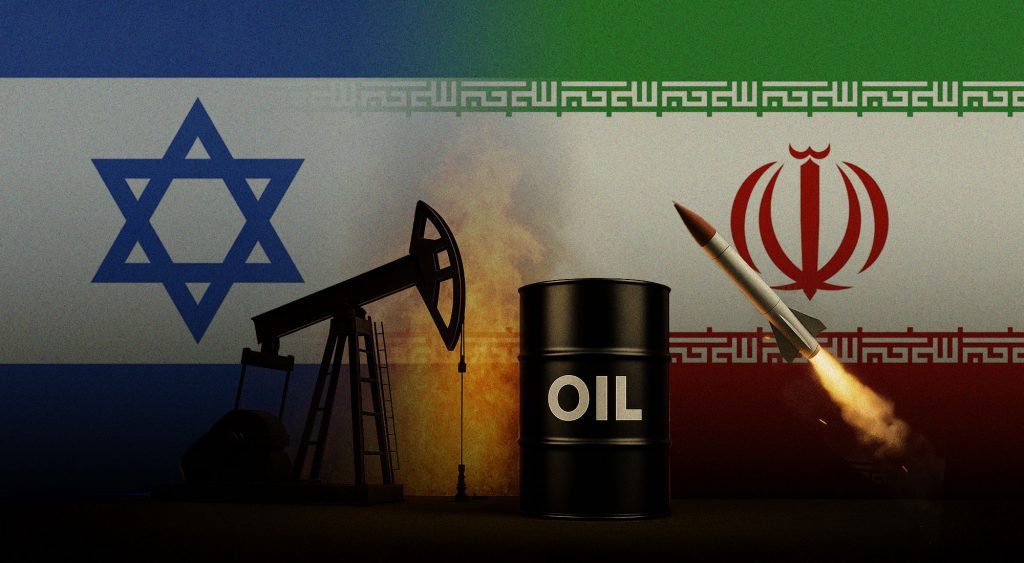
On February 28, 2026, the joint US-Israel military operation officially commenced, plunging the global energy market into its most severe supply shock since the 1973 oil crisis. The Strait of Hormuz—a critical waterway carrying approximately 20% of the world's daily crude oil and liquefied natural gas shipments—nearly ground to a halt. Brent crude surged from under $80 per barrel to a peak of $138 within weeks of the conflict's outbreak, then gradually retreated amid peace talk expectations. However, as of May 26, 2026, prices remained elevated, fluctuating between $97 and $105 per barrel.
The impact of this geopolitical storm has extended far beyond the Middle East. Global inflation is reigniting, gas prices at pumps in many countries have risen sharply, and costs for high-energy-consuming industries such as aviation, chemicals, and shipping have skyrocketed. Simultaneously, this crisis has presented unprecedented market opportunities for commodity traders and digital asset investors.
Key Takeaways
The effective blockade of the Strait of Hormuz disrupts the supply of approximately 14 million barrels of crude oil per day, more than three times the scale of the 1973 Arab oil embargo
Brent crude peaked at $138/barrel and is currently (May 2026) consolidating in the $97–105/barrel range
The U.S. Energy Information Administration (EIA) latest forecast: Brent average price for 2026 is around $96/barrel, falling to $89/barrel in H2 as the Strait of Hormuz gradually reopens
Goldman Sachs lowered its Q2 Brent forecast to $90/barrel, maintaining Q3 at $82 and Q4 at $80
An ADNOC official explicitly stated that even if the conflict ends immediately, full restoration of navigation through the Strait of Hormuz would not occur until Q1 or Q2 of 2027 at the earliest
Oil price trends are highly dependent on diplomatic progress, with each round of peace talk signals triggering significant price volatility
1. Why Is This Conflict So Unique?
Historically, instability in the Middle East has frequently impacted oil prices, but the severity of this disruption is unprecedented. According to data from the International Energy Agency's (IEA) April Oil Market Report, global oil supply plummeted by 10.1 million barrels per day in March 2026 to 97 million barrels per day, marking the largest single-month decline in modern history.
The fundamental reason is that the Strait of Hormuz previously facilitated the daily passage of approximately 20 million barrels of oil, covering major exports from Saudi Arabia, Iraq, the UAE, and Kuwait. According to ICIS analysts' assessments, the conflict has resulted in a loss of approximately 14 million barrels per day of Middle Eastern oil production, a gap that no overland alternative route can bridge.
Compared to the 1973 Arab oil embargo, which removed only about 4 to 5 million barrels per day from the market yet caused a fourfold price increase and triggered economic recessions in many countries, this shock is three times larger in absolute scale. Meanwhile, modern economies' dependence on energy has not substantially decreased.
2. Price Timeline: From Outbreak to Present
Early March 2026 (Conflict Outbreak): After the US and Israel launched strikes on Iran, WTI futures surged 24.6% in a single day to $113, with Brent rising to around $114. According to a Fortune magazine report, Dow Jones futures crashed over 1,000 points on the same day.
Peak Phase (March to April): As the situation escalated, IEA data shows Brent spot prices hit a historic high of $138 per barrel on April 7, with the monthly average for April reaching $117/barrel. Asian market middle distillate prices briefly surpassed $290/barrel during this period, setting a new all-time high.
Declining Phase (April to May): The signing of a two-week ceasefire agreement provided a noticeable respite for the market. An investigative report by CBS News noted that the average US retail gasoline price briefly rose to $4.06 per gallon, a peak for recent years, but subsequently declined slightly from its apex as diplomatic contacts unfolded.
Current Situation (Late May): Brent is quoted in the range of approximately $103 to $105 per barrel. US Secretary of State Rubio publicly stated that there are "fairly solid proposals" on the negotiating table. A Washington Times report shows that oil prices briefly fell to $97.90 on Monday, the first time dipping below the $100 mark in nearly a month.
3. Diplomatic Progress ≠ Supply Normalization: The Easiest Detail to Overlook
Many market participants equate "ceasefire" with "falling oil prices." This is a dangerous miscalculation.
According to public statements from an ADNOC official, even if the conflict ends immediately, the most optimistic estimate for restoring navigation through the Strait of Hormuz to pre-war levels is Q1 or Q2 of 2027. The reason is that normalization of the strait is a phased physical process: upstream oil wells need safety inspections before resuming production, port infrastructure requires repair and assessment, tanker carriers need to recalculate voyage risk premiums, and both buyers and sellers need to rebuild supply chains.
ICIS analyst Kojo Orgle further pointed out that even with a rapid physical reopening of the strait, the actual tight supply situation in the oil market is expected to persist for at least three months or longer after a resolution is reached. This suggests that the downside for oil prices is also limited after any peace agreement is finalized.
4. Comparison of Latest Forecasts from Major Institutions
There is significant divergence among various institutions regarding the full-year 2026 Brent average price forecast, with the core variable pointing to the timeline for the Strait of Hormuz's reopening:
U.S. Energy Information Administration (EIA): The May Short-Term Energy Outlook forecasts an average Brent price of about $106/barrel for May and June. As Middle Eastern production gradually recovers in the second half of the year, the Q4 average is expected to fall to $89, bringing the full-year average to around $96.
Goldman Sachs: In a research report covered by Bloomberg, Goldman Sachs raised its 2026 full-year Brent average forecast to $85, characterizing the shock as the "largest supply shock ever." Subsequently, as peace talk signals emerged, Goldman Sachs lowered its Q2 forecast to $90, maintained Q3 at $82, and set the baseline Q4 expectation at $80.
Morgan Stanley: Its Q2 Brent forecast is as high as $110/barrel, the most hawkish among major institutions, based on the belief that supply recovery will be much slower than the market anticipates.
Macquarie Group: According to an analysis report from Seeking Alpha, Macquarie estimates that if the conflict continues until the end of Q2 and the Strait of Hormuz remains closed, oil prices could reach an extreme scenario of $200/barrel.
Fitch-owned BMI: Has raised its 2026 Brent average price forecast by $8.5/barrel.
J.P. Morgan: In pre-war forecasts, J.P. Morgan estimated the 2026 Brent average at around $60, but this projection was made before the conflict erupted and its current reference value has significantly diminished.
5. Three Scenario Projections: Where Could Oil Prices Go?
Scenario 1: Peace Agreement Reached, Strait of Hormuz Gradually Reopens (Baseline Scenario)
This is the primary direction currently priced into the market. If a phased agreement is reached between the US and Iran before June, Brent is expected to gradually decline from its current level above $100 to the $80 to $90 range in the second half of 2026, potentially approaching the EIA's forecast of around $70 by year-end. However, as previously mentioned, full supply normalization will still take several quarters.
Scenario 2: Negotiations Collapse, Conflict Continues (Stress Scenario)
If diplomatic processes stall again and the Strait of Hormuz blockade persists, oil prices could retest levels above $120, and the extreme scenario of $200 proposed by Macquarie would no longer be just a theoretical number. EY-Parthenon senior economist Lydia Boussour, in an interview with CBS News, explicitly stated that even if the conflict ends, the "lagging effects" on the supply chain will persist throughout 2026.
Scenario 3: Unexpected OPEC+ Production Increase Provides Relief (Mitigation Scenario)
The rhetoric from OPEC+ about increasing production is persistent. However, as Discovery Alert's analysis points out, several core OPEC+ member states are themselves affected by the conflict. An increase in paper quotas does not equate to an increase in actual delivered supply. Even so, record-high production from non-OPEC countries like the US and Brazil represents one of the true variables that could moderate oil prices.
6. How Oil Price Turmoil Impacts Cryptocurrencies and Investor Strategies
The dramatic fluctuations in crude oil prices are not solely a topic for traditional energy investors.
Inflation and Macro Linkages: Every $10/barrel increase in oil prices typically pushes global CPI up by approximately 0.3 to 0.5 percentage points. With current oil prices still above $100, expectations for Federal Reserve rate cuts are likely to remain suppressed, creating a macroeconomic headwind for risk assets, including cryptocurrencies.
Risk Aversion and Capital Flows: During periods of escalating conflict, capital tends to flow towards gold and the US dollar. However, historical data shows that in some regions (such as economies facing Iranian currency devaluation or increased sanctions), on-chain transaction volumes for BTC and USDT typically rise concurrently, serving as tools for alternative store of value and cross-border transfers.
Commodity Trading Opportunities: For investors looking to capture trading opportunities amidst oil price volatility, MEXC offers diversified trading products, including crude oil-related contracts. Coupled with one of the deepest trading pair liquidity pools and leverage options up to 200x, it provides flexible tools for professional traders.
7. Exclusive Insights from the MEXC Crypto Pulse Research Team
The core logic of the current oil market lies in a time-lag problem that the market generally underestimates: the diplomatic timeline and the supply recovery timeline are two fundamentally different curves. The market's rapid reaction to each piece of peace talk news implicitly assumes a false premise—that the risk to oil prices will dissipate the moment an agreement is signed.
We believe that crude oil trading in the second half of 2026 will exhibit a peculiar pattern: the overall price range will shift lower (declining from above $110 to the $80 to $90 range), but volatility will not narrow correspondingly. Each round of negotiation progress or breakdown will trigger daily price swings of several dollars or even over ten dollars. This "lower price, high volatility" environment is a trap for trend-following position traders but a window of opportunity for short-term traders who can precisely capture event-driven moments.
Another aspect worth noting is that high oil prices are systematically improving the drilling economics of non-OPEC US production regions, particularly the Permian Basin. US crude oil production could hit new highs in the second half of 2026. If Middle Eastern supply gradually recovers in 2027, the market will face dual incremental pressure from high US output and revived Middle Eastern production, and the subsequent price adjustment could be far more significant than current expectations.
FAQ
Q: How significant is the impact of closing the Strait of Hormuz on global oil prices?
A: The Strait of Hormuz is the world's most critical crude oil shipping lane, with approximately 20 million barrels of crude oil and LNG passing through daily under normal conditions, accounting for about 20% of global energy supply. This conflict has caused a supply disruption of about 14 million barrels per day, directly pushing Brent crude prices from below $80 to a peak of $138, making it the largest single supply shock in the history of the modern oil market.
Q: Will current oil prices continue to rise?
A: This is highly dependent on the progress of peace talks. Under a baseline scenario, as the Strait of Hormuz gradually reopens in the second half of the year, Brent could fall from its current level around $100 to the $80 to $90 range. However, if negotiations fail, extreme scenarios cannot rule out a retest of levels above $120 or even higher. Institutional forecasts vary widely, requiring continuous monitoring of diplomatic developments.
Q: Can OPEC+ production increases alleviate the supply shortage?
A: Theoretically possible, but the practical effect is limited. Several core OPEC+ producing countries are themselves affected by the conflict, meaning paper production quotas cannot immediately translate into actual deliveries. Production growth from non-OPEC regions like the US and Brazil is a more effective mitigating force, but their scale is still insufficient to cover the approximately 14 million barrel per day supply gap from the Middle East.
Q: What impact will the Iran conflict have on the cryptocurrency market?
A: The indirect impact is mainly transmitted through two pathways. The first is the macro pathway: high oil prices fuel inflation, suppressing expectations for central bank rate cuts, creating overall pressure on risk assets. The second is the demand pathway: in economies under sanctions or facing significant currency devaluation pressure, the usage of BTC and USDT as alternative financial tools tends to increase, a pattern verified multiple times by historical data.
Q: How can ordinary investors participate in crude oil-related trading?
A: Investors can participate in crude oil price movements through various channels, including oil futures, ETFs, and trading crude oil-related contracts or digital assets linked to energy prices on MEXC. Please note that commodity trading carries high risk; it is recommended to operate cautiously after fully understanding leverage risks.
Q: What is the reasonable expected price range for oil in 2026?
A: Based on the midpoint of various institutional forecasts, the full-year average Brent crude price for 2026 could be between $80 and $96 per barrel, higher than the pre-conflict level of $60 to $65, but lower than the peak period of the conflict. Uncertainty is extremely high, with the main variables being the actual timeline for the Strait of Hormuz's reopening and the outcome of US-Iran negotiations.
Disclaimer
This article is for informational purposes only and does not constitute investment advice or a financial product recommendation. Trading in crude oil and related assets involves significant market risk, and prices may experience sharp fluctuations due to unforeseeable factors such as geopolitical events or policy changes. Before making any investment decisions, readers should fully assess their own risk tolerance and consult professional financial advisors. Past performance is not indicative of future returns.


