






Bitcoin oscillates and accumulates momentum as direction nears, HYPE restarts short-driven trend | Special Analysis


- Core View: This week, Bitcoin's price rebound is approaching the key resistance zone of $65,700~$67,300. Whether it breaks through or not will determine the direction of the short-term trend. HYPE continues its adjustment trend, with the focus on the test of the rebound in the $62~$63.5 zone. The mid-term bearish mindset is dominant.
- Key Elements:
- Bitcoin's daily adjustment has formed a four-wave structure, currently in the (3-4) rebound wave, with the price approaching the key resistance zone of $65,700~$67,300. If it encounters resistance and falls back in this zone, the daily-level adjustment may resume; if it breaks through effectively, the short-term structure will turn bullish.
- The 4-hour chart shows that Bitcoin's rebound structure has formed a seven-wave pattern, including a five-wave central axis. If it breaks through $65,700 and forms a momentum divergence with the entry wave, the rebound may end, increasing the probability of a pullback.
- HYPE has been adjusting from its high of $72.97, forming an eight-wave downward structure on the 4-hour timeframe, including a five-wave descending central axis. It is currently in the (68-69) rebound wave, but the downward momentum is greater than the previous one, suggesting a potential new low for the adjustment.
- HYPE's core resistance level this week is in the $62~$63.5 zone. If it rebounds to this zone and shows adjustment signals, one may consider light short positions with position control within 30%.
- Last week, based on signals from the "Spread Trading Model" and "Momentum Quant Model," one short-term long trade was executed on Bitcoin, achieving a profit of approximately 3.45%.
This week, Bitcoin continues its rebound above the $57,820 low, with the price approaching the key resistance zone of $65,700 to $67,300. The battle between bulls and bears is entering a critical phase. If the rebound is rejected in this area, the daily-level correction could resume; if it breaks through effectively, the short-term structure will shift to a stronger bullish logic. HYPE continues its correction from the high of $72.97. This week, the focus is on the outcome of the battle in the $62 to $63.5 area. The medium-term view remains bearish, while short-term operations should strictly follow model signals, dynamically switching between Plan A and Plan B.
Summary of Core Trading Views for This Week:
- Analysis of BTC's Multi-Timeframe Structure (detailed in Part 1)
- BTC Price Forecast and Medium & Short-Term Trading Strategies for This Week (detailed in Part 2)
- Analysis of HYPE's Hourly Structure (detailed in Part 3)
- HYPE Price Forecast and Short-Term Trading Strategy for This Week (detailed in Part 4)
Market Verification of Last Week's Trading Strategy and Core Views:
- Verification of BTC Price Forecast: Last week's article clearly stated that Bitcoin's daily chart had entered a short-term consolidation phase. The subsequent market movement confirmed our forecast.
- BTC Short-Term Trading Results: Last week, we executed one short-term long trade (1x leverage), successfully realizing a profit of approximately 3.45%. (Detailed in Part 5)
- Verification of HYPE Price Forecast: Last week's article clearly stated that if the price rebounded at the beginning of the week but failed to break the previous high of $72.97, it would indicate a reversal of the prior uptrend, likely leading to a daily-level correction from the $72.97 high. The market movement has been highly consistent with our assessment.
1. Analysis of Bitcoin's Multi-Timeframe Structure
1.1 Analysis of Bitcoin's Daily Structure: (Based on Analysis After May 6) Figure 1: Bitcoin Daily Candlestick Chart
① As shown in Figure 1: The corrective trend initiated from the high of $82,850 on May 6 has formed a four-segment structure on the daily chart: (0-1), (1-2), (2-3), and (3-4).
② After hitting a low of $57,820 on July 1, the market is currently in the (3-4) rebound segment. The rebound peak has reached $65,600, approaching the key resistance at $65,700. Currently, this rebound segment may not be over, and the recent high of $65,600 is likely not the endpoint of segment 4.
③ If the (3-4) rebound segment shows clear signs of stalling and correction within the $65,700 to $67,300 zone, then the first daily-level rebound wave (wave a) starting from the July 1 low of $57,820 might be ending.
2. In-depth Analysis of Bitcoin's Hourly Structure: (Using the 4-hour chart)
 Figure 2: Bitcoin 4-Hour Candlestick Chart
① On the 4-hour chart, the rebound from the July 1 low of $57,820 has clearly formed a seven-segment structure, from (44-45) to (50-51). Among these, segments (45-46), (46-47), (47-48), (48-49), and (49-50) overlap, forming a "five-segment" consolidation zone (Zone E).
② Based on the current structure analysis, the price is currently in the (50-51) rebound segment.
- If the price effectively breaks the resistance at $65,700 and continues its rebound, the probability of this segment upgrading to a departure segment from the consolidation zone increases significantly. In this case, we need to compare its momentum with the entry segment (44-45) into the zone. If a momentum divergence forms between them when endpoint 51 concludes, the rebound starting from endpoint 44 (around $57,820) might end, increasing the likelihood of a subsequent correction.
- If the rebound fails to effectively break the resistance at $65,700, the probability of short-term range-bound trading remains high.
2. Bitcoin Price Forecast and Trading Strategy for This Week
1. BTC Price Forecast for This Week:
Core View for the Week: Focus on the test result when the price rebounds to the key resistance zone of $65,700 to $67,300.
2. Key Resistance Levels:
- First Resistance Zone: $65,700 ~ $67,300 (Previous significant resistance area)
- Second Resistance Zone: $69,500 ~ $71,000 (Previous significant resistance area)
3. Key Support Levels:
- First Support Level: Around $64,700 (Previous significant support level)
- Second Support Zone: $60,950 ~ $62,000 (Previous significant support zone)
- Third Support Level: Around $57,820 (Previous significant support level)
4. Operational Strategy for This Week (Excluding Black Swan Events)
① Medium-Term Strategy:
 Figure 3: Bitcoin Daily Candlestick Chart: (Position Monitoring Model)
Position Monitoring Model: As shown in Figure 3, the price has effectively broken below the "Bull-Bear Channel," confirming the market structure has turned bearish-led.
- Maintain the current medium-term short position at around 20%.
- If the price rebounds to the $65,700 ~ $67,300 area and shows signs of stalling, combined with a top signal from our proprietary quantitative model, consider increasing the medium-term short position to up to 50%.
② Short-Term Strategy:
Utilize 30% of capital with a stop-loss, looking for "spread" trading opportunities based on support and resistance levels. (Use the 30-minute/60-minute chart as the operating timeframe)
③ To dynamically respond to complex market developments in short-term trading, we have prepared two specific operational plans in advance: Plan A and Plan B.
Plan A: Tentative Shorting at Strong Resistance
- Entry: If the price rebounds to the $65,700 ~ $67,300 area and encounters resistance, combined with a top signal from the quantitative model, establish a short position of around 30%.
- Risk Management: Set an initial stop-loss level.
- Exit: When the price corrects to a key support level, combined with signals from the quantitative model, gradually close the position to lock in profits.
Plan B: Light Long Position at Strong Support
- Entry: After the price rebounds to the $65,700 ~ $67,300 area and pulls back. If it stabilizes above the previous low of $57,820, showing signs of stopping the decline, combined with a bottom signal from the quantitative model, establish a long position of around 30%.
- Risk Management: Set an initial stop-loss level.
- Exit: When the price rebounds to a key resistance level, combined with model signals, gradually close the position to lock in profits.
3. Analysis of HYPE's Hourly Structure
 Figure 4: HYPE 4-Hour Candlestick Chart
1. As shown in Figure 4, the correction initiated by HYPE from the July 7 high of $72.97 (endpoint 61) can be subdivided into an eight-segment corrective structure on the 4-hour timeframe. Among these, segments 62-63, 63-64, 64-65, 65-66, and 66-67 overlap, forming a "five-segment" bearish consolidation zone (descending zone).
2. In last week's review, it was pointed out: When the market subsequently formed the (62-63) rebound segment, if endpoint 63 failed to break the previous high at endpoint 61 ($72.97), it would signify the end of the daily uptrend from endpoint 54 to endpoint 61, leading to a daily-level correction from endpoint 61. The market underwent the expected correction last week, falling from endpoint 63 to endpoint 68, with a maximum drawdown of approximately 16.17% during the period.
3. Based on the 4-hour chart analysis:
By comparing the momentum of the departure segment (67-68) of the bearish zone with its entry segment (61-62), it is evident that the downward momentum of the departure segment is significantly stronger. This suggests that endpoint 68 ($58.16) has a lower probability of being the low of this round of correction. The market is currently in the (68-69) rebound segment, and the price may subsequently see a new correction low.
4. HYPE Price Forecast and Short-Term Trading Strategy for This Week: (07.20 ~ 07.26)
1. HYPE Price Forecast for This Week:
① Key Resistance Levels:
- First Resistance Level: $62 ~ $63.5
- Second Resistance Level: $68 ~ $69.5
- Third Resistance Level: Around $72.97
② Key Support Levels:
- First Support Level: Around $58.16
- Second Support Zone: $52 ~ $55
Core View on HYPE for this week: Focus on the test result of this rebound when it reaches the $62 ~ $63.5 area.
2. HYPE Short-Term Trading Strategy for This Week:
If the price rebounds to around $62 ~ $63.5 or a higher resistance area and emits a clear correction signal, we suggest investors consider entering a small short position (trial short). Strict stop-loss discipline is required, with the position size controlled within 30%.
5. Bitcoin Short-Term Trading Review
Strictly following our operational plan and trading signals generated by our proprietary "Spread Trading Model" and "Momentum Quantitative Model," we executed one short-term (long) trade last week, achieving a total trading profit of approximately 3.45%.
1. Short-Term Trading Record: (See Table 1)
Detailed Summary of Bitcoin Short-Term Trading: (Leverage 1x)
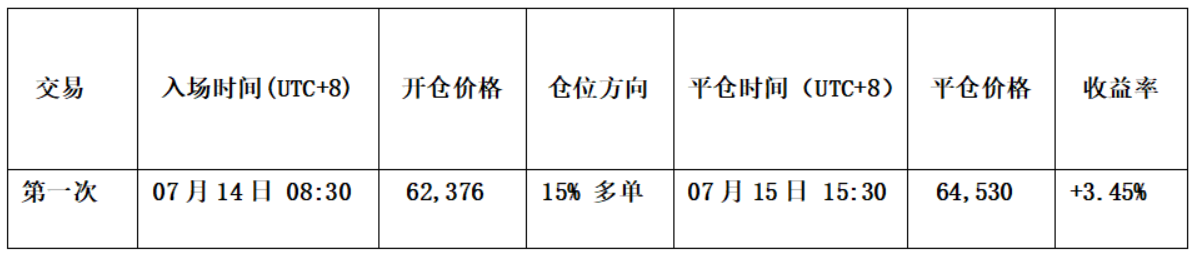
Table 1
2. Short-Term Trading Review: (See Figure 5)
Entry Strategy:
a. When the price corrected to above $61,000, a stabilization signal appeared. The candlestick pattern formed a "bottoming" structure.
b. The "Momentum Quantitative Model" generated a bullish momentum divergence signal.
c. After the "Spread Trading Model" triggered a strong bottom warning signal (white dot + red dot), the signal band (orange-yellow) in the chart broke above the horizon line (magenta), emitting a bottom-reversal signal.
Therefore, we established a 15% long position at $62,376.
Exit Strategy:
a. When the price rebounded to around $65,700, a stalling signal appeared. The candlestick pattern formed a "topping" structure.
b. After the "Spread Trading Model" triggered consecutive top warning signals (white dot + green dot), the signal band (blue) in the chart broke below the skyline (green), forming a top resonance signal with the "Momentum Quantitative Model."
Therefore, we fully closed the position around $64,530.
Summary: This trade successfully yielded a profit of approximately 3.45%.
3. Short-Term Trading Illustration
 Figure 5: BTC 30-Minute Candlestick Chart: (Momentum Quantitative Model + Spread Trading Model)
6. Special Reminders:
- Upon Entry: Immediately set the initial stop-loss level.
- When Profit Reaches 1%: Move the stop-loss to the entry cost price (break-even point) to ensure capital safety.
- When Profit Reaches 2%: Move the stop-loss to the 1% profit level.
- Continuous Tracking: For every subsequent 1% gain in price, move the stop-loss level by 1% accordingly to dynamically protect and lock in profits.
Financial markets are highly dynamic; all market analysis and trading strategies require real-time adjustment. All views, analytical models, and operational strategies presented in this article are derived from personal technical analysis, intended solely as a personal trading journal, and do not constitute any investment advice or basis for action. The market carries risks; invest with caution. Do not make decisions based solely on this content.


