Gate 機構週報:BTC 波動率上行,LST 全板塊回撤


- 核心觀點:上週受強於預期的美國 CPI 數據、中美會談缺乏突破及荷姆茲海峽局勢升級影響,市場風險偏好急劇逆轉,導致美股衝高回落、BTC 與 ETH ETF 分別錄得約 9.96 億及 2.55 億美元淨流出。衍生品市場進入去槓桿階段,BTC 資金費率轉負,選擇權保護性需求升溫,市場正重新評估宏觀政策路徑。
- 關鍵要素:
- 宏觀環境急轉:美 4 月 CPI 年增 3.8% 超預期,10 年期美債殖利率升至 4.58%,疊加中東地緣風險,風險資產承壓。
- ETF 資金外流:BTC ETF 單週淨流出約 9.96 億美元,ETH ETF 淨流出約 2.55 億美元,機構資金轉向防禦性配置,但整體 AUM 仍處歷史高位。
- 傳統金融主導:TradFi 鏈上與 CEX 衍生品交易繼續由黃金等避險資產主導,股票類交易佔比在美股波動加大後回升至約 30%。
- 鏈上借貸去槓桿:Aave 主網借貸連續第二週收縮,ETH 側 LST 板塊 TVL 回撤約 10%,資金向 Plasma 等新鏈遷移。
- 衍生品定價風險:BTC 資金費率由正轉負,OI 回落至 25.5B 附近;各期限 25D Skew 深度負值,DVOL 中樞抬升至 41 以上,下行風險定價升溫。
- Gate 機構逆勢增長:機構現貨市占率季增 10%,全倉槓桿借貸規模增長 10%,核心交易系統延時優化 91%。
Summary
• Last week witnessed a clear reversal in market conditions. The stronger-than-expected US April CPI, lack of substantial breakthroughs in US-China talks, and renewed escalation in the Strait of Hormuz drove US bond yields higher and risk assets into a correction; the S&P 500 and Dow Jones, after hitting record highs, saw a significant pullback on Friday, prompting the market to reassess the policy path of the Fed under the Warsh era.
• BTC ETFs saw net outflows of approximately $996 million for the week, while ETH ETFs had net outflows of about $255 million, a notable weakening compared to the previous week, indicating a temporary shift by institutional funds towards defensive positions. However, the total AUM for both BTC and ETH ETFs remains near historical highs.
• On-chain TradFi and CEX derivatives trading continued to be dominated by safe-haven assets like gold. The stronger-than-expected US CPI and geopolitical risks fueled volume in gold-linked perpetual swaps; simultaneously, the proportion of trading related to equities and tech stocks rebounded, highlighting increased macro-driven characteristics.
• On-chain liquidity remains concentrated on top DEXs like PancakeSwap and Raydium, while DEX protocols specializing in deep liquidity and stablecoin swaps experienced a notable contraction. The stablecoin market shows a preference for USD-denominated assets with stronger compliance, payments, and banking channel attributes.
• Borrowing on Aave's mainnet and the LST sector saw pullbacks, with demand for leverage on both ETH and Solana sides cooling simultaneously. Concurrently, newer chains like Plasma and MegaETH continued to absorb structural capital migration.
• The derivatives market entered a deleveraging phase. BTC funding rates turned negative, OI continued to decline, the proportion of Puts volume and the negative 25D Skew widened, and the DVOL base oscillated higher, indicating a significant increase in market pricing of downside risk and volatility.
• Gate's institutional spot market share rose against the trend, with a 10% month-over-month increase. Cross-margin lending volume grew 10% week-over-week. The Spot SBE is expected to go live in June, and the order placement/cancellation latency on CrossEx's key exchange was reduced from 16.6ms to 1.5ms, a 91% improvement.
1. Market Focus Interpretation
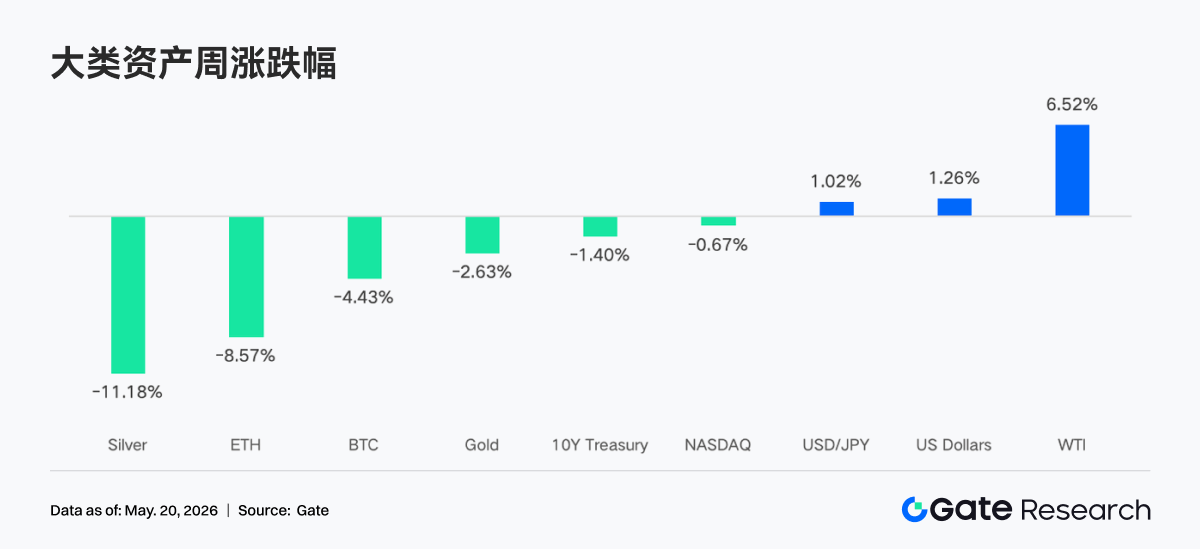
Over the past week, the market situation reversed sharply, with stronger-than-expected inflation data and heightened policy uncertainty challenging the rally in risk assets. On Thursday, US stocks hit record highs, with the S&P 500 closing above 7,500 for the first time and the Dow Jones returning above the 50,000 mark; however, they fell significantly on Friday as the market reassessed the inflation and policy landscape. Firstly, the April CPI data released on Tuesday was stronger than expected, with headline inflation rising 3.8% year-over-year, above the consensus expectation of 3.7% and a 0.6% month-over-month increase. Secondly, the US-China bilateral talks on Wednesday and Thursday failed to yield substantial policy breakthroughs. Thirdly, geopolitical tensions escalated again, with fresh military clashes in the Strait of Hormuz on Friday, exacerbating fears that the de-escalation process could deteriorate.
The interest rate market reacted strongly. As federal funds futures prices adjusted significantly, the market priced in tighter policy. The 10-year US Treasury yield rose 28 basis points this week to 4.58%, its highest level since September 2025. The USD/JPY pair continued to climb on a stronger dollar. The market lowered expectations for easing and began to price in the possibility of further tightening. The Powell era officially ended last Friday; Jerome Powell's term as Fed Chair concluded on May 15, and Kevin Warsh was sworn in as his successor over the weekend. Warsh will chair the FOMC meeting on June 16-17, which will release updated Summary of Economic Projections and a revised dot plot, giving the market its first formal look at the policy outlook under Warsh's leadership.
2. Liquidity Analysis
2.1 BTC ETF Scale Continues to Expand but Faces Outflows
Last week, the BTC ETF market exhibited a clear pattern of capital outflows. Early in the week, May 11 still recorded a net inflow of approximately $27.2 million, but market sentiment quickly turned negative. Significant net outflows of about $233.2 million and $630.4 million were seen on May 12 and May 13 respectively, indicating institutional funds began to exit risk assets in a concentrated manner. Overall, Bitcoin ETFs saw cumulative net outflows of approximately $995.5 million last week, approaching the $1 billion mark. Compared to the net inflows of about $623 million in the previous week (May 4 to May 8), market risk appetite has clearly reversed, with institutional investors generally leaning towards profit-taking and temporary risk aversion.
The ETH ETF market also came under pressure. Over the past week, ETH ETFs recorded net outflows for multiple consecutive trading days, with total weekly net outflows of approximately $255.2 million, a stark contrast to the net inflows of about $70.49 million the previous week. This indicates that, against a backdrop of macroeconomic uncertainty and heightened market volatility, ETH assets were also affected by capital reductions, with overall sentiment weaker than previously expected.
• Total AUM: As of May 14, cumulative net inflows for BTC ETFs had reached approximately $58.63 billion, with an AUM of around $107.75 billion; cumulative net inflows for ETH ETFs were approximately $11.9 billion, with an AUM of about $13.45 billion. Despite short-term fluctuations in capital flows, the overall scale of ETFs remains near historical highs, suggesting that institutional allocation demand has not fundamentally reversed.
• Institutional Moves: Capital divergence was noticeable last week. For BTC ETFs, BlackRock's IBIT saw a net outflow of approximately $317.1 million for the week, while Morgan Stanley's MSBT bucked the trend with net inflows of about $39.1 million, reflecting some institutions engaging in structural rebalancing and bottom-fishing. For ETH ETFs, BlackRock's ETHB saw minor net inflows, while ETHA experienced larger outflows, indicating clear divergence in market views on the liquidity, fee structures, and long-term allocation value of different products.
2.2 TradFi Liquidity
• TradFi Perp DEX: Over the past week, the trading structure of TradFi assets on Perp DEXs continued its pattern of "commodity dominance, index support, equity recovery." In terms of volume share, commodities remained the absolute core, maintaining an overall share roughly between 45% and 65% during the week. Although slightly down from the peak periods in March-April, they are still the primary source of liquidity for on-chain TradFi derivatives trading. Gold-related assets remain the core of trading, reflecting the market's continued preference for safe-haven assets and macro themes against the backdrop of persistent inflation, rising geopolitical risks, and fluctuating USD rate expectations. Meanwhile, the share of equity-type assets rebounded significantly over the past week, from below 10% previously back to nearly 30%. This suggests that with the re-emergence of volatility in US stocks, on-chain users' demand for trading tech stocks, US indices, and AI-related concepts has picked up. The current user base for on-chain TradFi Perps remains primarily crypto-native traders with a preference for high volatility and high leverage, rather than a full-scale migration of traditional macro capital.
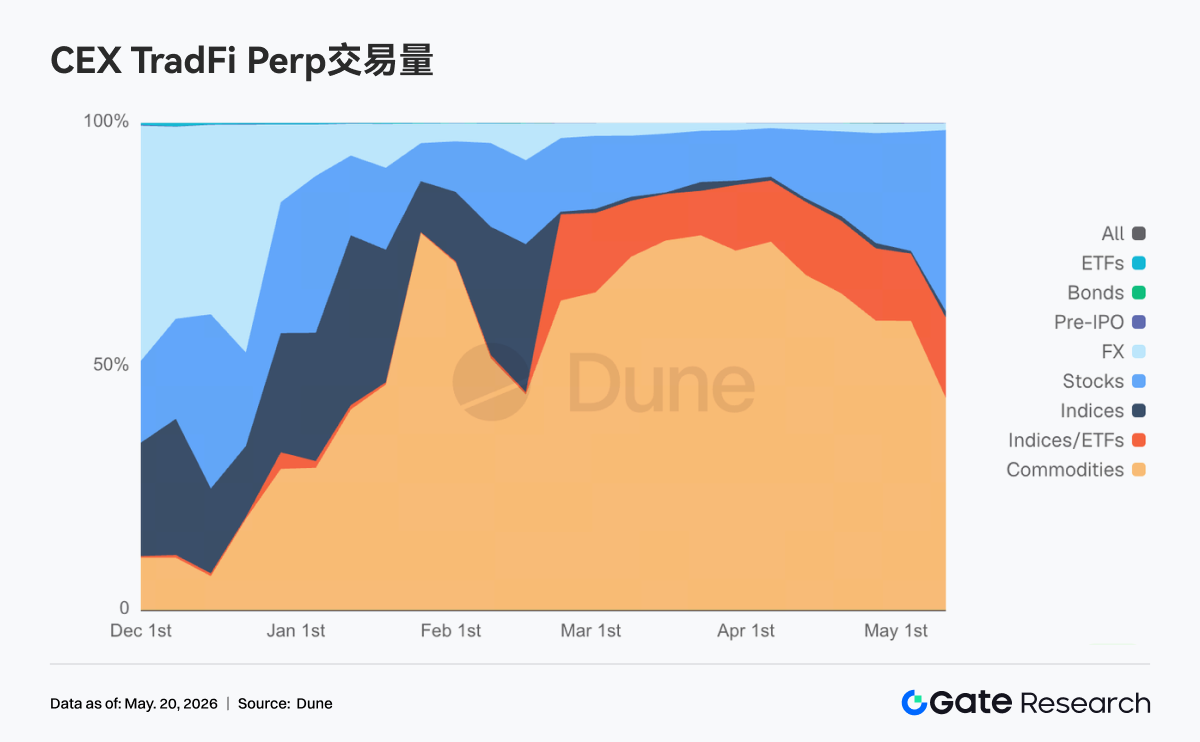
• TradFi Perp CEX: Over the past week, overall trading activity in the CEX TradFi perpetual swap market remained high, but the structure showed a clear characteristic of "precious metals dominating, equities assisting, other sectors low in activity." Looking at the daily volume distribution of TradFi Perps, precious metals like gold still held an absolute core position, with daily turnover on most trading days maintained between $300 million and $700 million, and occasionally exceeding $1 billion during periods of high volatility. A peak phase exceeding $1.5 billion occurred in mid to late March. While overall volume last week was lower than those extreme highs, it was still significantly above early February levels, indicating that demand for safe-haven and macro trading remains strong. In terms of rhythm, volume saw another notable increase in the second week of May, particularly against the backdrop of stronger-than-expected US CPI, escalating geopolitical risks in the Middle East, and fluctuating USD rate expectations, with gold-related perpetual swaps becoming the primary trading direction for capital. Concurrently, volume in equity-type assets also rebounded, reflecting short-term trading demand driven by volatility in US stock indices and tech stocks. Overall, the current CEX TradFi Perp market is gradually shifting from its previous pure crypto beta trading towards a stronger macro-driven and cross-asset allocation logic.
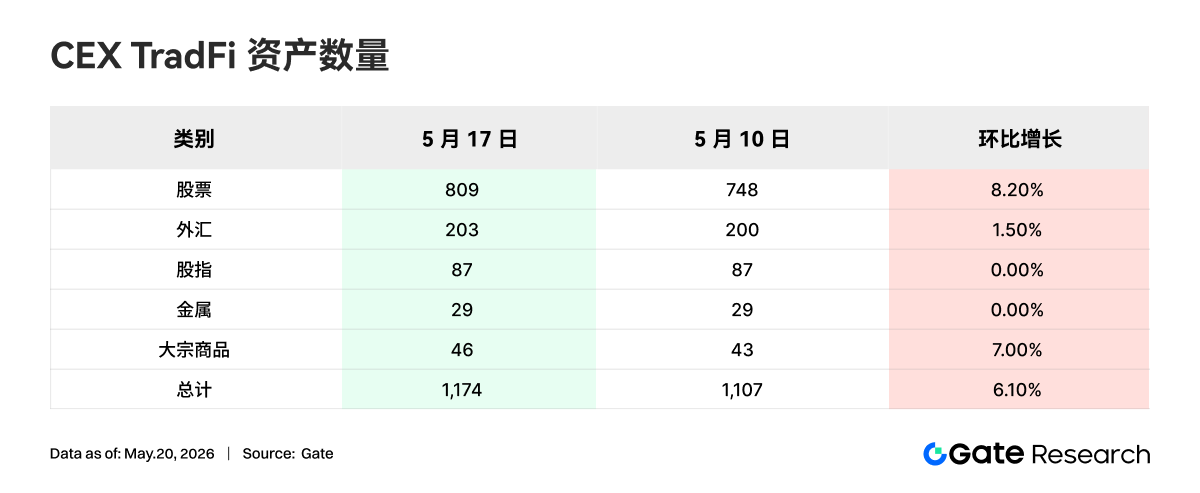
• Number of CEX TradFi Assets: The number of TradFi asset categories on CEXs expanded further in the past week. The total number of TradFi assets (only counting TradFi and CFD sectors, excluding perpetual swaps) across three major CEXs increased from 1,107 to 1,174, a 6.10% week-over-week increase. Equity class saw the most significant growth, rising from 748 to 809, an 8.20% week-over-week increase. Among the three CEXs, Gate showed the highest growth rate, with its equity TradFi class increasing by 62 month-over-month, an increase of 16.71%.
• TradFi Order Book Depth: We selected XAUT, the highest TradFi trading volume, to analyze its order book depth (Delta). Last week, XAUT's order book liquidity showed a clear characteristic of "safe-haven capital inflows followed by weakening." From May 6 to May 12, XAUT's price oscillated at highs around $4,700, accompanied by multiple large positive Delta inflows. Particularly around May 12, there was a net liquidity increase of nearly $2.8 million, reflecting capital flowing into gold-related assets as a safe haven during the period of stronger-than-expected US CPI and rising geopolitical risks in the Middle East. However, the market structure reversed significantly after May 13, with the order book experiencing consecutive large negative Deltas, with single outflows exceeding $2 million. XAUT's price also fell below $4,650, retreating all the way to the $4,520-$4,550 range, reflecting early safe-haven capital starting to take profits. Notably, between May 15 and May 17, although the price continued to weaken, the order book saw a buildup of moderate-sized positive Deltas, suggesting some capital began to step in at lower levels, and the market did not enter a unilateral liquidity withdrawal phase. Overall, XAUT currently appears to be in a "high-level rebalancing phase after safe-haven sentiment cooled." Short-term trends will remain highly dependent on macro variables such as Fed rate cut expectations, the USD interest rate path, and the situation in the Strait of Hormuz.
3. On-Chain Data Insights
3.1 Top DEX Volume Concentrated on PancakeSwap, but Vertical Protocol Divergence Intensifies
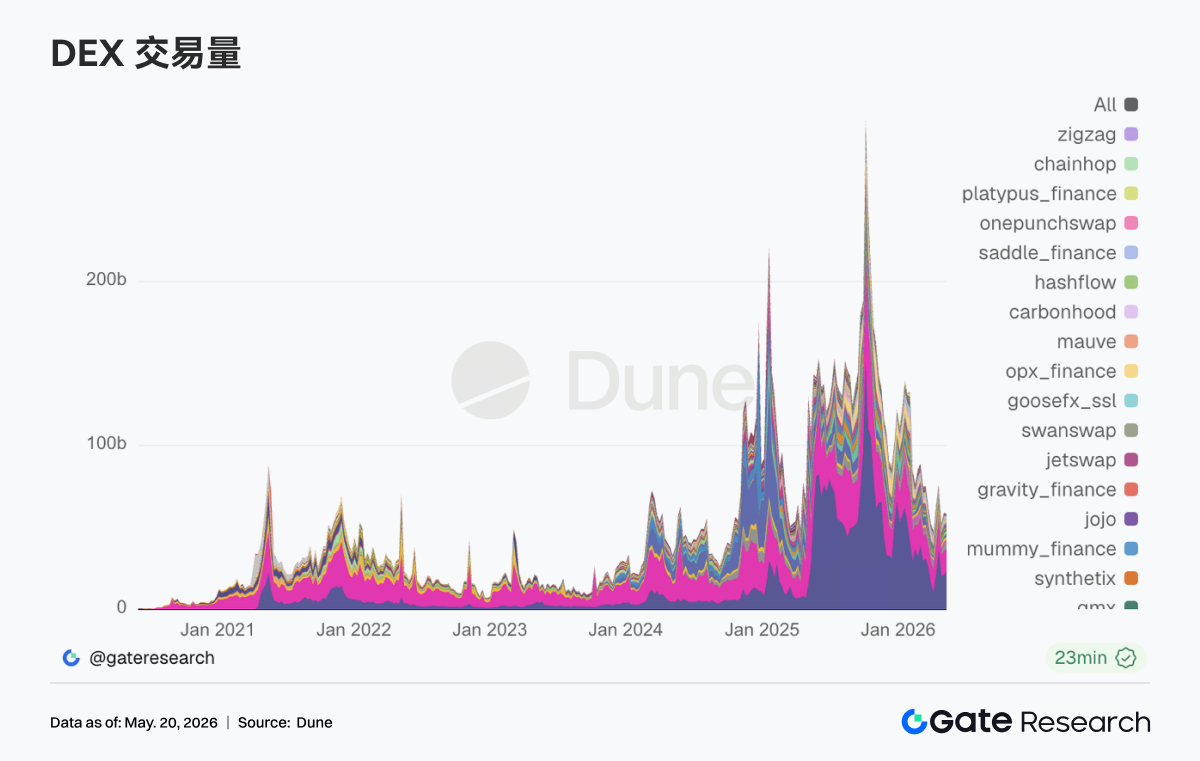
PancakeSwap saw an increase of about 12% compared to last week. The spot-related traffic on the BNB Chain side is the main battleground for both institutional and retail activity. Uniswap decreased by about 7% week-over-week. Aerodrome on Base grew by approximately +3% week-over-week. Activity on the Solana side remains, with the structure leaning towards high transaction counts and medium dollar volumes. Raydium increased by about $1.26 billion week-over-week, while Meteora was roughly flat. The high on-chain transaction count indicates that Meme and routing-type trades haven't completely died down. Vertical DEX protocols specializing in deep liquidity and stablecoin swaps, like Fluid and Curve, saw notable volume contractions this week.
3.2 Compliant and Payment Stablecoins Perform Relatively Well, Synthetic Dollar Variants See Increased Volatility
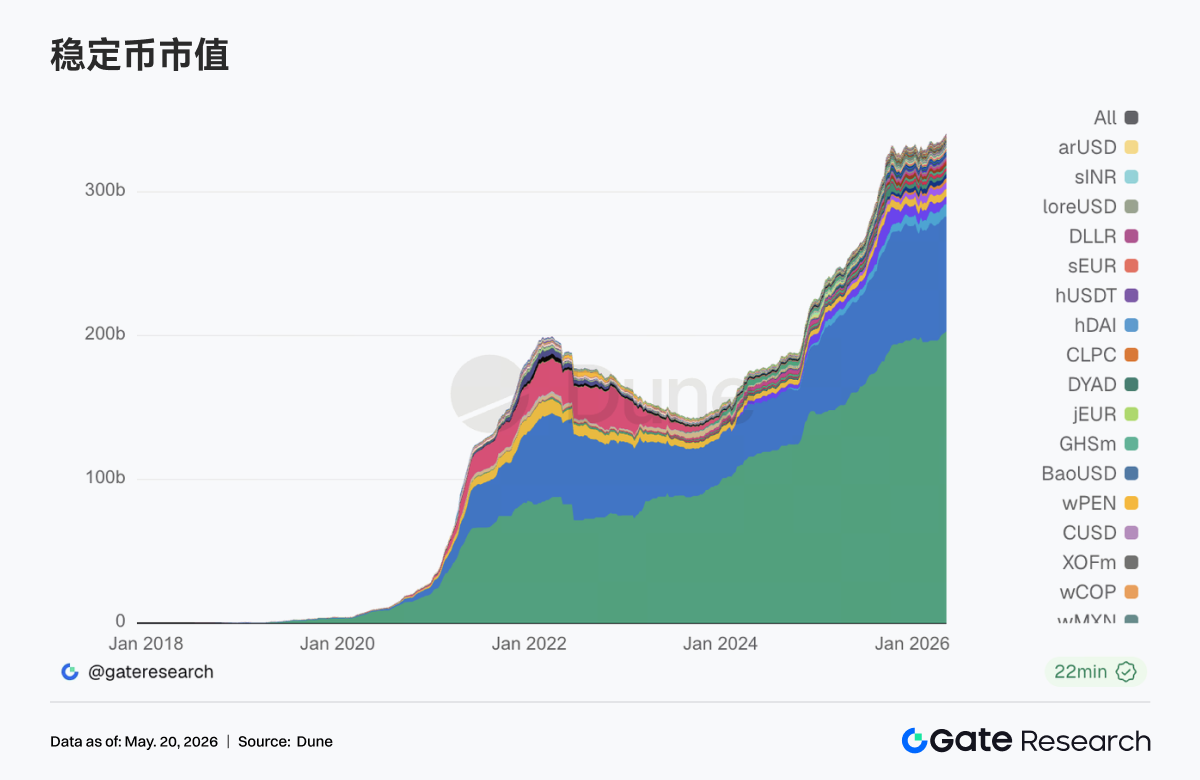
With USDT and USDC dominant, second-tier stablecoins like PYUSD, RLUSD, EURC, and USDG, which are close to payment, custody compliance, and banking channels, outperformed established on-chain USD stablecoins like DAI in terms of stock growth rate. USDe expanded notably this week, reflecting demand for yield-bearing and synthetic dollars for arbitrage and staking in volatile markets, especially across networks. Additionally, following the enactment of the GENIUS Act, institutional capital expenditure on stablecoin infrastructure has clearly accelerated. Public institutions like Bitwise stated that GENIUS reduced regulatory uncertainty for stablecoins and tokenization projects, suggesting subsequent market structure legislation like the Clarity Act will be a key growth variable.
3.3 LST Sector Sees Broad Pullback, Solana-Based Assets Underperform
On the ETH side, LST protocols like Lido, Rocket Pool, and StakeWise all recorded TVL pullbacks ranging from mid-to-high single digits to around 10%, reflecting the synchronous shrinkage of staking tokens and ETH during a beta downturn. On the Solana side, higher-beta LSTs like jupSOL and Sanctum saw deeper declines, as capital prioritized reducing high-volatility staking exposure when risk appetite fell. Overall, LST remains a slow-burn tool for long-term ETH/SOL allocation, but the past week was not a sector-wide deleveraging; Ethereum's leading LSTs, buoyed by scale and liquidity, still showed slightly smaller pullback magnitudes compared to smaller-cap LSTs.
3.4 Aave Mainnet Lending Continues to Contract, Plasma / MegaETH Absorb Structural Migration
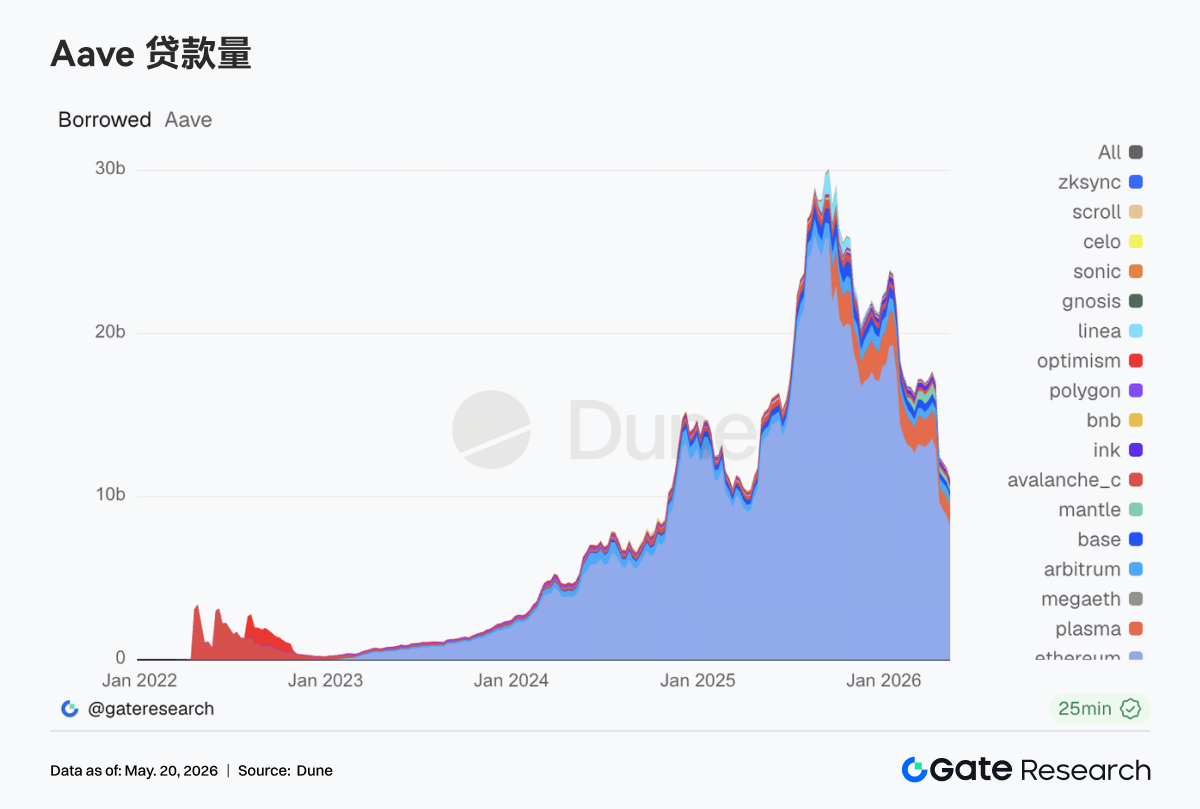
The Ethereum main market remains the absolute core, but it has contracted for the second consecutive week, indicating that institutions and whales remain cautious on the mainnet collateral market following the rsETH-related risk event in April. Concurrently, older L2s like Arbitrum and Ink also weakened. Relative bright spots are Plasma and MegaETH. Capital continues to migrate towards incentive structures and closed-loop collateral scenarios on newer chains. This aligns with the recent direction of Aave's risk team in increasing caps for new assets, suggesting the growth engine is shifting from mainnet leverage expansion towards stablecoins with clearer regulatory attributes and closed loops on new chains.
3.5 Aave Core Borrowing Rates Return to Normal, WETH Leverage Ebb Most Pronounced
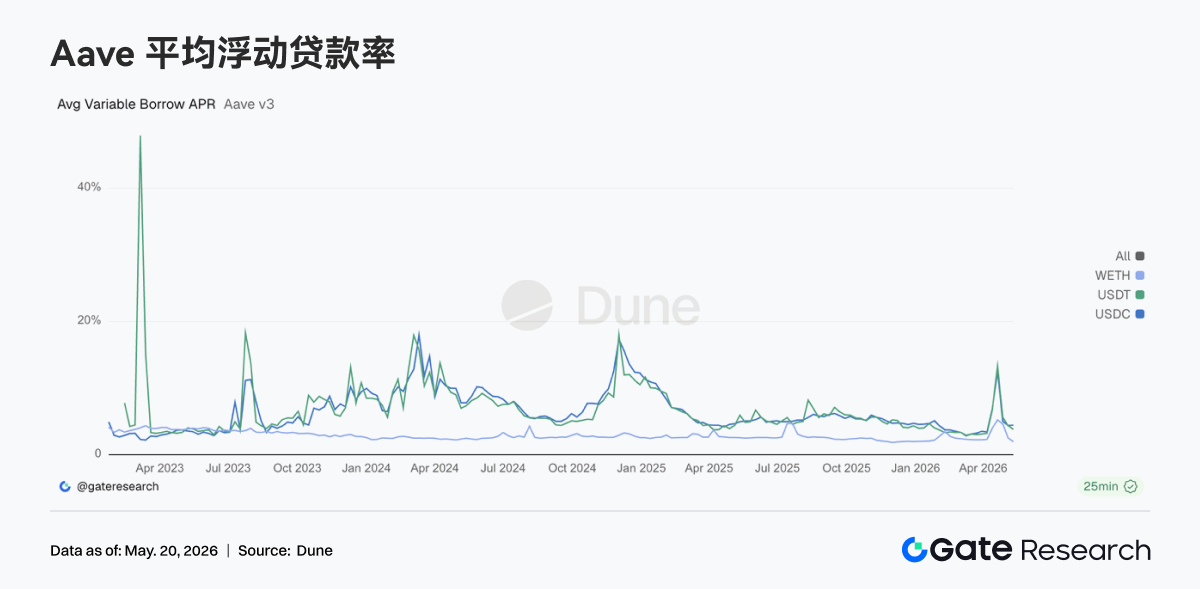
Stablecoin borrowing costs returned to the mid-single digits, reflecting the easing of liquidity stress and the dissipation of the liquidation wave. The decline was steepest for WETH, confirming that the rapid decline in ETH leverage demand correlates with the contraction of mainnet lending stocks. Market behavior shifted from scrambling for liquidity and protecting positions to selectively borrowing stablecoins. The stablecoin side continues to be supported by structural arbitrage, cross-border USD demand, and incentive mining on new chains; while the ETH side is undergoing active deleveraging. This also explains why protocol layers are more willing to increase caps for compliant stablecoins and stablecoins on new chains, rather than simply stimulating WETH loop lending.
3.6 Stablecoin Issuance is the Bedrock, Hyperliquid Expands Event Contract Trading
Tether and Circle contribute the most stable cash flows, consistent with the dominant position of existing USD-denominated coins. Circle is strengthening its vertical integration of issuer, settlement chain, and agent payments through Arc financing and Agent Stack. Hyperliquid's revenue decreased slightly month-over-month, but its absolute value remains in the top tier of on-chain derivatives. It continues to expand product lines like Bitcoin outcome markets, with the market still paying for a comprehensive financial stack encompassing perpetuals + prediction/outcome markets + validator/reserve narratives. Aave's revenue this week saw a notable decline compared to last week, coinciding with both a contraction in lending stocks and the normalization of interest rates, i.e., risk premiums are falling, but active borrowers are also decreasing.
4. Derivatives Tracking
4.1 BTC Funding Rate Turns Negative, OI Decline Signals Rising Deleveraging Pressure
From May 11 to May 17, 2026, BTC prices showed an overall pattern of a rally followed by a pullback. Early in the week, prices remained around 81K. From May 11 to May 13, funding rates were mostly in a slightly positive range, indicating lingering short-term bullish momentum. However, prices failed to break higher, turned weak rapidly after May 14, and fell to around 77K by May 17, shifting the market from high-level consolidation to a corrective decline.
Regarding OI, the overall trend was downward this week. OI remained around 26.8B