
Gate 機構週報:BTC 擠空行情放緩,Aave 資金利率回歸理性
- 核心觀點:上週市場從地緣衝突避險轉向交易經濟軟著陸與降息預期,BTC在ETF資金持續流入下突破82,000美元,TradFi鏈上交易以黃金等宏觀資產主導,但資金已開始回流龍頭DEX與合規穩定幣,顯示風險偏好回暖但結構性謹慎。
- 關鍵要素:
- BTC ETF單週淨流入6.316億美元,其中IBIT淨流入5.963億美元佔主導;ETH ETF淨流入7030萬美元,由ETHA帶動由負轉正。
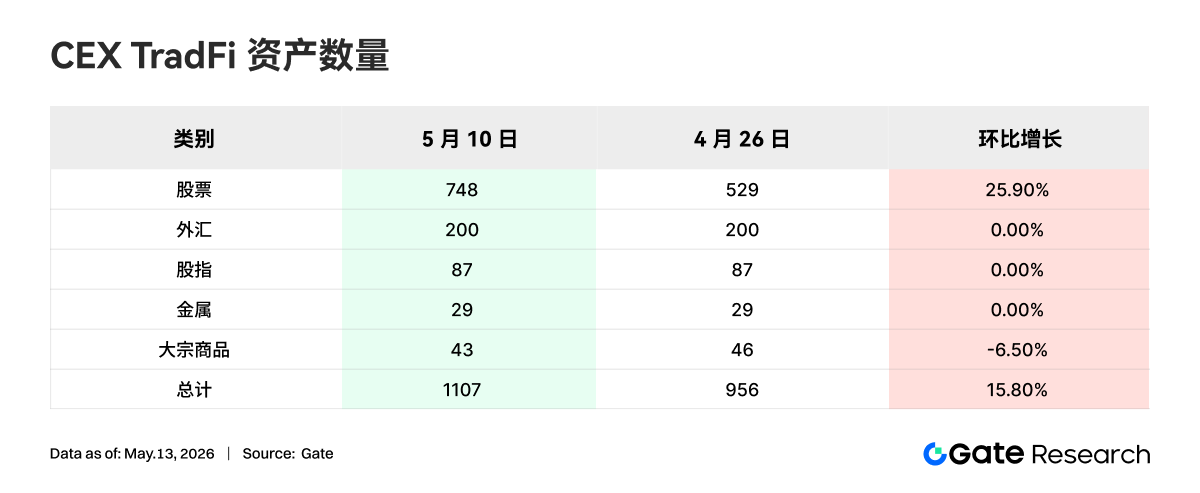
- TRadFi永續合約交易結構中,貴金屬仍佔約60%以上,但股票類CEX資產數量較4月末增長25.9%,資金在宏觀交易主線外開始關注美股指數。
- 鏈上資金回流Uniswap、PancakeSwap等龍頭DEX;穩定幣交易偏向合規型與跨鏈結算資產,Circle獲得法國MiCA授權並將USDC接入Injective。
- Aave仍在消化rsETH事件衝擊,借貸規模收縮,但新公鏈MegaETH承接了部分新增貸款需求,Aave正將增長點轉向歐元穩定幣和新鏈市場。
- BTC衍生品端呈現「負資金費率+高位震盪」的擠空結構,OI衝高回落後未隨價格上行,顯示上行動能主要來自空頭平倉而非新增槓桿追漲。
- BTC期權成交量集中放大在突破階段,隨後降溫,隱含波動率在衝高後回落企穩,市場進入高位盤整觀察期,短期方向性定價尚不充分。
- 5月Gate機構現貨交易量環比增長14.54%,合約環比增長18.10%,CrossEx連續三週交易量與資沉創新高,跨交易所套利需求持續增長。
Summary
• Last week, the market shifted from "war避险" trading to a "soft landing + rate cut expectation" narrative. Positive signals from the Middle East ceasefire plan and strong earnings from AI and tech companies propelled the Nasdaq up 4.70% for the week. BTC broke through $82,000, boosted by continued ETF inflows.
• BTC ETFs saw net inflows of $632 million for the week, with IBIT continuing to dominate institutional capital; ETH ETFs turned positive from negative, with ETHA becoming the main source of growth, indicating a clear improvement in institutional allocation sentiment.
• TradFi on-chain trading was dominated by macro assets like gold and crude oil, while the proportion of stock and ETF-related trading continued to recover; the number of TradFi assets on CEXs continued to expand, with stocks seeing the most significant growth.
• On-chain capital flowed back to top-tier DEXs and mature liquidity venues, with Uniswap and PancakeSwap as the core platforms; the stablecoin market favored dollar-denominated assets with stronger compliance, settlement, and cross-chain capabilities.
• Aave is still digesting the impact of the rsETH incident, leading to a weaker lending market; new venues like MegaETH and Plasma began to absorb incremental capital, with Solana LSTs being the first to benefit from the improved risk appetite.
• The derivatives market continued its "negative funding rate + high-level consolidation" structure; the BTC short squeeze was released in stages; option trading volume and implied volatility expanded during the breakout phase but subsequently cooled down again.
• In May, Gate's institutional spot volume grew 14.54% MoM, and futures volume grew 18.10% MoM; CrossEx hit record highs in trading volume and asset holdings for three consecutive weeks; preparations for the Gate Institutional Circle Amsterdam event have begun.
1. Market Focus Interpretation
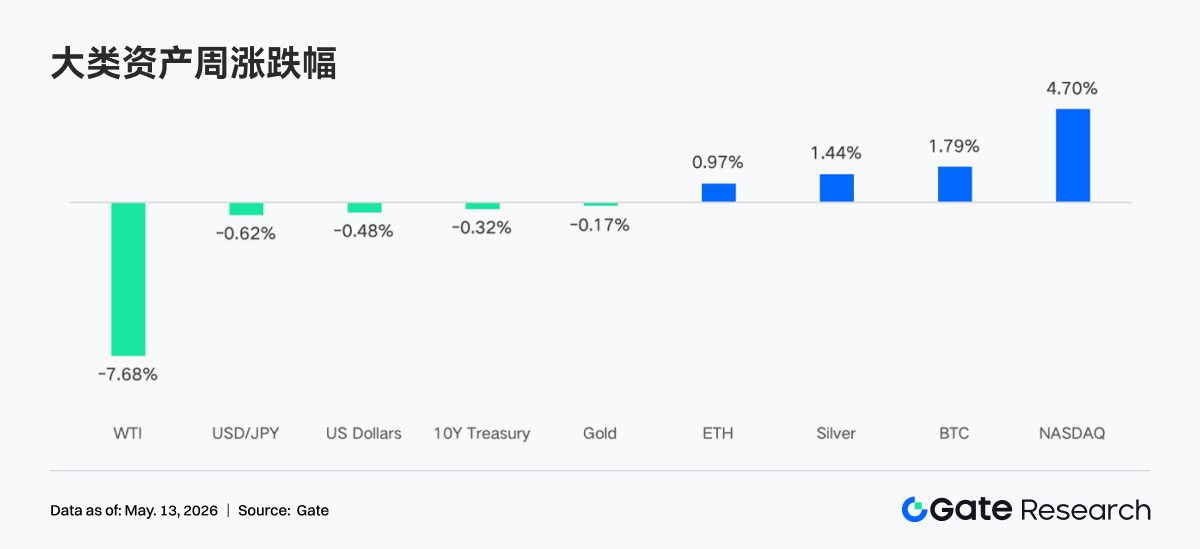
The US proposed a substantive ceasefire plan with 14 clauses covering a halt to Iran's nuclear enrichment activities, the gradual lifting of sanctions, and the removal of restrictions related to the Strait of Hormuz. Sources say this brings the two sides closer to an agreement than at any point since the conflict began. The market reacted positively to this news. Coupled with strong earnings reports across various sectors, especially tech and AI companies, the Nasdaq surged 4.70% for the week, hitting recent highs. Meanwhile, while geopolitical conflicts provided support for gold and silver, a significant drop in crude oil prices (WTI fell 7.68% for the week) due to eased supply disruption concerns cooled inflation expectations, limiting gold's gains. In the crypto space, Bitcoin steadily broke through the $82,000 mark, driven by sustained spot ETF inflows and improved market liquidity. In the forex market, the US dollar index weakened due to the Fed's dovish stance, supporting a slight rebound in the Japanese yen.
Despite the impact of the oil crisis, the latest labor market data continues to show improvement. Non-farm payrolls increased for two consecutive months in March and April, reaching the highest level in nearly a year. This brings the average monthly private sector job creation this year to nearly 90,000. Meanwhile, the unemployment rate has fallen from its 2025 peak, with the latest data for April showing a rate of 4.3%, unchanged from the previous year. Overall, the market has shifted from the "war panic" seen earlier in the week to an optimistic pricing of an "economic soft landing" and "room for Fed rate cuts."
2. Liquidity Analysis
2.1 Continued Expansion of BTC ETF Scale
Last week, BTC ETFs exhibited a pattern of "strong inflows followed by weak outflows," with net inflows recorded for the first three trading days, turning to net outflows in the last two. The total net inflow for BTC ETFs was $631.6 million for the week, a significant increase from the previous week, indicating a generally positive market sentiment. ETH ETFs saw a total net inflow of $70.3 million for the week, a clear improvement from the previous week and turning from negative to positive.
• Overall AUM Situation: As of May 8, the total net assets of BTC ETFs stood at approximately $1067.7 billion, with cumulative net inflows historically exceeding $59.4 billion; the total net assets of ETH ETFs were approximately $13.6 billion, with cumulative net inflows of about $12.1 billion, and the ETF net asset value accounted for approximately 4.94% of Ethereum's total market cap. The scale of BTC ETFs continues to expand, with IBIT's AUM reaching approximately $66.9 billion, accounting for about 66% of the entire BTC ETF market, surpassing the size of most traditional commodity ETFs.
• Institutional Moves: Fund flows showed significant divergence this week. IBIT led the market with a net inflow of $596.3 million for the week, extending its dominant position in institutional allocation. ARKB ranked second with $53.1 million, indicating some institutions still have interest in high-beta strategy products. In contrast, FBTC had only a net inflow of $52.2 million for the week, with significant outflows on Thursday and Friday totaling approximately $226.6 million, reflecting a more cautious stance by institutions towards Fidelity's products. GBTC continued its structural outflow, with a total net outflow of $62.3 million for the week. For ETH ETFs, ETHA led with a net inflow of $100.1 million, while FETH was dragged down by a single-day outflow of $62.3 million on Thursday, resulting in a net outflow of $32.2 million for the week, showing a clear divergence in the performance of the two major ETH products.
2.2 TradFi Liquidity
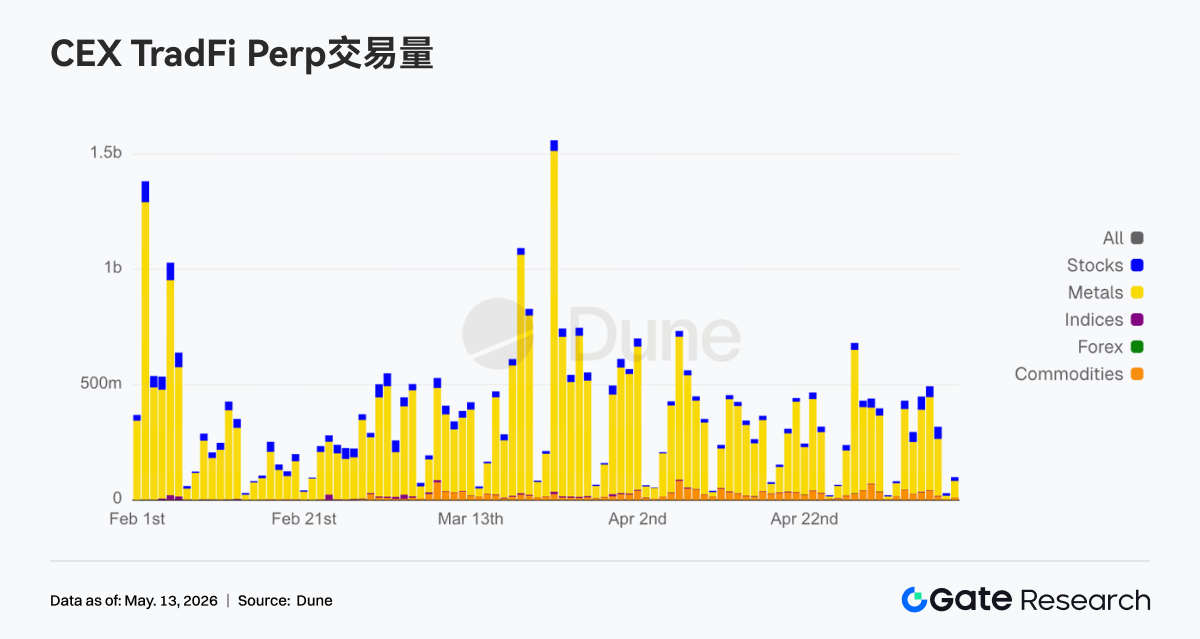
• TradFi Perp DEX: In the past week, the trading structure of TradFi Perp DEXs remained overwhelmingly dominated by commodities, holding a share of over 60%. This indicates that macro assets like gold and crude oil continue to drive on-chain TradFi trading demand. Against the backdrop of ongoing geopolitical risks and risk-off sentiment, capital clearly favors commodity assets with higher volatility and more direct narratives. Meanwhile, the shares of the Indices/ETFs and Stocks sectors continued their steady recovery, reflecting that some capital is beginning to re-engage with US stock index and ETF-related trading opportunities. The shares of traditional macro assets like FX and Bonds remained low. Overall, the current trading preference on TradFi DEXs remains highly concentrated on the "macro trading" theme, and on-chain capital's risk appetite has not yet clearly shifted to low-volatility assets.
• TradFi Perp CEX: Over the past week, trading volumes for TradFi perpetual contracts on CEXs remained high and volatile, with metals like gold continuing to dominate. The precious metals sector still contributed the vast majority of transaction volume, reflecting sustained strong market participation in safe-haven and macro trading assets. Simultaneously, the trading volume in the stocks sector remained stable, indicating continued capital interest in US stock indices and tech stock volatility opportunities. Commodities saw a phase of increased volume driven by oil price fluctuations. Overall, the current CEX TradFi trading structure remains centered on gold, with macro events and safe-haven demand continuing to dictate market risk appetite.
• CEX TradFi Asset Count: Over the past week, the number of TradFi asset classes on CEXs further expanded. The total number of TradFi assets (counting only the TradFi and CFD sectors, excluding perpetual contracts) on three major CEXs increased from 956 to 1,107, a growth of 15.80% from the end of April. Stock assets saw the most significant increase, growing from 594 to 748, a 25.90% increase from end-April. Gate's stock-based TradFi assets increased by 104 from end-April, a growth rate of 38.95%.
• TradFi Order Book Depth: We selected XAUT, the top TradFi asset by volume, to analyze its order book depth (Delta). Over the past week, XAUT's depth structure exhibited a clear "price increase, sell-side thickening" characteristic. From May 4th to 5th, the order book Delta recorded positive values exceeding $1 million for several consecutive hours, showing a significant increase in buy-side initiative. However, prices still retreated periodically to around $4,500, indicating strong support at lower levels. Starting May 6th, as gold prices rapidly surged above $4,700, the order book Delta turned consistently negative, with multiple instances of hourly liquidity outflows exceeding $1.5 million. This suggests a significant increase in sell orders at higher levels, as some capital began actively taking profits or hedging. Nevertheless, XAUT prices remained largely stable at high levels, indicating that the market's demand for gold as a safe-haven asset remained robust. The depth structure has now gradually shifted from the earlier phase of "active buying driving prices up" to a "struggle between high-level selling pressure and capital absorption." In the short term, it's crucial to monitor whether liquidity support near the $4,650 level can hold.
3. On-Chain Data Insights
3.1 Capital Returns to Dominant DEXs, Trading Focus Shifts to Deepest Liquidity Pools
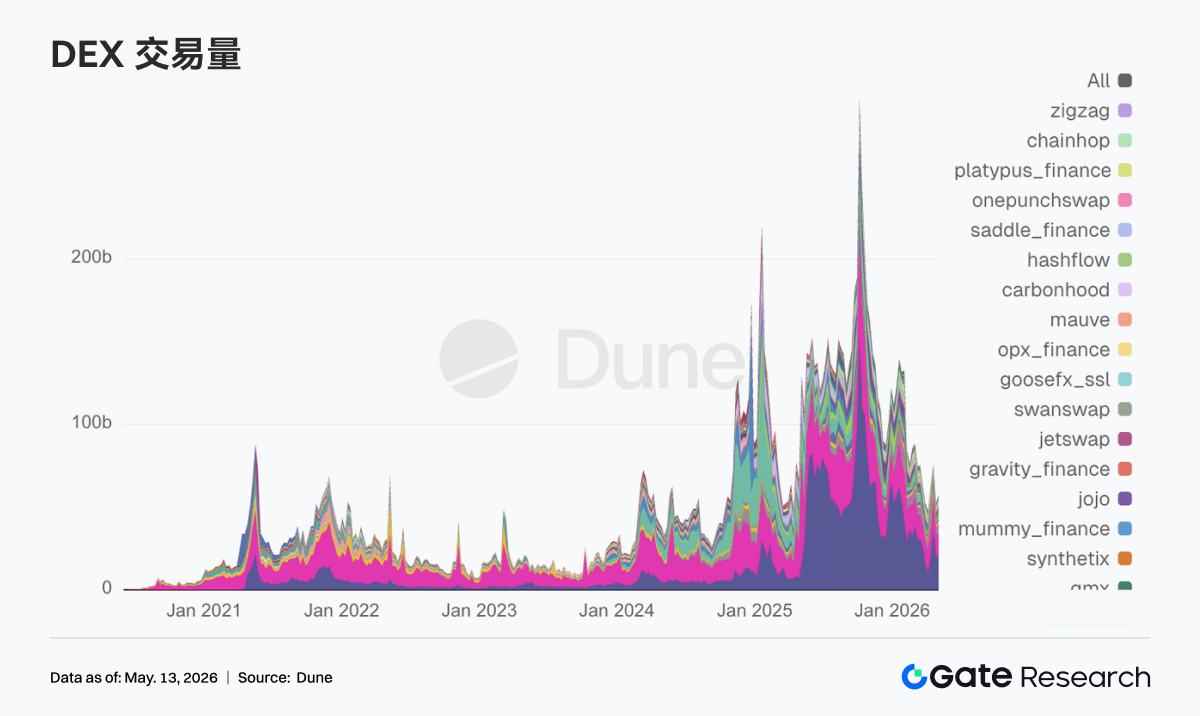
The first week of May on DEXs felt like a return to home ground. PancakeSwap topped the charts, but incremental capital gave higher weight to trading venues with deeper liquidity like Uniswap and Aerodrome. Activity on the Solana side hasn't died down, with Meteora and Raydium remaining active, but trading wasn't solely propped up by a single Meme narrative like previous weeks. With Bitcoin reclaiming its key psychological level, the overall market risk appetite was reignited, and DEX volumes shifted back to a more active state. Notably, Grayscale's quarterly DeFi fund rebalancing this week removed Aerodrome and increased allocation to Ethena, while retaining Uniswap as its largest holding. This indicates that institutional capital continues to prioritize mature liquidity protocols before selecting new narrative directions.
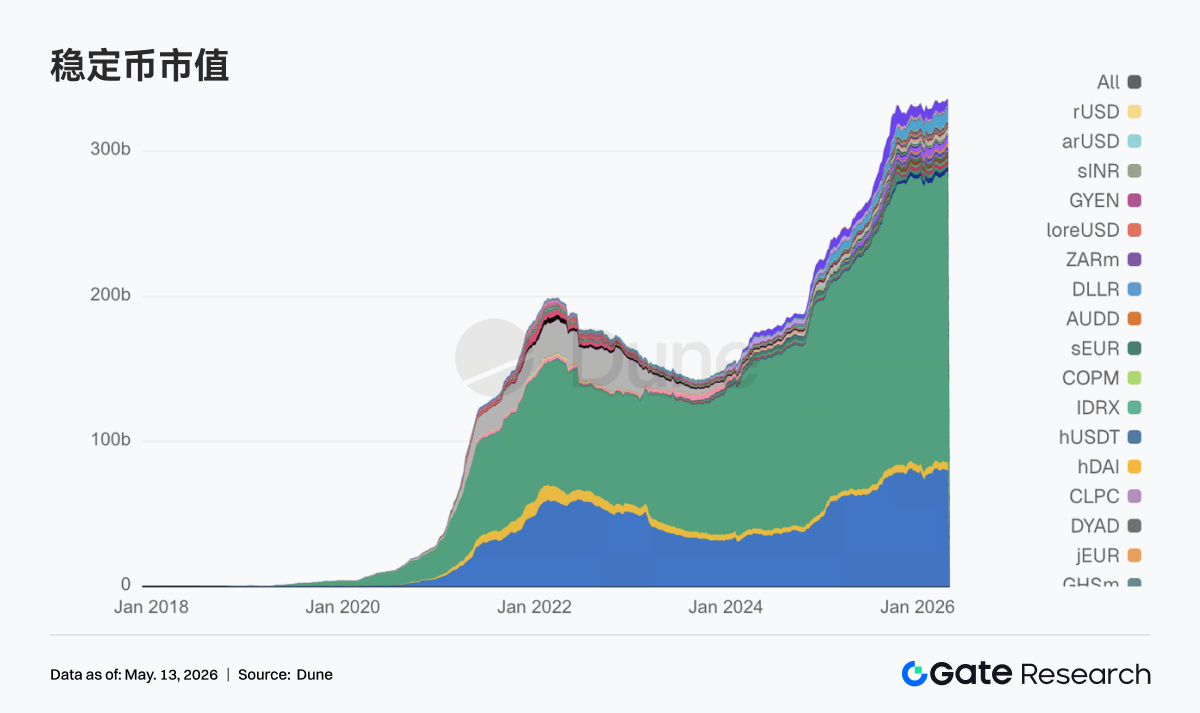
3.2 Market Attention Returns to Settleable, Compliant, Cross-Chain Stablecoin Assets
Besides the two top stablecoins, USDT and USDC, this week saw payment-oriented, compliant stablecoins that can directly participate in DeFi collateralization and liquidation processes taking more prominent positions. Meanwhile, the popularity of yield-oriented and more experimental tokens waned. This change aligns with policy direction. Reuters reported a key compromise in the Senate regarding stablecoin rewards and yield terms, leading the market to quickly reassess which stablecoins best fit the next regulatory framework. Notably, Circle was heavily involved this week in bridging reality, regulation, and ecosystem development, obtaining a MiCA-related authorization in France on May 4th, submitting comments on the GENIUS rule the following day, and connecting USDC and CCTP to Injective on May 7th, advancing steadily along the path of compliant distribution and cross-chain settlement.
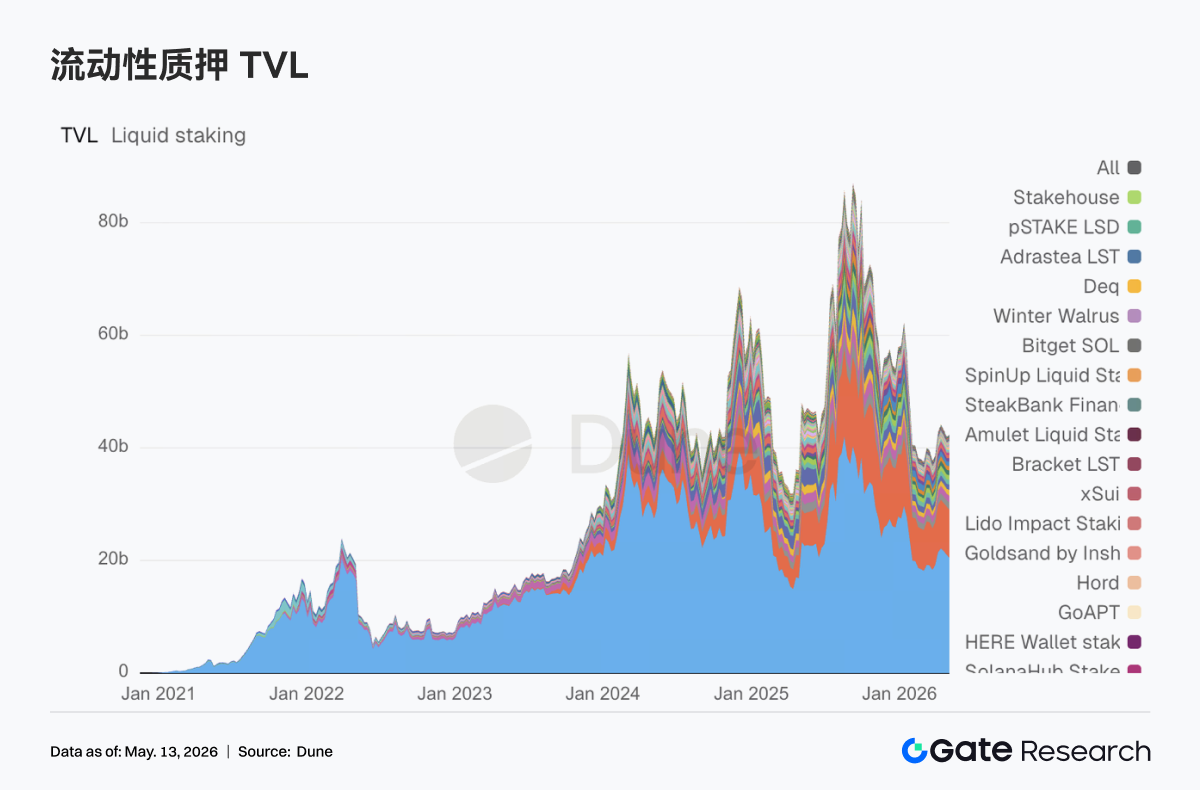
3.3 ETH LST Leaders Remain Stable, Solana Side Catches Risk-On Sentiment First
Top-tier protocols on the ETH side haven't yet staged a complete and decisive recovery. Lido itself appeared somewhat restrained, while Rocket Pool and StakeWise were relatively steady. Instead, LSTs on the Solana side were quicker to capture the improving market risk appetite. Assets like Sanctum and Jupiter Staked SOL saw more active absorption, with capital willing to re-price high-beta staking assets. Meanwhile, Lido obtained a Web3SOC certification this week, continuing to advance its institutional due diligence, governance transparency, and security framework, further solidifying its slow-moving advantages among institutional capital.
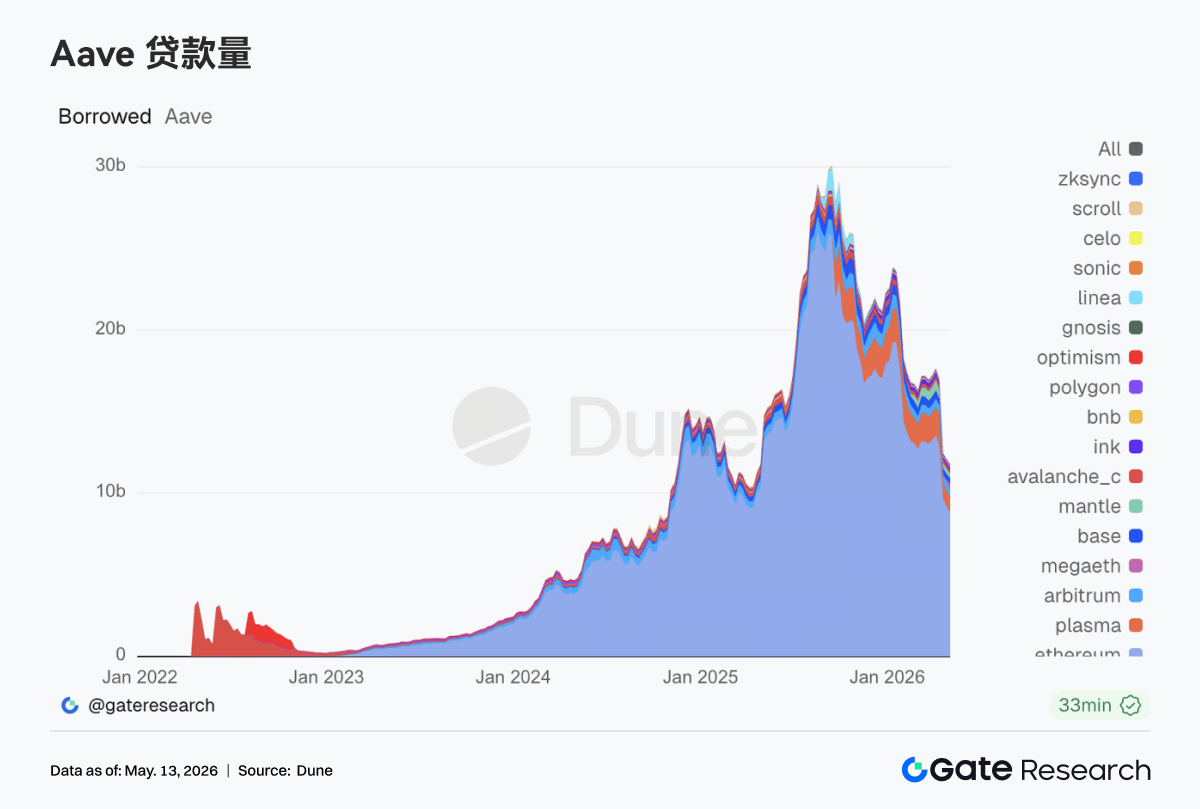
3.4 Aave Still Digesting the rsETH Aftermath, MegaETH Absorbs New Lending Demand
Aave's lending data this week still bore strong marks of post-incident repair. Lending on the Ethereum main market contracted further, and previously strong markets like Arbitrum, Base, and Ink were also weak. The multi-chain recovery seen in previous weeks did not materialize. Conversely, Plasma continued its upward trend, and the lending market on the new L1, MegaETH, saw a particularly pronounced increase. Capital is moving from traditional main markets to newer scenarios and markets with greater incentive potential. Aave Labs explicitly stated in its monthly update at the beginning of the month that the rsETH incident had disrupted the early growth momentum of Aave V4. Subsequently, on May 5th, the Aave Labs risk team pushed for increasing supply caps for EURC on Ethereum and USDm on MegaETH. Aave is pivoting its growth focus towards stablecoins with clearer regulatory attributes and lending markets on new chains that can more easily form closed loops.
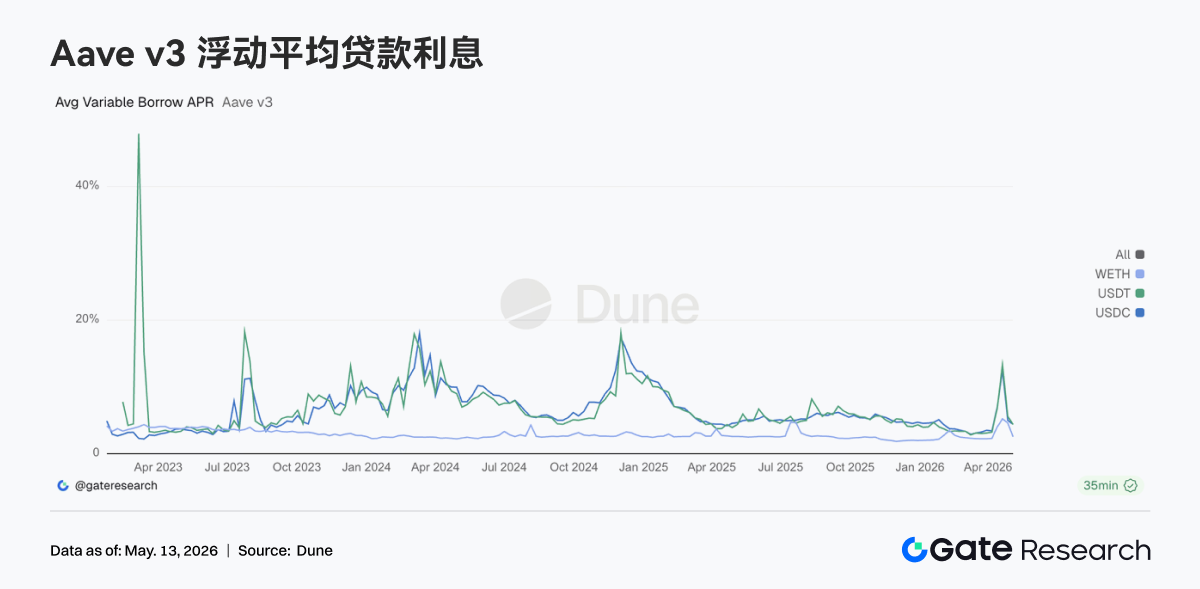
3.5 Aave Core Assets Retreat from Stress Levels, WETH De-Leveraging Most Apparent
Compared to the event-driven rate spikes of the previous two weeks, Aave's lending rates have cooled down significantly this week. The average borrowing costs for USDC and USDT have returned to normal ranges, while the decrease on the WETH side was even faster. Looking at loan volumes, market demand has shifted from "rushing for liquidity" to "selectively borrowing liquidity." This explains why EURC and USDm were prioritized for supply cap increases. Demand for stablecoin lending persists, but it is now more oriented towards structured arbitrage, regional currency needs, and incentivized trading on new chains.
3.6 Protocol Revenue Returns to a Structure of Stablecoins Providing a Floor, Derivatives and Lending Adding Elasticity
Tether and Circle's stablecoin issuance still contributed the most stable cash flow. This week, the elasticity primarily returned to on-chain derivatives and lending infrastructure. Hyperliquid was notably active, and Aave's revenue elasticity was also significantly stronger than the previous week. Transaction and liquidation demands did not fizzle out following the risk events in late April. Starting May 5th, Hyperliquid ventured into Bitcoin outcome markets, and Hyperliquid Strategies disclosed expanding its HYPE reserve and advancing validator collaborations. The market priced this as a signal of Hyperliquid evolving from a perpetuals exchange towards a complete financial stack. On the other hand, the simultaneous occurrence of rising Aave revenue and contracting lending volume represents the risk premium and capital repricing following the shock event.
4. Derivatives Tracking
4.1 Deeply Negative BTC Funding Rate Coupled with Rising OI, Short Squeeze Structure Strengthens
From May 4th to May 10th, BTC prices continued their upward trend and consolidated at high levels, moving from around 79K to above 82K. Although it dipped back to around 80K around May 7th, it subsequently recovered. Regarding funding rates, most of the week remained in negative territory, especially around May 5th and 6th when negativity deepened. This indicates that bearish sentiment wasn't completely extinguished during the price uptrend, and there's a divergence structure where prices strengthen but funding rates remain negative.
Differing from the previous period, OI surged to over 29B on May 5th but quickly pulled back, subsequently oscillating within the 26B to 27B range. The combination of negative funding rates and the OI spike and pullback suggests that the previously crowded short positions were partially relieved during the price uptrend, with some leveraged positions exiting either passively or actively. After May 7th, BTC prices consolidated at high levels, but OI failed to return to its previous highs. This indicates limited appetite for new leveraged chasing of the trend, as the market transitions from a "shorts adding positions, but price not falling" accumulation phase towards a "high-level rotation after the short squeeze" state.
Overall, the current derivatives structure is still slightly bullish, but the short squeeze momentum has been partially digested compared to around May 5th. If prices continue to break above 82K while OI rises concurrently, it could form a new resonance of leverage chasing and short covering. However, if prices oscillate at highs while OI continues to decline, it suggests that the current upward momentum stems more from the covering of previous shorts, requiring spot buying or new long leverage to sustain the move.


