






BTC đã ba lần chịu áp lực tại ngưỡng 80.000 USD, HYPE liên tục lập đỉnh mới, tín hiệu đã xuất hiện | Phân tích đặc biệt


- Quan điểm cốt lõi: Tuần này, Bitcoin tập trung vào cuộc giằng co giữa vùng kháng cự 78.500-79.500 USD và vùng hỗ trợ 73.500-75.000 USD. HYPE cần cảnh giác với đỉnh ngắn hạn hình thành do sự suy yếu động lượng trên khung giờ. Chiến lược giao dịch khuyến nghị bán khống ngắn hạn hoặc mua vào khi giá thấp.
- Các yếu tố chính:
- Kênh tăng giá hàng ngày của Bitcoin kể từ ngày 6 tháng 2 vẫn còn nguyên vẹn. Hiện tại, giá đã điều chỉnh từ mức kháng cự trên của kênh là 82.850 USD về mức trung bình. Nếu không thể ổn định, khả năng tiếp theo sẽ kiểm tra mức hỗ trợ dưới của kênh.
- Biểu đồ 4 giờ cho thấy Bitcoin đang trong cấu trúc điều chỉnh 8 sóng. Nếu sóng 34-35 phục hồi lên vùng 78.500-79.500 USD gặp kháng cự, giá sẽ tiếp tục dao động và kiểm tra vùng hỗ trợ 73.500-75.000 USD.
- HYPE đã phục hồi từ mức thấp 38,14 USD vào ngày 14 tháng 5. Trong đợt tăng 5 sóng trên biểu đồ 4 giờ, xuất hiện cảnh báo đỉnh từ "Mô hình giao dịch chênh lệch giá" và phân kỳ đỉnh động lượng từ "Mô hình định lượng động lượng" ở quanh mức 45.
- Nếu sóng 42-45 của HYPE hình thành đỉnh ngắn hạn, sau khi điều chỉnh về vùng 47,5-50 USD và ổn định, có thể mua vào với khối lượng nhỏ, kiểm soát tỷ lệ vị thế dưới 30% và đặt lệnh dừng lỗ.
- Tuần trước, lệnh bán khống BTC ngắn hạn đã thành công mang lại lợi nhuận 2,78%, mở lệnh tại 77.782 USD và đóng lệnh tại 75.616 USD, dựa trên sự cộng hưởng tín hiệu đỉnh và đáy từ mô hình.
- Chiến lược trung hạn duy trì đứng ngoài quan sát. Chiến lược ngắn hạn sử dụng 30% vị thế để kiếm lời từ chênh lệch giá giữa vùng hỗ trợ và kháng cự, với lệnh dừng lỗ linh hoạt để bảo vệ vốn và lợi nhuận.
This week, continuing the consistent structured analytical framework, we will deconstruct the current trends of Bitcoin and HYPE from a multi-cycle perspective, assess the long-short battle in key resistance and support zones, and formulate specific executable operational plans accordingly.
Last week's short position operation successfully realized a 2.78% gain, once again validating the "signal-driven, discipline-bound" trading logic. However, a single profitable trade never guarantees the direction is correct—the market always holds possibilities beyond our predictions.
The core variable this week remains the battle between the resistance zone of $78,500 ~ $79,500 and the support zone of $73,500 ~ $75,000. The outcome will be determined by the market.
Key Views on This Week's Trading Core:
• Analysis of BTC's multi-cycle trend structure. (See Part 1 for details)
• BTC price forecast for this week and medium/short-term trading strategies. (See Part 2 for details)
• Analysis of HYPE's hourly trend structure. (See Part 3 for details)
• HYPE price forecast for this week and short-term trading strategies. (See Part 4 for details)
Market Validation of Last Week's Trading Strategy and Core Views:
• BTC Short-term Trading Effectiveness: Bitcoin completed one short-term short trade last week (1x leverage), successfully yielding a profit of approximately 2.78%. (See Table 1 for details)
• Market Validation of BTC Price Trend Forecast: In last week's article, we pointed out that if the price effectively breaks below the support zone of $78,500 ~ $79,500, it would test support near $75,000. The current market movement has validated our earlier forecast.
I. Analysis of Bitcoin's Multi-Cycle Trend Structure
1. Analysis of BTC Daily Level Trend Structure
Bitcoin _ Daily K-line Chart:
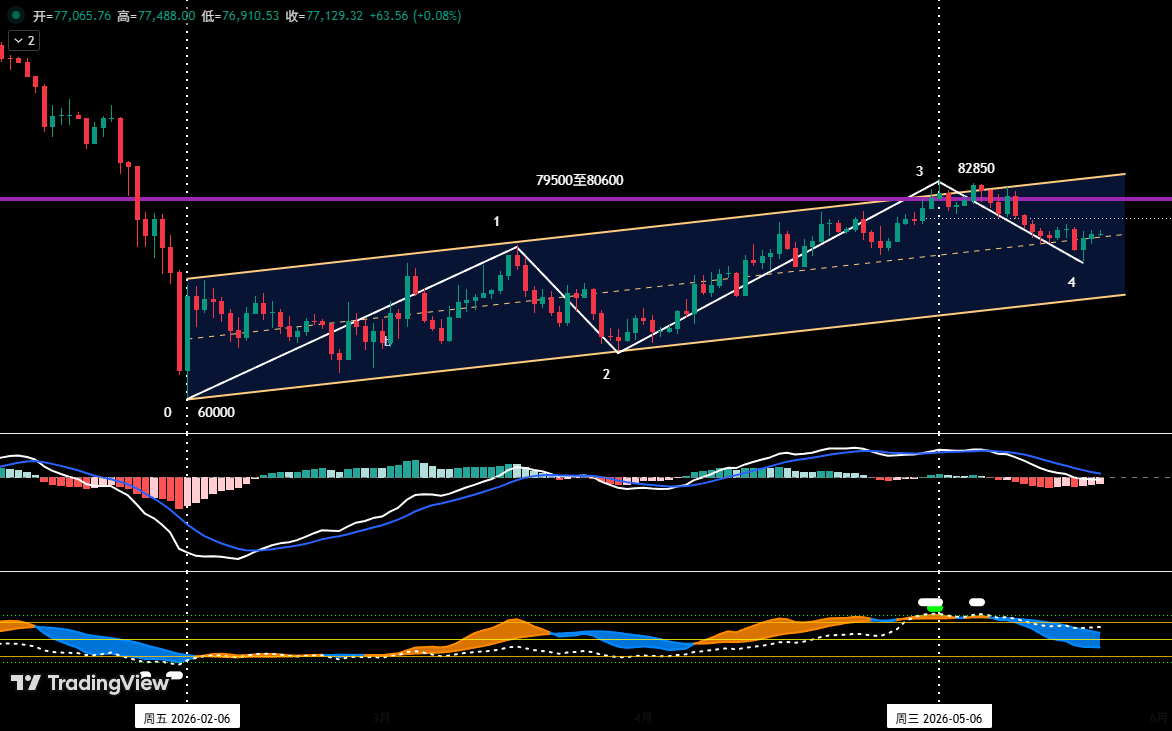
Figure 1
• As shown in (Figure 1), since establishing a cyclical low near $60,000 on February 6, 2026, Bitcoin's daily level has formed and maintained a clearly structured ascending channel: its lower boundary is formed by connecting the lows of February 6 and March 29, while the upper boundary is drawn parallel to the lower boundary through the high of March 17.
• In our April 27 Weekly Review, we noted: "The current price faces dual resistance from the channel's upper boundary and the $79,500 to $80,600 resistance zone, making a breakthrough difficult," a judgment subsequently validated by the market. After nearly 20 days of struggle between bulls and bears, despite reaching a new rebound high of $82,850 on May 6, the price failed to effectively break through this zone's resistance, subsequently beginning a volatile decline.
• From the current structure, the price has pulled back from near the channel's upper boundary to the channel's middle-line zone. If the price cannot find effective support near the middle line and regain upward momentum, the probability of it subsequently seeking support at the lower boundary is increasing.
2. In-depth Analysis of BTC Hourly Level Trend Structure
Bitcoin _ 4-hour K-line Chart
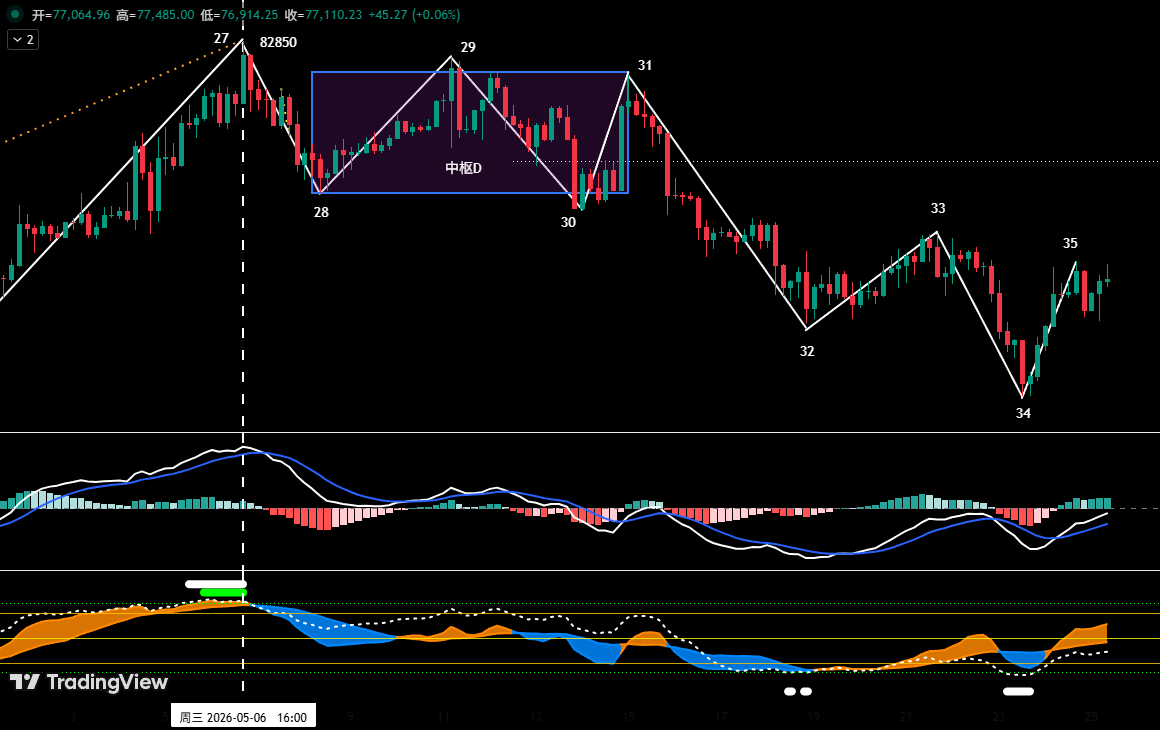
Figure 2
As shown in (Figure 2), since the May 6 high of $82,850, the market has been in a correction phase;
• On the 4-hour chart, this can be subdivided into an 8-segment correction structure from "segment 27-28" to "segment 34-35"; Central Hub D: Segments 28-29, 29-30, and 30-31 overlap to form Central Hub D.
• From the 4-hour trend structure perspective, segment 34-35 is about to rebound towards the $78,500 ~ $79,500 zone. If the price meets resistance and declines upon reaching this zone, failing to form an effective breakthrough, the market will most likely continue its current volatile adjustment pattern, subsequently retesting the core support zone of $73,500 ~ $75,000.
II. Bitcoin Price Forecast and Trading Strategy for This Week
1. BTC Price Trend Forecast for This Week:
Core View for This Week: Focus on the outcome of the battle between bulls and bears for the $78,500 ~ $79,500 resistance zone and the $73,500 ~ $75,000 support zone.
2. Core Resistance Levels:
• First Resistance Zone: $78,500 ~ $79,500 (Near the upper/lower boundaries of the two central hubs)
• Second Resistance Zone: $83,500 ~ $84,500 (Previous dense trading zone for long-short positions)
3. Core Support Levels:
• First Support Level: $73,500 ~ $75,000 (Previous key support level)
• Second Support Level: $69,500 ~ $70,500 (Previous key support level)
4. This Week's Trading Strategy (excluding sudden news impacts)
①. Medium-term Strategy:
Bitcoin _ Daily K-line Chart: (Position Monitoring Model)
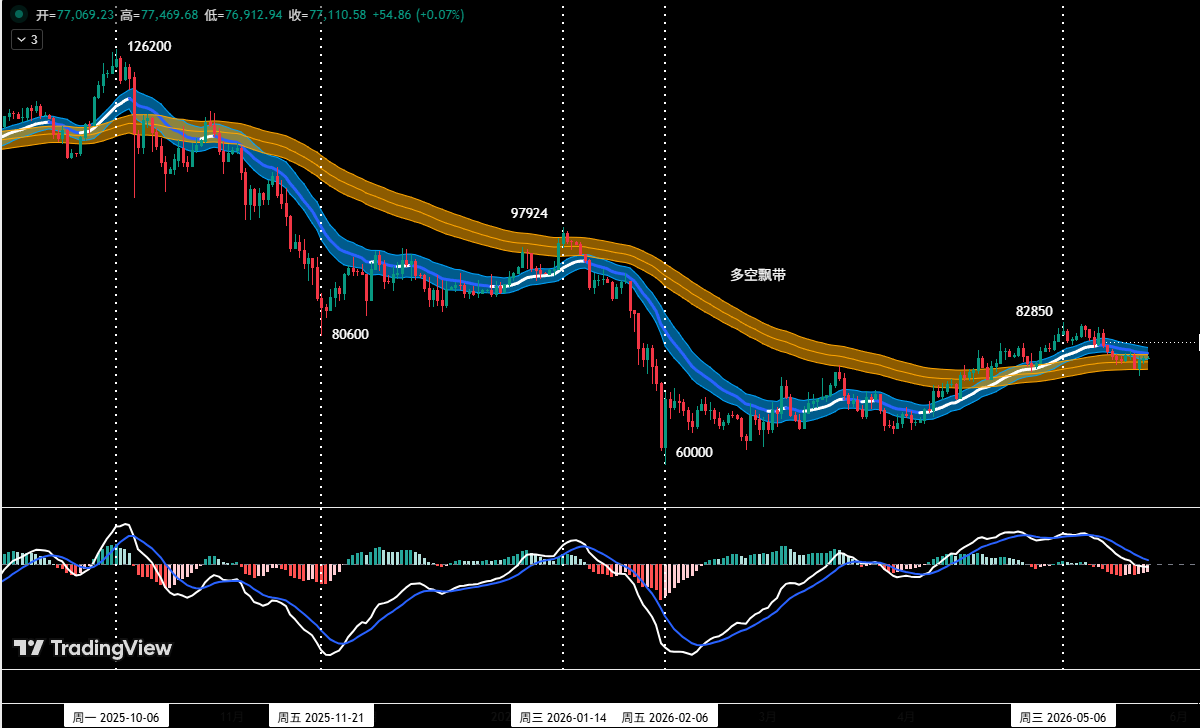
Figure 3
Position Monitoring Model: As shown in (Figure 3), based on trading rules, the medium-term direction of the market remains unclear. This week, the medium-term strategy is to maintain a cash position and observe.
②. Short-term Strategy: Utilize 30% of capital, set stop-loss points, and seek "spread" opportunities based on support and resistance levels (using the 30-minute/60-minute timeframe as the operational cycle).
③. For short-term operations, to dynamically respond to complex market evolutions, we have pre-established specific operational plans A and B.
• Plan A: Rebound Meets Resistance, Sell High on Weakness.
• Entry: When the price rebounds to the $78,500 ~ $79,500 zone and encounters resistance, combined with the quantitative model's top signal, establish a short position of up to 30% capital.
• Risk Control: Initial stop-loss set above $80,600.
• Exit: When the price adjusts near a key support level combined with model signals, progressively close positions to lock in profits.
• Plan B: Effective Breakdown of Support, Short on Momentum.
• Entry: When the price effectively breaks below the $73,500 ~ $75,000 support zone combined with the model's top signal, establish a short position of up to 30% capital.
• Risk Control: Initial stop-loss set above $76,500.
• Exit: When the price declines to a key support level combined with model signals, progressively close positions to lock in profits.
III. Analysis of HYPE Trend Structure
HYPE_4-hour K-line Chart
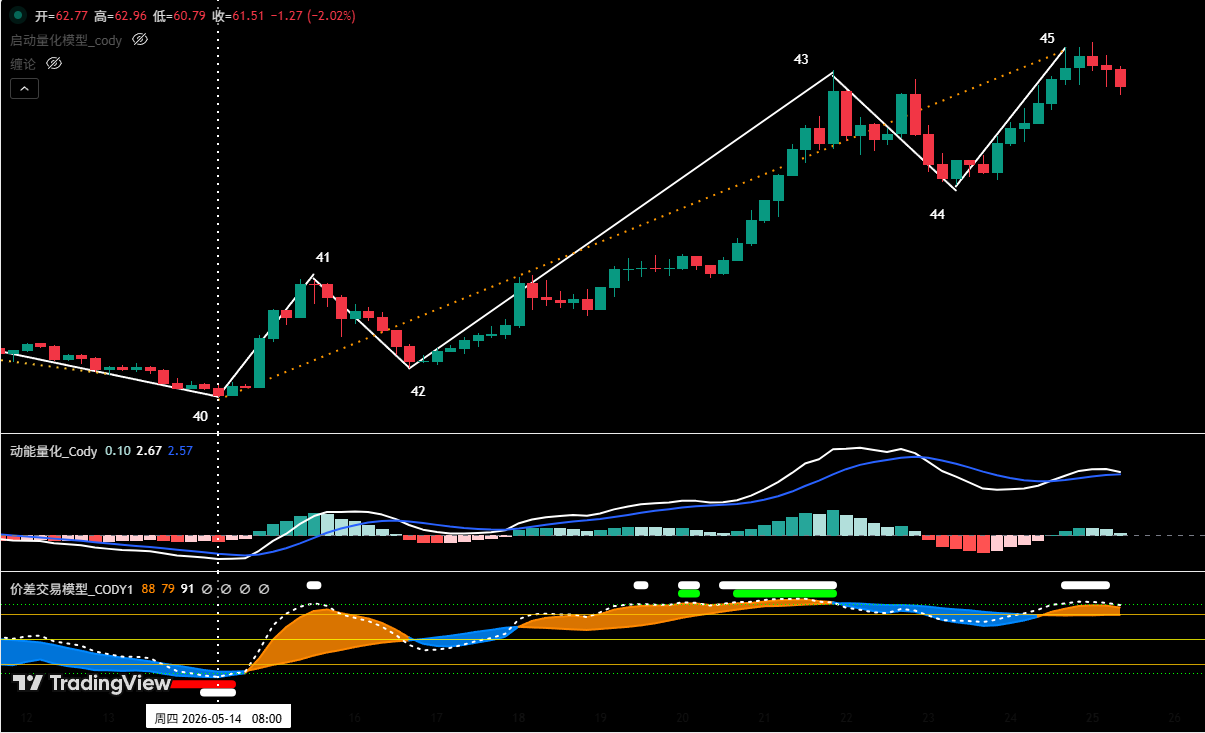
Figure 4
1. As shown in (Figure 4), HYPE's uptrend starting from the May 14 low of $38.14 can be divided into a five-segment structure on the 4-hour chart: 40-41, 41-42, 42-43, 43-44, 44-45.
2. Our proprietary "Spread Trading Model" indicates that endpoint 45 has already triggered a top warning signal (white dot).
3. According to the "Momentum Quantitative Model," the upward segment (44-45) has shown signs of waning upward momentum near $65.
4. If the price forms a momentum top divergence pattern at the "Endpoint 45" position, combined with the top warning signal from the "Spread Trading Model," creating a resonance, the probability of the price forming a short-term high here increases significantly.
IV. HYPE Price Forecast and Short-term Trading Strategy for This Week
1. HYPE Price Trend Forecast for This Week:
Core View for HYPE This Week:
• Observe whether "Endpoint 45" can form a short-term high since the uptrend began on May 14.
• If a short-term high is formed, subsequently look for short-term long opportunities when the price pulls back to a key support zone (e.g., $47.5 to $50) and clear stabilization signals emerge.
2. HYPE Short-term Trading Strategy for This Week: (Long on Support)
Currently, the strategy "Avoid chasing rallies blindly, buy on dips" should be followed. If the price pulls back to the $47.5 to $50 zone, stabilizes, and shows stabilization signals, combined with bottom signals from the two models, a small long position can be considered. Position size must be controlled to under 30%, and stop-loss discipline must be strictly adhered to.
V. Trade Review
1. Short-term Trade Review: (See Table 1)
We strictly followed the operational plan. Based on trading signals from our proprietary "Spread Trading Model" and "Momentum Quantitative Model," we completed one short-term trade (short) last week, achieving a profit of 2.78%.
①. Summary of Bitcoin Short-Term Trade Details: (Leverage 1x)
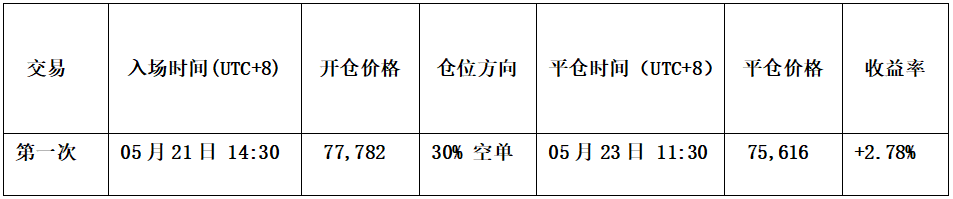
Table 1
②. Short-term Trade Review: (See Figure 6)
• Entry Strategy:
a. When the price rebounded near $78,500 and encountered resistance, forming a bearish "Top Division" candlestick pattern;
b. The "Spread Trading Model" triggered a top warning signal (white dot), and the "Momentum Quantitative Model" formed a momentum top divergence signal.
Therefore, we established a 30% short position at $77,782.
• Exit Strategy:
a. When the price declined near $75,000 and found support, forming a bullish "Bottom Division" candlestick pattern;
b. The "Spread Trading Model" triggered a strong bottom warning signal (red dot + white dot), forming a bottom resonance with the "Momentum Quantitative Model."
Therefore, we completely closed the position near $75,616.
• Summary: This trade successfully yielded a profit of approximately 2.78%.
BTC_30-minute K-line Chart: (Momentum Quantitative Model + Spread Trading Model)
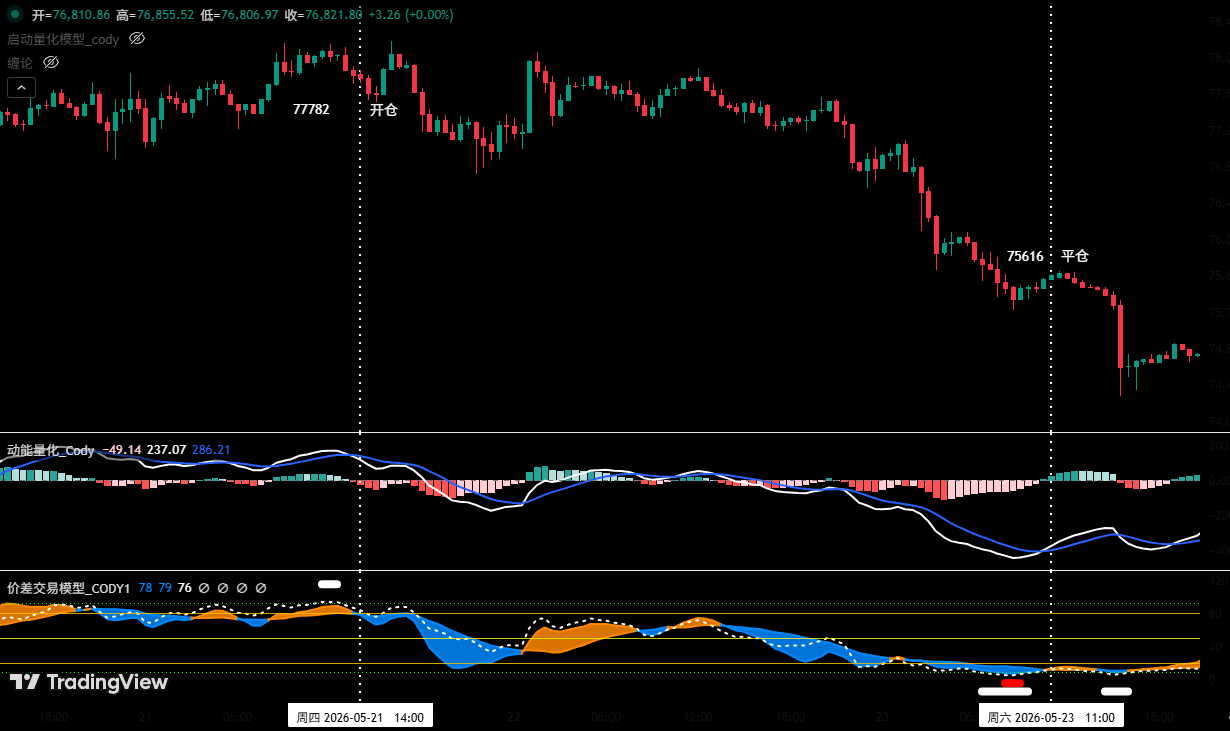
Figure 5 (Short-term Trade Illustration)
VI. Special Reminders:
1. Upon entry: Immediately set an initial stop-loss order.
2. When profit reaches 1%: Move the stop-loss to the entry cost price (breakeven point) to ensure capital safety.
3. When profit reaches 2%: Move the stop-loss to the 1% profit level.
4. Continuous tracking: For every subsequent additional 1% gain in price, the stop-loss is moved up by 1%, dynamically protecting and locking in profits.
Financial markets change rapidly; all market analysis and trading strategies require dynamic adjustment. All views, analytical models, and operational strategies mentioned in this article are derived from personal technical analysis, serve solely as personal trading logs, and do not constitute any investment advice or operational basis. The market involves risk, investment requires caution, please do not make decisions based on this content.


