
```html Viện Trưởng Thành Hỏa Bì|Báo cáo vĩ mô thị trường tiền mã hóa: Chuyển giao quyền lực Fed, lợi suất trái phiếu tăng vọt, điểm uốn thanh khoản có thể sắp đến
- Quan điểm cốt lõi: Vào tháng 5 năm 2026, việc thay đổi lãnh đạo Fed và sự gia tăng mạnh lợi suất trái phiếu toàn cầu tạo thành áp lực vĩ mô kép, kết hợp với ba áp lực bán: dòng vốn ETF chảy ra, bán chủ động trên thị trường giao ngay/hợp đồng tương lai vĩnh viễn, và nhu cầu phòng ngừa rủi ro gia tăng từ quyền chọn, khiến Bitcoin giảm từ 82.000 USD xuống còn 76.800 USD, thị trường bước vào giai đoạn chuyển tiếp nơi áp lực vĩ mô và quá trình thể chế hóa cùng tồn tại.
- Các yếu tố chính:
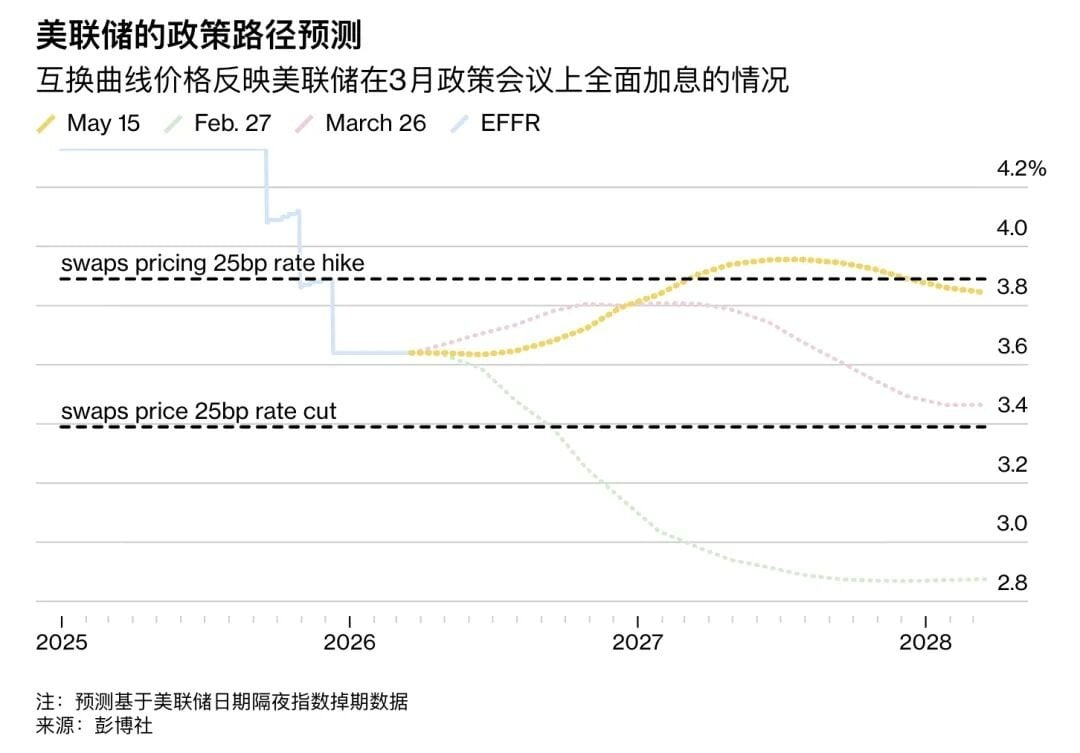
- Tân Chủ tịch Fed, Warsh, chủ trương tăng tốc thu hẹp bảng cân đối, định nghĩa lại mục tiêu lạm phát và giảm nhẹ định hướng tương lai; nhiệm vụ chống lạm phát ngắn hạn gây áp lực thanh khoản lên thị trường tiền mã hóa, và dữ liệu PPI trong tháng đầu tiên ông nhậm chức gây bất ngờ làm gia tăng kỳ vọng thắt chặt.Bán tháo đồng bộ trên thị trường trái phiếu toàn cầu: Lợi suất trái phiếu kho bạc Mỹ kỳ hạn 30 năm vượt 5,12% (mức cao nhất kể từ năm 2007), xác suất cắt giảm lãi suất giảm mạnh, kỳ vọng tăng lãi suất nóng lên, và câu chuyện lãi suất "cao hơn trong thời gian dài hơn" đánh vào tài sản rủi ro.Cộng hưởng ba áp lực bán: Dòng vốn ETF ròng chảy ra liên tiếp vượt 1,5 tỷ USD; Bán chủ động đồng thời trên cả thị trường giao ngay và hợp đồng vĩnh viễn; Độ lệch 25-Delta của quyền chọn tăng lên 14,4%, nhu cầu phòng ngừa rủi ro gia tăng đột biến.Rủi ro đình lạm nóng lên: CPI tháng 4 của Mỹ tăng lên 3,8%, PPI tăng vọt 6% so với cùng kỳ; thị trường ước tính xác suất xảy ra đình lạm đã tăng từ 11% lên 40% trong vòng một tháng, khiến Fed rơi vào thế khó xử về chính sách.Quá trình thể chế hóa không bị gián đoạn: Galaxy Digital thúc đẩy chuyển đổi sang năng lực tính toán AI; Một số nhà nắm giữ dài hạn tận dụng giá thấp để tích lũy; Lượng Bitcoin ròng chảy vào sàn giao dịch đạt 16,8 tỷ USD/tuần vào ví lạnh.Dự báo biến động thị trường: Dao động và củng cố trong biên độ ($75.000-$77.000, xác suất 55%), phục hồi tăng giá (tín hiệu nới lỏng + giảm căng thẳng địa chính trị, xác suất 25%), điều chỉnh sâu giảm giá (lợi suất trái phiếu kho bạc Mỹ vượt 5,2%, xác suất 20%).
1. Warsh Takes Over: Fed Power Transition and Policy Logic Restructuring
On May 15, 2026, Jerome Powell officially stepped down as Chairman of the Federal Reserve, handing over the reins on the expiration of his term to Kevin Warsh, a researcher at the Hoover Institution at Stanford University and a former Fed governor. Warsh's nomination was confirmed by a Senate vote of 54 to 45, a relatively close tally that foreshadowed sustained pressure on his policy stance from various quarters. On his first day in office, Wall Street appeared to "close gracefully" with the Nasdaq Composite rising over 1%, but deep-seated undercurrents of change were already stirring in market pricing.
Warsh's policy agenda revolves around three main directions. First, accelerating the reduction of the Federal Reserve's balance sheet. The current balance sheet size is approximately $6.7 trillion, which Warsh has criticized, advocating for a more aggressive drawdown. An accelerated reduction would effectively drain liquidity directly from the financial system, pushing up long-term interest rates and tightening the overall monetary environment, putting systemic pressure on risk assets, including crypto assets. Second, redefining the inflation target system. Warsh has questioned the authority of the 2% numerical target, favoring a vaguer "price stability" description. This could imply a higher actual tolerance for inflation, but also increases policy arbitrariness and makes market forecasting more difficult. Third, downplaying forward guidance and the dot plot. Warsh advocates for reducing or eliminating predictive tools like "forward guidance" and the "dot plot," aiming to increase the Fed's policy flexibility. However, this would also amplify information friction between the market and the central bank, exacerbating short-term volatility.
For the crypto market, Warsh's stance has a nuanced duality. Before being nominated as Fed Chair in January 2026, Warsh publicly stated that Bitcoin is an "important asset" and a "good policeman for policy," showing an overall open attitude towards cryptocurrencies. However, this moderate stance creates a structural contradiction with his immediate pressing tasks: facing a PPI year-over-year surge of 6% in his first month in office, Warsh must prioritize proving his anti-inflation credibility over promoting crypto-friendly policies. Therefore, in the short term, Warsh's anti-inflation mandate puts liquidity pressure on the crypto market. In the long term, his stance on digital assets might foster a friendlier regulatory environment for institutional entry into the crypto market. Weighing the two, the market's short-term focus remains on when the liquidity tightening will truly materialize, rather than distant regulatory dividends.
2. Bond Market Turmoil: Alarm Bells of a Global Liquidity Inflection Point
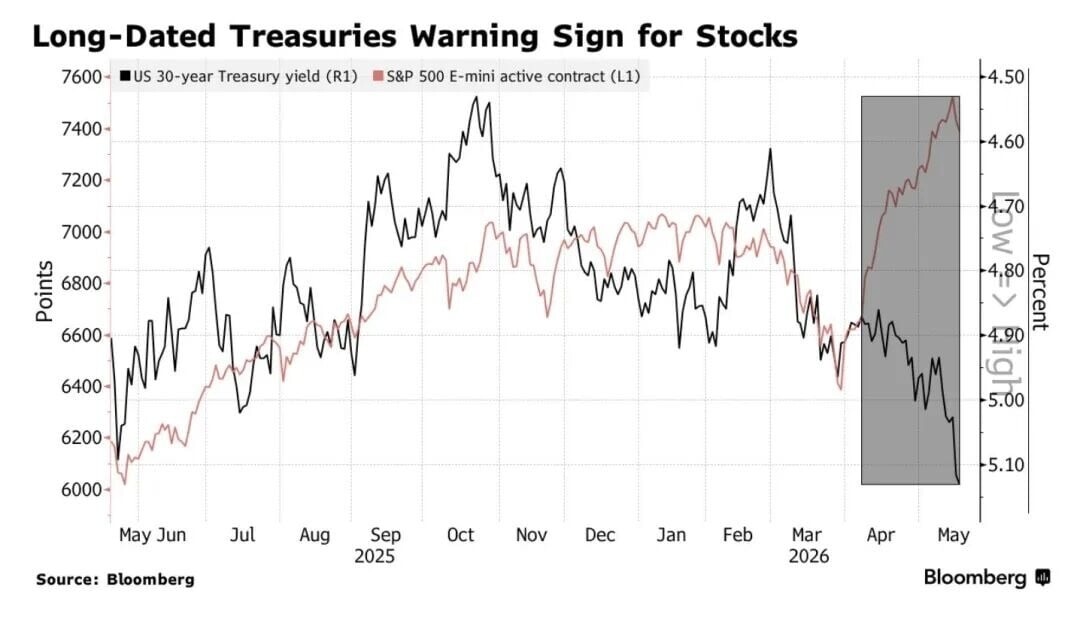
If the change in Fed leadership was merely a disturbance at the expectation level, the contemporaneous upheaval in the bond market represented a much more direct reality shock for risk assets. In May 2026, global bond markets experienced a rare selloff, with government bond yields across multiple countries surging to multi-year or even multi-decade highs. The US 30-year Treasury yield broke through the psychological 5% barrier in mid-May, hitting 5.12%, its highest level since 2007. The 10-year US Treasury yield climbed in tandem to 4.63%, a rare high in recent years. Japan's 10-year government bond yield hit a 30-year high of 2.797%, the UK 30-year Gilt yield reached 5.86%, France's 30-year OAT yield hit 4.675%, and even Germany's 30-year Bund, long near negative territory, rose to 3.704%.
The immediate trigger for this global bond selloff was the surprising US April PPI data. PPI rose 1.4% month-over-month, significantly exceeding the market expectation of 0.3%, marking the largest single-month increase since 2022. The year-over-year PPI reached 6%, almost offsetting the results of the Fed's three-year fight against inflation. As a leading indicator for CPI, the surge in PPI made the market realize that inflation was not falling back to the 2% target as expected, leading to an immediate global repricing. More critically, the market's expected path for rate cuts was completely shattered. Before the selloff, the market widely anticipated two rate cuts in 2026, with the first cut in June being almost certain. After the selloff, the probability of a rate cut plummeted to 15%, and expectations of a slight rate hike even began to emerge, with the probability of a 25-basis-point hike by July 2027 rising to 60%. The "Higher for Longer" narrative has made a comeback.
The surge in bond yields transmits to the crypto market through multiple channels. First is the rising opportunity cost; higher risk-free rates make non-yielding assets like Bitcoin less attractive compared to cash and short-term Treasuries. Second is the decline in risk appetite; under the expectation of tightening liquidity, high-beta assets face systematic selling. Third is the strengthening US dollar; rising real interest rates typically accompany a stronger dollar index, placing additional downward pressure on risk assets denominated in dollars. Fourth is the leverage accelerator effect; the market had accumulated significant leveraged long positions in early May 2026, and margin calls triggered forced selling, creating a cascading deleveraging waterfall. Data shows that on the day Bitcoin hit the low of $78,704 alone, over $304 million in leveraged longs were liquidated across the market, with Bitcoin longs accounting for approximately $94 million. This series of transmission links collectively forms the macroeconomic foundation for this round of Bitcoin's sharp decline.
3. Bitcoin Plunge: The $76K Key Support Battle and the Resonance of Triple Selling Pressure
In mid-May 2026, Bitcoin experienced a sharp new decline since the start of 2026 under the resonance of multiple macroeconomic pressures. It fell from around $82,000 to $76,800, a drop of about 6% during the period, with over $304 million in leveraged longs being cleared across the market. Notably, the peculiarity of this decline lies in the simultaneous appearance of triple selling pressure signals, making it difficult for market participants to simply attribute it to a technical correction.
The first source of selling pressure came from the sustained withdrawal of institutional funds from ETFs. Starting from May 7, 2026, US spot Bitcoin ETFs recorded consecutive net outflows. A single-day outflow of $648 million set a new high since January 29. Cumulative net outflows since May 7 have exceeded $1.5 billion. This scale of institutional capital exodus indicates a fundamental shift in institutional investors' macro-pricing logic for Bitcoin. They no longer view Bitcoin as a beneficiary asset in an accommodative monetary environment but are beginning to incorporate it into the traditional risk asset pricing framework for hedging. ETF outflows are both a result and a cause of the decline: falling prices trigger programmatic stop-losses, which in turn exacerbate selling pressure, creating a negative feedback loop.
The second source of selling pressure came from synchronized active selling in both the spot and perpetual contract markets. Glassnode data shows that the Cumulative Volume Delta (CVD) for the spot market plummeted from +$16.9 million to -$126.2 million, while the CVD for the perpetual contract market recorded a significantly negative -$368.5 million. Both turning negative simultaneously indicates that sellers are actively dumping in both the spot and futures markets, rather than being passively liquidated. Historically, this pattern of simultaneous active selling in both markets often corresponds to a more sustained selling pressure cycle, as passive liquidations are one-off events, whereas active selling reflects the sellers' persistently bearish outlook.
The third source of selling pressure came from a sharp increase in hedging demand in the options market. The 25-delta skew for options rose rapidly from 10.9% to 14.4%, reflecting a significant increase in market participants' demand for protection against downside risk. A higher skew indicates stronger relative demand for put options, an instinctive reaction from institutional investors when exposed to systemic risk. Vikram Subburaj, CEO of the Indian exchange Giottus, pointed out that Bitcoin's first support level is around $76,000, with a secondary support zone between $74,000 and $75,000. A break below this area could trigger a deeper correction. From an on-chain data perspective, the $76,000 to $75,000 range corresponds to price levels before the 2024 ETF-driven rally and is also a high-volume trading zone for leveraged positions. Its loss would likely trigger a larger cascade of technical stop-loss selling.
4. Stagflation Fears Reignite: The Dual Dilemma of Sticky Inflation and Slowing Growth
The US April CPI rose 3.8% year-over-year, its highest level since June 2023. PPI surged 6% year-over-year, with a 1.4% month-over-month increase, the largest since 2022. The probability of stagflation (experiencing a stagflationary shock before year-end) jumped from 11% to 40% within a month, and the market's pricing of "stagflation" is rapidly intensifying. The terrifying aspect of these data points is not just the numbers themselves, but their fatal compression of the Fed's policy space. Traditionally, slowing growth calls for rate cuts, but high inflation prevents the Fed from cutting rates. Combating inflation requires rate hikes, but signs of slowing economic growth limit the space for hikes. The Fed is trapped in a "two-front dilemma," and the persistence of this dilemma is itself the biggest source of market uncertainty.
The impact of rising stagflation risk on the crypto market is particularly complex. From a nominal interest rate perspective, high inflation pushes nominal rates higher, raising the benchmark for risk-free returns and increasing the opportunity cost of holding zero-yield assets like Bitcoin. From a real interest rate perspective, if nominal rates rise less than inflation, real rates could still fall, theoretically providing some support for Bitcoin. However, the peculiarity of this cycle is the Fed's visibly lagging policy response. The market has already begun repricing for rate hikes, while the Fed is still in a transition period under its new chair. This "policy vacuum" prevents the market from relying on the "Fed put" (the implicit promise of central bank intervention during market crashes), amplifying the magnitude of downside volatility.
Meanwhile, global risk assets are experiencing a synchronized decline. South Korea's KOSPI index fell 6.12% in a single day, triggering a circuit breaker. Japan's Nikkei 225 fell 6.22%, the Nasdaq fell 1.54%, and the Shanghai Composite fell 2.5% over two days. This pattern of synchronized cross-market declines indicates that this adjustment is not an isolated event for the crypto market, but a systematic reflection of global liquidity tightening across various risk assets. The bond market has "sounded the alarm" for both the AI bull market and crypto. When the "safety cushion" of risk-free rates disappears, all high-valuation assets relying on discounted future cash flows face repricing pressure.
5. Market Structure Observation: Institutionalization Progress and Internal Divergence
Despite the sharp short-term price decline, the institutionalization process of the crypto market has not been interrupted by this adjustment. Galaxy Digital successfully completed the initial delivery for its first Bitcoin hash rate-related investment product aimed at institutional clients, delivering the first Phase 1 data hall to CoreWeave (CRWV) on time and on budget. This marks the transition of Bitcoin mining infrastructure towards AI/HPC compute power leasing entering a phase of substantial commercialization. The continuation of this structural trend suggests that institutional capital is still systematically increasing its allocation to core crypto assets over a longer-term horizon, rather than abandoning its strategy due to short-term volatility.
At the same time, the divergence within the crypto mining camp is intensifying. Keel Infrastructure (formerly Bitfarms) reported a Q1 2026 net loss of $145.4 million and a 23% year-over-year revenue decline to $37 million. However, its stock price rose over 8% on the day of the earnings release. The market's focus was not on the loss itself, but on whether its 2.2GW pipeline of AI/HPC data center developments can be converted into formal leases between 2027 and 2028. This narrative of "swapping legacy Bitcoin mining assets for long-term AI infrastructure leases" is becoming the most recognized logical thread by the market within the mining transformation camp.
On-chain data also reveals a divergent characteristic of "accumulation amidst panic." Despite significant ETF outflows, the net inflow of Bitcoin to exchanges has accelerated. Approximately $1.68 billion per week is flowing into cold wallets, indicating that some long-term holders are accumulating coins at the lower prices. The supply held by long-term holders has started to stabilize, and the selling of high-cost coins in the $100,000 to $126,000 range has largely been completed. This suggests that potential selling pressure has been significantly released. Historically, when the derivatives market is in an extreme bearish positioning (the 30-day funding rate is at the 6th percentile, the lowest since early 2023), it often precedes a sharp rebound rather than a sustained decline. This is because when nearly all participants are already short, the source of additional selling pressure is limited, but any rebound catalyst can trigger a massive short squeeze, fueling a V-shaped reversal.
6. Conclusion: Three-Scenario Analysis and Investment Framework
Looking ahead to the crypto market direction in late May and June 2026, the probabilities and trigger conditions for three scenarios warrant close attention. The most likely scenario is "range-bound consolidation." Bitcoin would find technical support in the $75,000 to $77,000 range, with the market digesting macro headwinds while awaiting new catalysts. If bond yields can stabilize and the $76,000 support holds, the market might enter a 2 to 4-week consolidation phase, awaiting the next directional signal. In this scenario, the overall crypto market presents a pattern of "unable to fall, unable to rise," with alpha opportunities arising more from individual coin selection rather than systematic long positioning.
A bullish scenario requires the resonance of dual or multiple positive catalysts. First, a clear accommodative signal from the Fed or Warsh (e.g., a dovish stance at the June FOMC meeting). Second, a substantial de-escalation of geopolitical tensions in the Middle East (e.g., the Strait of Hormuz issue returning to the negotiating table). Third, confirmation that April inflation data is trending lower. If all three conditions are met simultaneously, reignited rate cut expectations could drive Bitcoin to quickly reclaim the $80,000 integer level and potentially challenge the $85,000 to $87,000 range. The probability of a bullish scenario is currently assessed at around 25%, with the main obstacle being that Warsh's early tenure makes a rapid pivot to accommodation unlikely.
The bearish scenario is the direction requiring the most vigilance. If the 30-year US Treasury yield continues to climb and effectively breaks through the 5.2% to 5.3% range, the rapid rise in risk-free rates could open up downside space to $74,000-$75,000. A more extreme tail risk involves opening the channel to $54,000-$38,000 (corresponding to Stifel's trendline analysis target), which would imply a complete retracement of the 2025 bull gains and a significantly prolonged bear market. The bearish scenario currently has a probability of about 20%, but presents asymmetric risk-reward. Once the $74,000 support is lost, programmatic stop-losses could trigger a stampede, pushing prices below the range justified by fundamentals.
In summary, the current market is at a structural inflection point where "macro stress testing" coexists with "deepening institutionalization." The alarm from the bond market has not yet been lifted, and the $76,000 to $75,000 support zone faces a severe test. However, against the backdrop of extreme bearish sentiment, continued accumulation by long-term holders, and the unfolding narrative of mining transformation, bottom signals are also gradually accumulating. Investors at this stage should maintain portfolio flexibility, avoid chasing rallies or heavily buying the dip, and patiently wait for the macro inflection point to emerge. When the "Fed put" becomes effective again and yields start to turn lower, the next upswing in the crypto market will have a more solid macro foundation.


